How to make a project plan presentation for clients and stakeholders
Elevate your project presentations to new heights! Learn the art of captivating clients and stakeholders with our expert tips.

Updated on February 27, 2024
Ever wondered what sets successful project managers apart? It’s the knack for delivering killer project presentations. Whether you’re gearing up for a stakeholder meeting or updating the higher-ups, nailing clear communication is the name of the game.
In this article, we’re not just talking about how to showcase data – we’re diving into the art of creating engaging project plans that captivate clients and stakeholders.
To help you transform your project presentations, we’ll share insights into how to:
- Simplify your approach for impactful communication.
- Visualize project plans effectively to captivate your audience.
- Select the right chart type for your project.
- Streamline project organization using Excel.
Get ready for practical tips and actionable techniques to make your presentations shine, breaking down the barriers of business communication right from the start!
1. Simplify your presentation for impactful communication
When presenting to project stakeholders, it’s crucial to move beyond mere data and offer a compelling narrative. Rather than drowning in the details of a project charter, consider crafting a visually engaging project roadmap. This approach allows you to add context and to delve into specifics as needed.
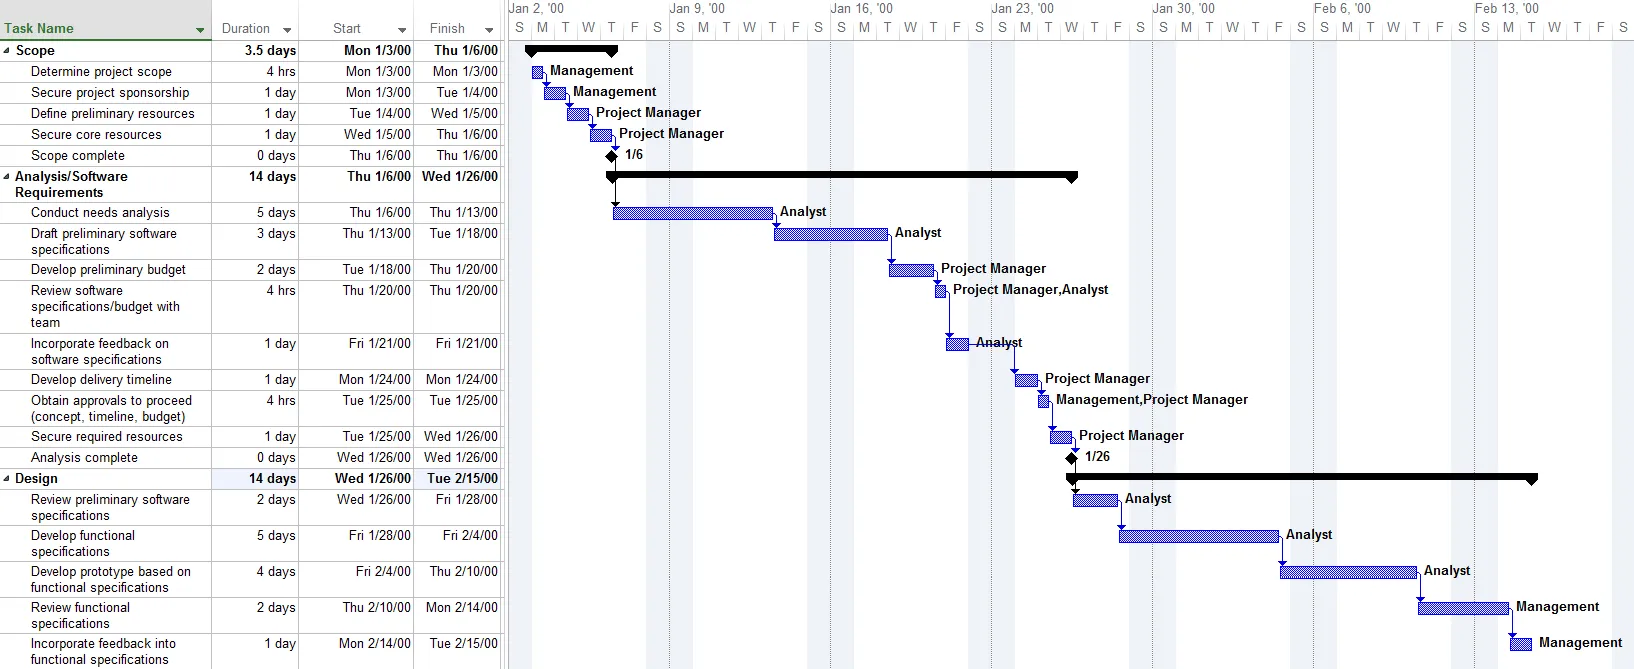
While Microsoft Project is commonly used in the planning phase, its detailed Gant chart views (like the example below), may not effectively convey key insights during stakeholder meetings. This is why your next executive-level project review should rely on more visual project management tools to lay out the strategic planning process. The goal is to make complex information easily digestible while ensuring stakeholders grasp the business implications.
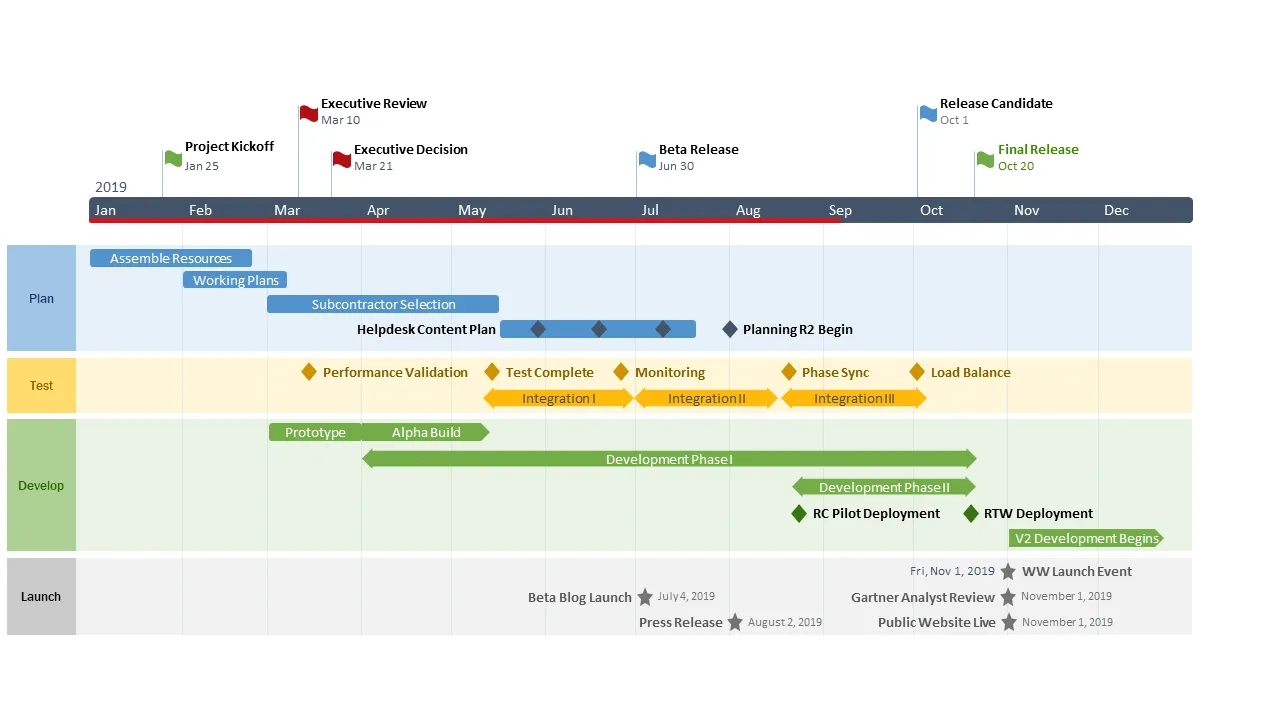
An exec-level project review should summarize the strategic planning process and showcase its progress in a visually appealing manner. Remember: the challenge consists of making the information easy to digest and ensuring that audiences understand the business implications.
2. Visualize project data effectively
The best option for outlining a project’s plan is to create a workflow diagram that correlates the tasks with the critical milestones, as shown in the Gantt chart example below:
Presenting the project roadmap in this manner helps your stakeholders quickly see the scheduled tasks, as well as their duration, sequences and other task dependencies, all of which define the critical path. Furthermore, connecting the project activities (tasks) with the project events (milestones) offers clients and execs more insight, which translates to better management decisions.
3. Select the right type of graphic for your project – Timelines vs Gantt charts
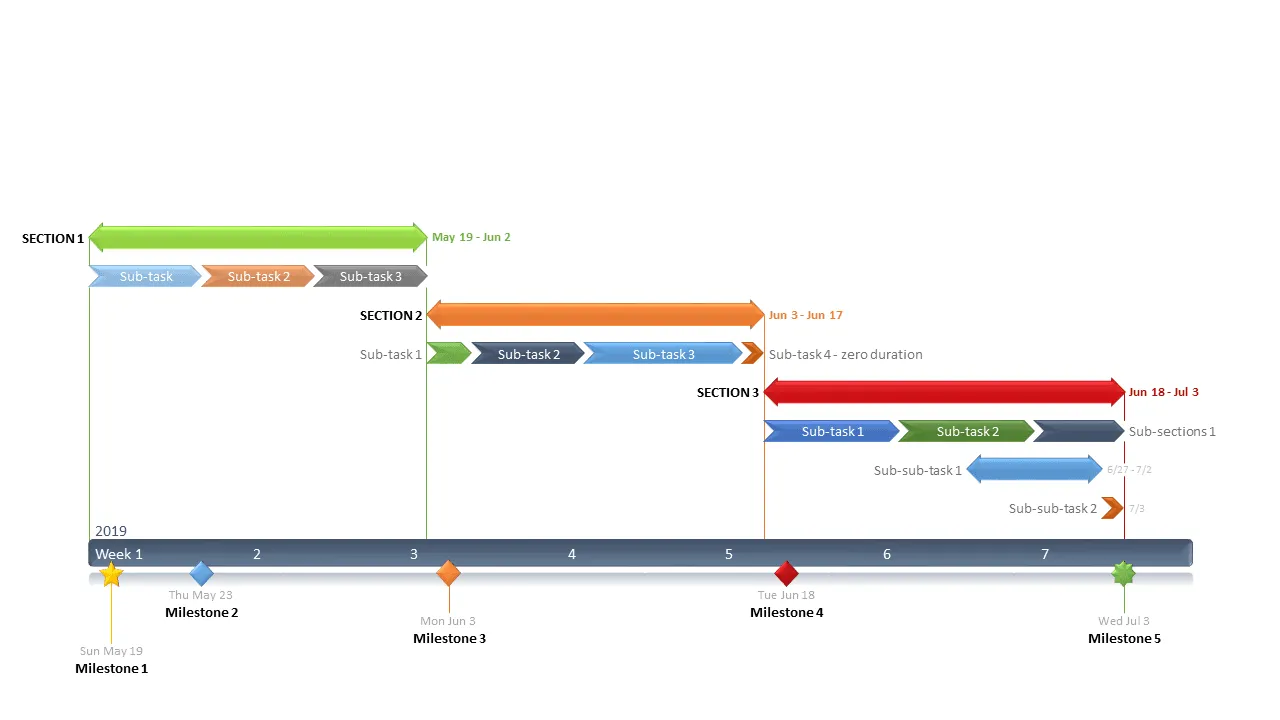
When it comes to visually representing your project’s strategic planning process, two main options are commonly used: timelines and Gantt charts. While timelines focus primarily on events, such as milestones, Gantt charts typically depict activities or tasks. However, to create an ideal project presentation, it’s crucial to strike a balance between showcasing both tasks and milestones.
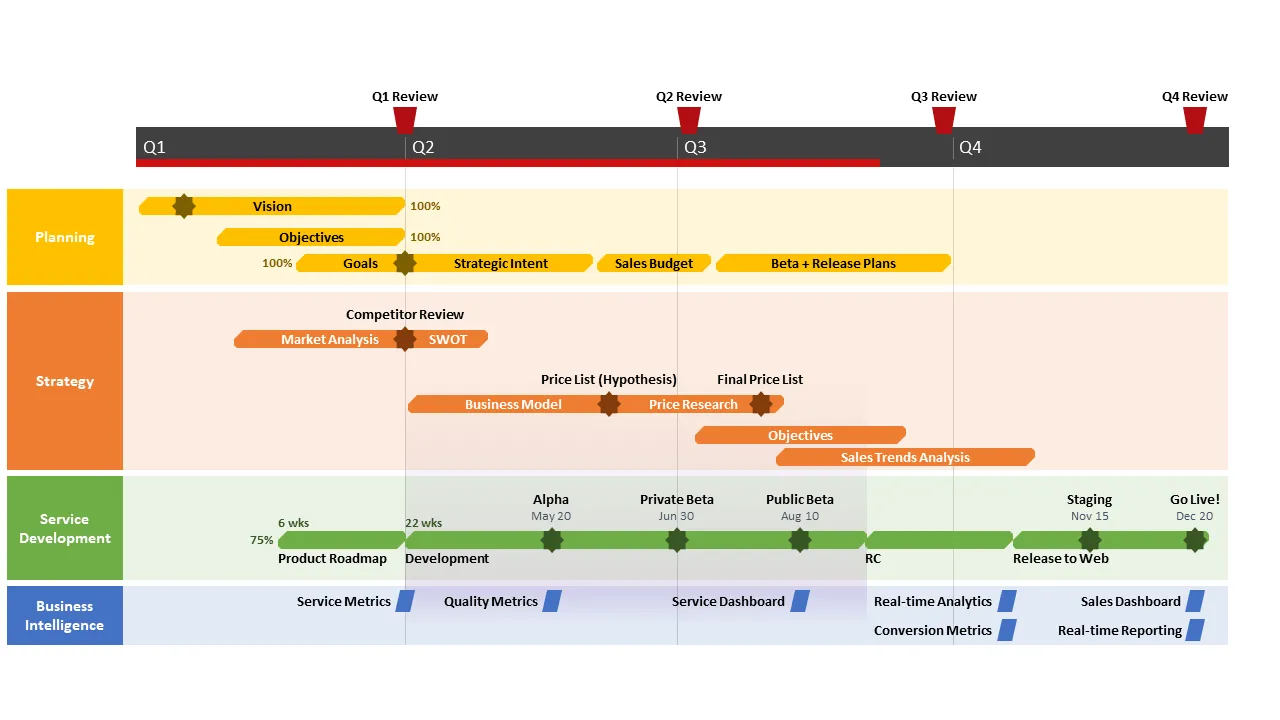
To ensure clarity and coherence, consider utilizing a unified graph, such as a swimlane diagram. This type of graphical representation allows you to categorize tasks and milestones according to their specific project life cycle phase, providing a comprehensive overview of your project’s progress.
To decide which of the two visual project management charts serves you best, check out our case study on the benefits of using timelines in project presentations or our article on the do’s and don’ts of creating a Gantt chart.
Next, let’s take a comparative look at two frequently used alternatives for visually rendering a project charter, Excel and PowerPoint. We will explain how to make a Gantt chart in Excel using a bar graph, and how to make an Excel timeline using a scatter graph. We will also show you how to quickly make a single, unified Gantt chart + Timeline presentation in .PPTX by using our add-in for PowerPoint, Office Timeline.
4. Streamline project data organization in Excel
Whether or not you’re going to create the Gantt chart in Excel, this application from the Microsoft suite is a great place to start drafting the project schedule. More exactly, you will need to create the Work Breakdown Structure (WBS) by breaking down the project into smaller pieces of work – the tasks. Make an Excel project management template that you can reuse, then list each of the tasks on the data table in the correct sequence. The tasks will form the project Gantt chart and their order will determine the project schedule.
Another important piece of the puzzle to integrate in your Excel project management template is the milestone section. Project milestones consist of all major deadlines your plan must achieve, and they form your Excel timeline. We have included a Work Breakdown Structure example below, for clarity purposes.
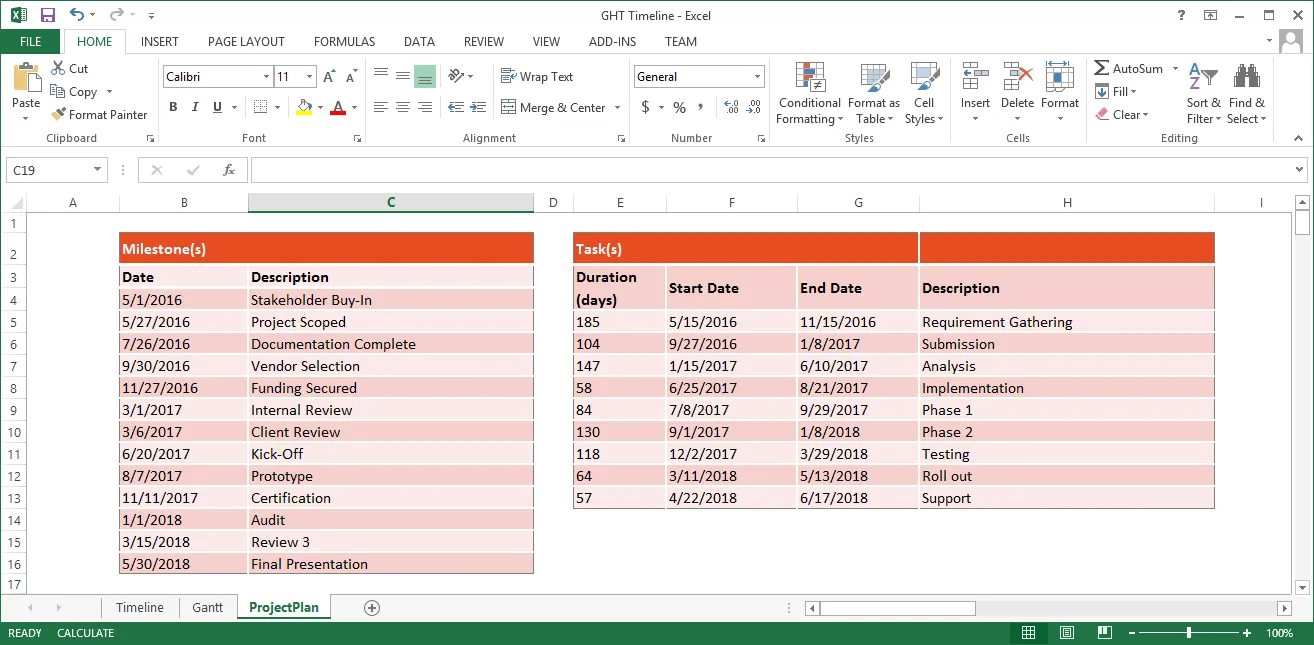
Note: Keep in mind that this is a high-level presentation aimed at executives and stakeholders, so it should not be overly complex. Consider trimming it down if the project schedule contains more than 20 tasks and 20 milestones, in order to facilitate understanding and keep the audience engaged.
Option 1: Making the Excel graphs
It’s worth noting that Excel is nowhere near as graphics-oriented as PowerPoint. The direct result is that your Excel Gantt charts and timelines will tend to look more like stacked bar graphs and, respectively, scatter charts.
Another drawback is that Excel doesn’t allow you to combine a Gantt chart (tasks) with a timeline (milestones) into a unified project roadmap. Therefore, you will need to create two separate visuals and combine them on one slide or present them individually. In order to do that, you will first need to make a Gantt chart showing the tasks of your project plan and then a timeline with your project milestones. Here’s how:
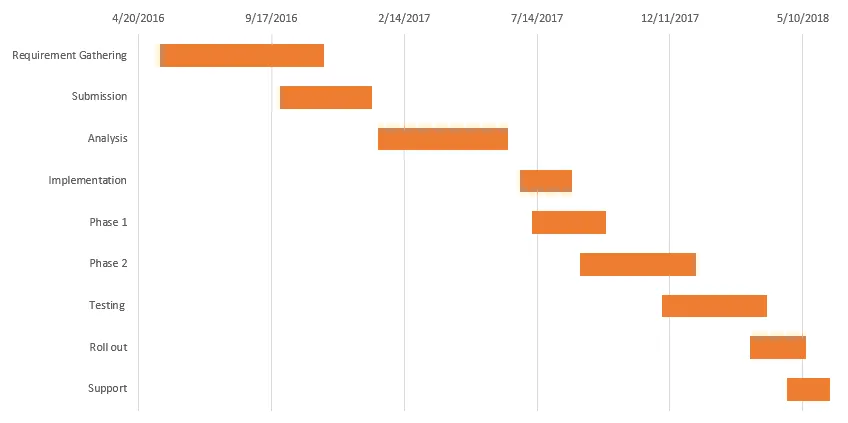
- Step 1: Create a Gantt chart in Excel with the stacked bar chart function
Once you have your project schedule in Excel you will add the task data into an Excel stacked bar graph and then follow approximately 20+ formatting steps to transform it from a stacked bar chart into an Excel Gantt chart, which will end up looking something like the chart below. For detailed instructions, please check out our guide on how to make a Gantt chart in Excel.
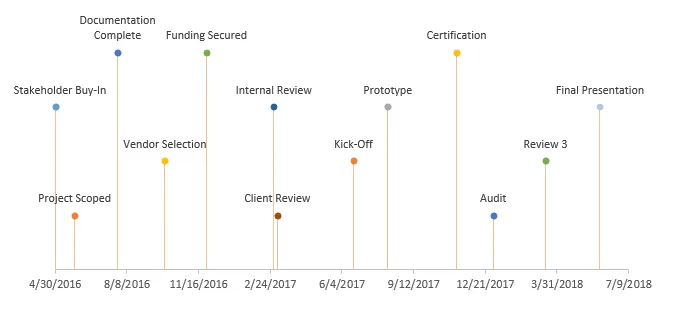
- Step 2: Create a timeline in Excel using the scatter chart function
To create a timeline in Excel you will need to use a scatter chart. Add your data to the scatter chart then follow approximately 25 steps to format it so it looks like a timeline presentation, as shown below. If that’s easier, check out our easy-to-follow, step-by-step guide and a how-to video tutorial.
Note: However familiar and accessible this Microsoft application may be, there are certain limitations that make it less than ideal for project presentations, including:
- No method to combine an Excel Gantt chart with a timeline. Executives and stakeholders should be able to view the tasks and milestones in conjunction with each other for better visibility into the critical deadlines and activities.
- Making a project roadmap featuring a timeline or Gantt chart in Excel requires advanced operating skills. Converting Excel’s stacked and scatter charts into Gantt charts and timelines depends on properly following a specific sequence of formatting steps.
- The resulting diagrams are not as visually appealing as a PowerPoint slide and considerably more difficult to share with everyone involved.
Option 2: Create the project roadmap as a native PowerPoint slide
So far, we have shown you how to make a Gantt chart in Excel and mix it with a timeline, in order to provide your stakeholders with a 2-part overview of your project schedule. Next, let’s take a look at the alternative: using a PowerPoint timeline maker with embedded Gantt chart functions to generate a slide with both graphics combined.
PowerPoint is perceived as a superior tool for building project presentations. Since it is a graphical application, it is designed for creating and communicating charts in a visual way. Additionally, since it’s a common tool in enterprises, PowerPoint is familiar to audiences, and slides can be easily shared. There are two main ways to build project slides in PowerPoint using our Office Timeline add-in:
- Create the Work Breakdown Structure template in Excel and import the data
Earlier in the article we included a Work Breakdown Structure example made in Excel. The first option relies on using the import feature from Office Timeline and bring in the data tables with tasks and milestones. To import the project schedule you created in Excel, use the Office Timeline wizard which will link to your project spreadsheet (or .MPP file, if you prefer Microsoft Project). Here’s a quick demo:
Play Video
There’s another reason to import the data from an Excel spreadsheet and that’s the refresh data feature. In short, since the PowerPoint slide is linked to a worksheet, it can be synchronized and updated with the click of a button when the spreadsheet data changes. Check out our support article that explains how the sync process works.

Note: For better visibility, Office Timeline also allows you to import tasks and milestones directly into swimlane templates.
2. Use a Gantt chart or timeline template (swimlanes are also supported)
There are definitely advantages to importing the data file from an external application like Excel or Microsoft project. However, that isn’t your only option. Office Timeline comes with an extensive collection of professional templates that can easily adapt to a wide variety of different project types. These timeline templates are embedded in the add-in and there is also a free gallery with new ones added regularly, for your convenience. Here’s a quick overview of the template functionality:
Play Video
Simply replace the default data with your own tasks and milestones, and Office Timeline generates the graphic for you.
Note: Customizing a timeline or Gantt chart template with your own data can be done at any time from the user-friendly and highly intuitive interface. Update it easily whenever there are changes in your project schedule, restyle it and share it with your team, all from within PowerPoint. It’s very flexible!
Conclusions
Mastering the art of presenting project plans to clients and stakeholders is essential for project managers. By simplifying your approach, visualizing project plans effectively, selecting the right chart type for your data, and streamlining the way you organize your information, you can elevate your presentations to new heights. With these tips and tricks in hand, you’ll be well-equipped to captivate your audience and drive successful project outcomes.
If you regularly find yourself liaising with the management or your stakeholders and dread the thought of spending hours creating presentations with the traditional tools in the Microsoft Office suite, then check out Office Timeline. Available as a free version, this handy project roadmap-creation app can save you time and ensure you drive your point home without the drawback of an intimidating learning curve. For the more complex timelines, we recommend giving the tool's most advanced edition a try.
FAQs about making client and stakeholder presentations
Gain insight into how you can improve your project plan presentations to clients and stakeholders with our Q&A section. Below, we offer you the answers to the most common questions related to the topic.
To be relevant to your stakeholders, your project plan presentation should include a high-level overview of the following items:
• Goals
• Timelines
• Milestones
• Key deliverables
• Risks
• Budget.
To ensure that your project plan presentation engages your C-suite audience, incorporate visual aids such as project management charts and diagrams to make complex information more digestible. Focus on telling a compelling story that highlights the project’s objectives, benefits, and potential impact.
Learn more about how to capture your stakeholders’ attention during presentations with our article on why stakeholders usually ignore project reports and how to fix that.
Effectively communicate project progress by providing clear updates on completed tasks, ongoing activities, and any potential roadblocks or challenges. Use visual progress indicators such as Gantt charts or timelines to illustrate milestones achieved and remaining tasks.
Be prepared to address questions and concerns promptly and thoroughly. Take the time to listen actively, clarify any misunderstandings, and provide relevant information or data to alleviate concerns.
Yes, it’s essential to customize your presentation to resonate with the specific interests and priorities of different stakeholders. By tailoring your content to address their unique needs and concerns, you will be able to get the message across in a more effective way and ensure that you gain their support throughout your project’s life cycle.
Learn how to correctly identify, analyze, and prioritize the parties that may be affected or have an impact on your project with our blog post on stakeholder analysis.
When presenting project plans to clients and stakeholders, it’s crucial to steer clear of common pitfalls that can hinder effective communication and understanding. Here are some of the most important ones to keep in mind:
• Avoid using overly technical language or jargon – while you may be well-versed in technical terminology related to your project, it’s essential to remember that not all stakeholders may share the same level of expertise. Using complex jargon can lead to confusion and misinterpretation. Instead, strive to communicate in clear, straightforward language that everyone can understand, regardless of their background or expertise.
• Be transparent about risks and challenges – every project comes with its own set of risks and challenges, and it’s vital to address them openly and honestly during your presentation. Transparency builds trust and demonstrates your commitment to managing potential obstacles effectively. Discussing risks also allows stakeholders to provide input and support in mitigating them, fostering a collaborative approach to project management.
• Avoid making unrealistic promises or commitments – although it may be tempting to promise quick results or guaranteed success, it’s essential to be realistic and honest about what can be achieved within the project’s constraints. Making unrealistic promises can set false expectations and ultimately lead to disappointment if objectives are not met. Instead, focus on presenting a realistic project plan with achievable goals and timelines, based on thorough gap analysis and assessment.
By avoiding these common mistakes, you can ensure that your project plan presentation effectively engages stakeholders, fosters understanding, and sets the stage for successful project execution.
Send a follow-up email summarizing key takeaways, action items, and next steps discussed during the presentation. Encourage stakeholders to reach out with any further questions or concerns.
To enhance your presentations, consider using project management tools that will help you organize, manage, and track complex data in a visual way. Additionally, presentation platforms like PowerPoint can help you design professional-looking slides based on your project information.
Designed as a PowerPoint plugin, Office Timeline offers the best of both worlds – it allows you to import project plans from productivity tools like Microsoft Project, Excel, or Jira and turn it into presentation-ready high-level slides that can be quickly shared and updated.
For more resources on how to process and communicate project data visually, check out our review of the 8 best visual project management software.
Tim is Co-Founder & CEO of Office Timeline, a Seattle-based start-up that aims to rid the world of boring, uninspiring meetings.
Tagged With:
Project reportsTurn project data into professional timelines
Get the advanced features of Office Timeline free for 14 days.
