What are visual project management tools?
Visual project management tools are software solutions that help teams organize project data in a visual format and manage tasks more effectively. By turning complex information into simple, easy-to-grasp graphics, these tools enable project managers and teams to clearly communicate timelines, schedules, workflows, and roadmaps.
Despite the name, visual project management software isn’t designed only for project managers. It can be adapted to fit teams of all sizes and across industries, supporting different goals and collaboration styles.
Why use visual project management tools?
Adopting visual project management software brings a wide range of benefits. Here are seven of the most impactful:
1. Strengthened communication and collaboration
Visual PM tools centralize data in one place, creating clarity around ownership, responsibilities, and priorities. Features like task delegation, resource sharing, and progress tracking keep everyone aligned and make status reporting easier – whether within the team or to clients. This transparency is especially valuable for teams working with agile project management methodologies.
2. Better resource allocation and workload management
From staff hours to budgets, visual project management systems help you track and allocate resources effectively. With calendars, Gantt charts, and task duration tracking, you gain visibility into time, capacity, and costs -ensuring resources are used where they deliver the most impact.
3. Streamlined project analysis and reporting
Most project visualization tools come with dashboards and reporting features that highlight key metrics like deadlines, completion rates, or cost variance. These insights allow you to refine processes, reduce delays and waste, and provide stakeholders with actionable updates across the project lifecycle.
4. Centralized and organized project data
A dedicated PM tool acts as a single source of truth. Teams can store and update documents in one place, ensuring accuracy and transparency. This reduces duplication and guarantees that everyone works from the same version of project information.
5. Support for remote and hybrid work
Because most visual project management software is SaaS-based, teams can log in from anywhere with an internet connection. This makes it easy to track tasks, update progress, and share documents remotely – critical for distributed teams and new project onboarding.
6. Proactive risk identification and mitigation
By consolidating data into visual dashboards and reports, project management tools make it easier to spot risks, dependencies, and bottlenecks before they escalate. Teams can act faster on potential issues and seize opportunities as they arise.
7. Greater process standardization
As projects scale and teams grow, workflows can become inconsistent. With templates, customizable charts, and repeatable processes, visual project management tools help standardize how work is planned, executed, and reported – ensuring consistency across the board.
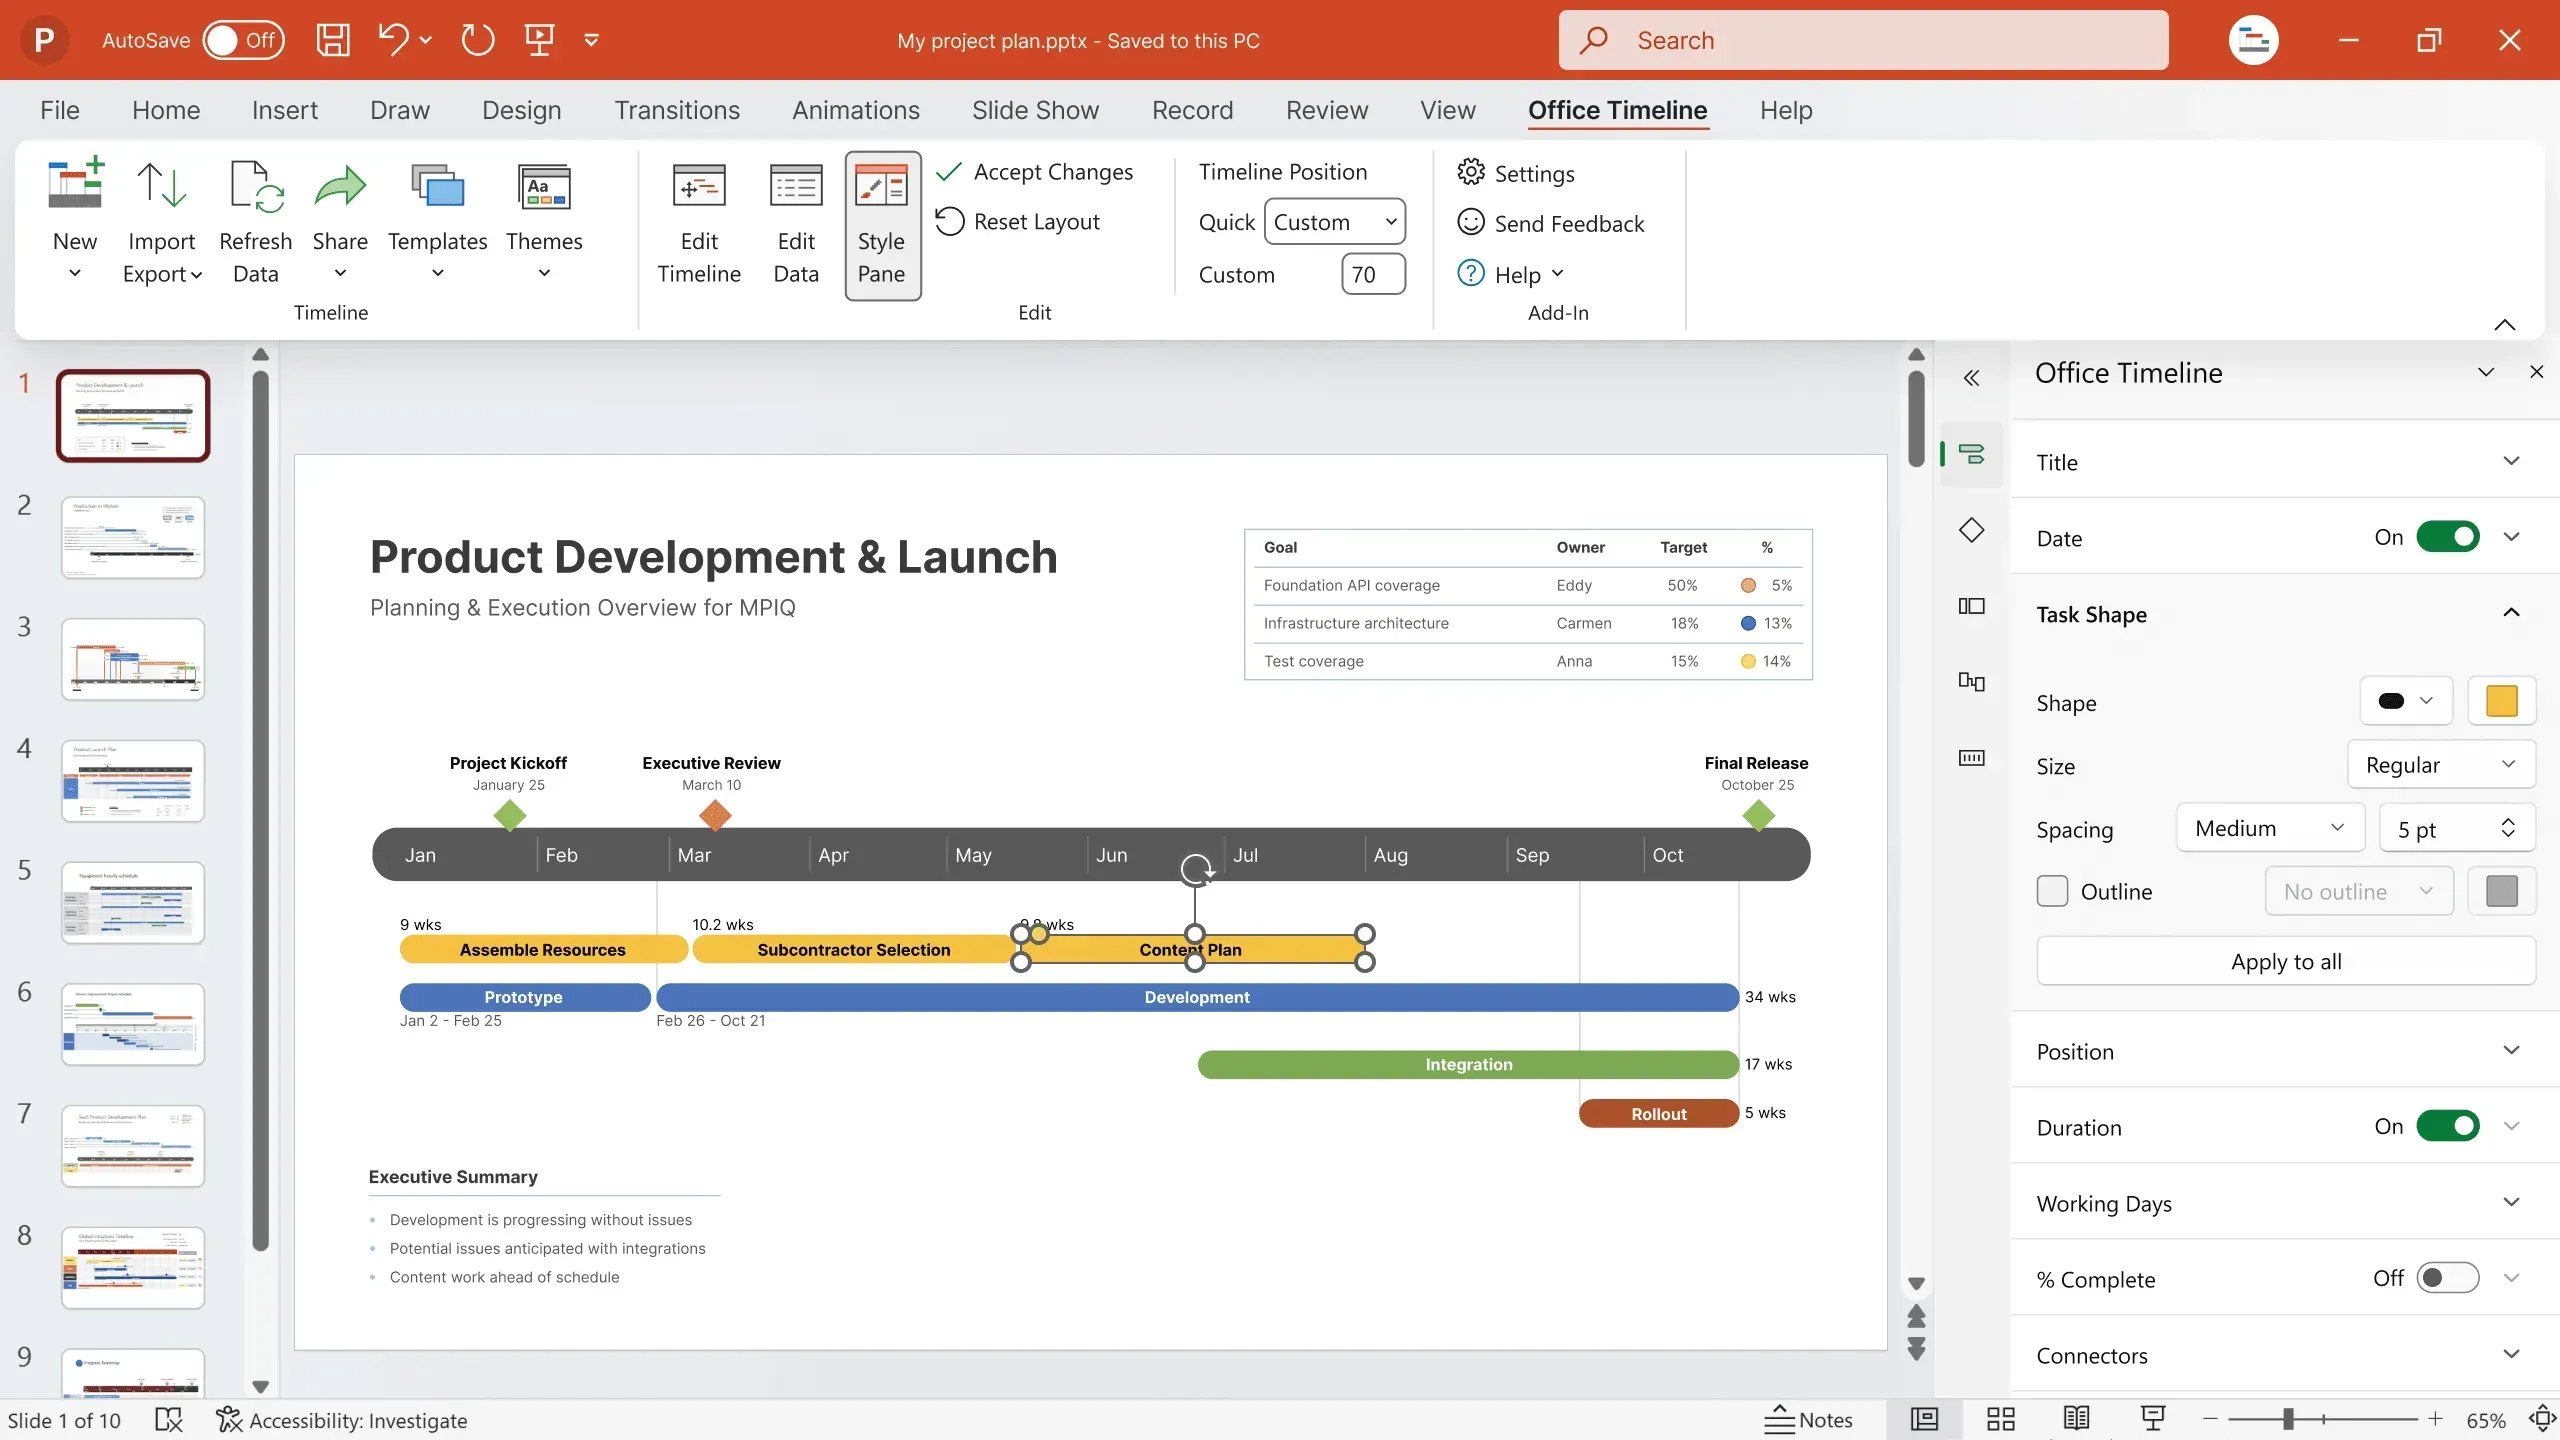
Visualize project plans in minutes
With Office Timeline, import your data, customize templates, and build presentation-ready project visuals you can update and share instantly.
How to find the best visual project management tools
When choosing visual project management software, look for these core features:
- Task management – Create, assign, and track project activities as they progress. Key functions include setting due dates, grouping tasks and subtasks, adding checklists, and marking milestones.
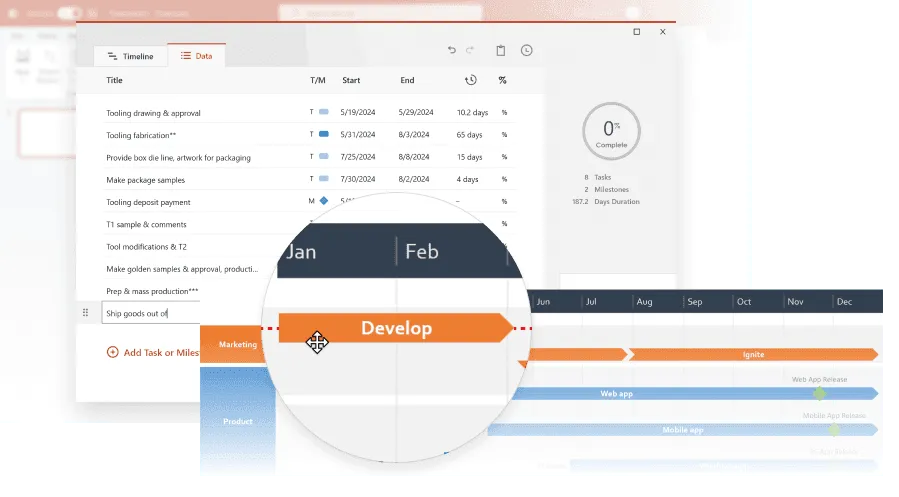
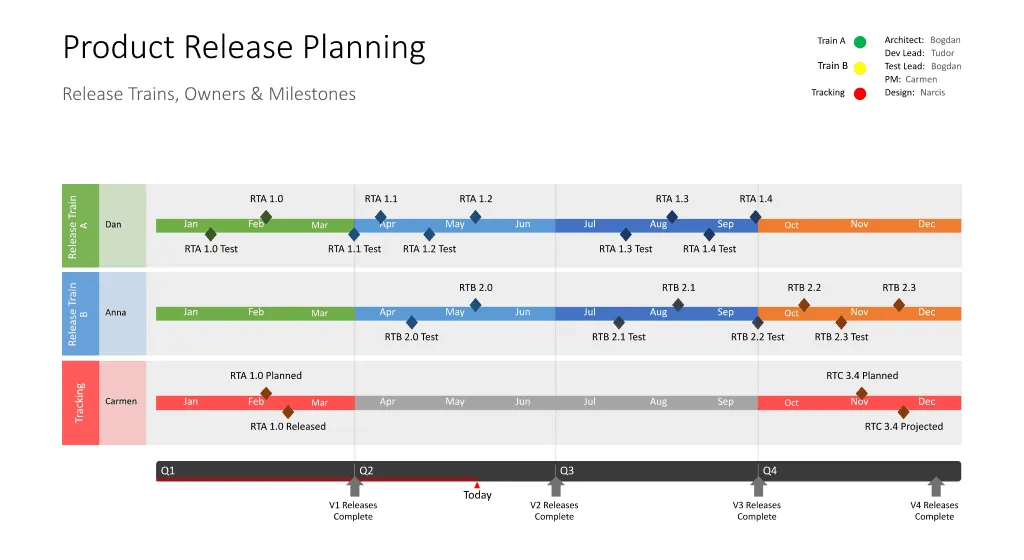
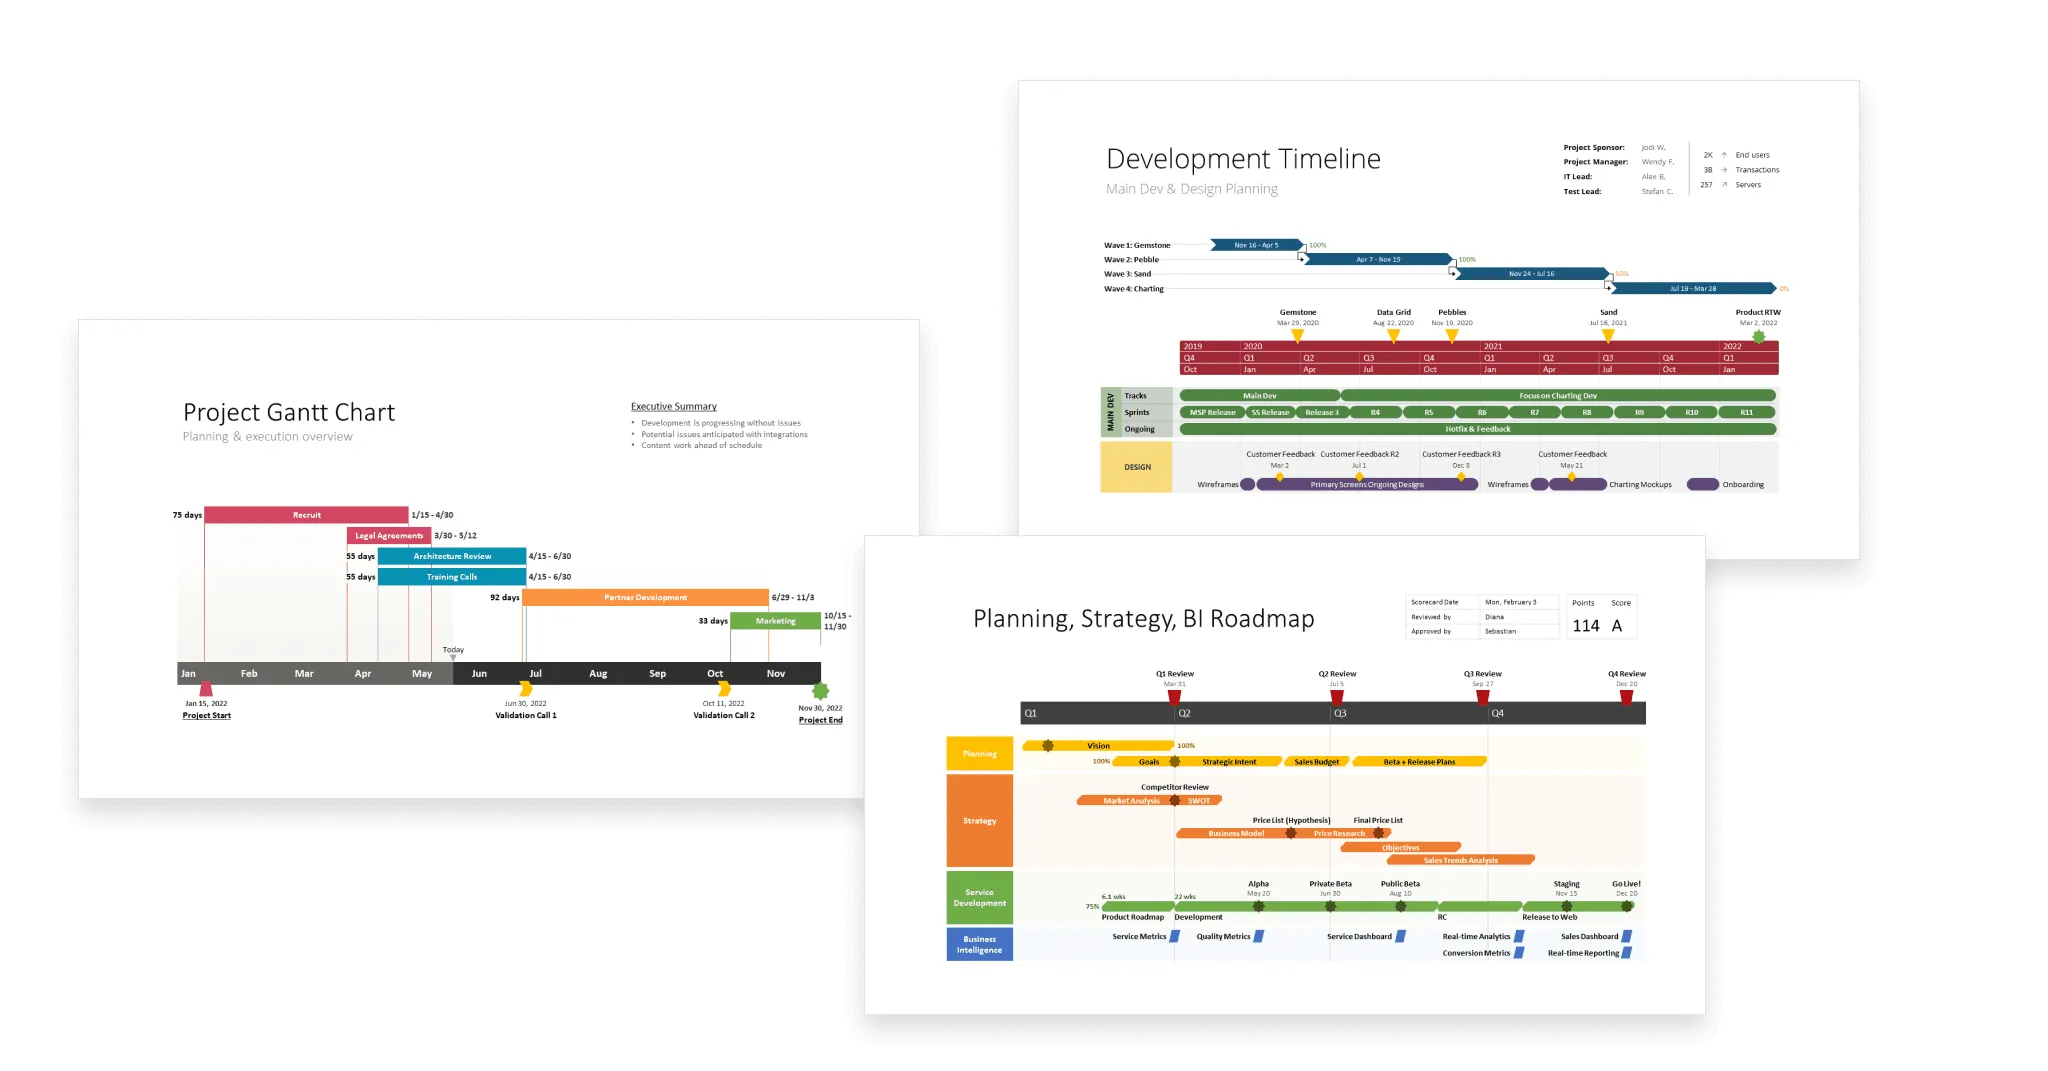
- Visual project scheduling – Map out deadlines and dependencies using multiple views such as timelines, Gantt charts, and other project visuals.
- File sharing – Import, organize, and export files in various formats so documents can be easily uploaded, stored, and distributed among team members.
- Communication and collaboration – Assign tasks, leave comments or @ mentions, share notes, and co-edit charts or documents in real time.
- Evaluation and reporting – Monitor productivity and progress with dashboards and reports highlighting completion rates, workloads, and upcoming deadlines.
- Automated workflows and templates – Standardize recurring processes with pre-built templates and customizable workflows to save time and reduce errors.
- Integration capabilities – Connect with other project management systems already used across your organization to streamline collaboration.
With these features in mind, narrow your options by asking:
- How many people will be using the software?
- Can you test it with a free trial for smaller teams?
- Does the platform address your specific pain points?
- Is the software scalable and able to evolve with your project needs?
- Is it intuitive to implement, with onboarding and training resources included?
These criteria will help you identify the best visual project management tool for your team. To simplify the process, check out our review of the top solutions available.
FAQs about visual project management tools
Find answers to the most common questions about visual project management software.
A visual project management tool is software, an app, or even a customizable template used to turn project data into clear graphics – such as timelines, Gantt charts, roadmaps, swimlane diagrams, or dashboards. These visuals make complex project details easier to track, present, and share.
Yes. Project planning is one of the main use cases for visual PM tools. By organizing data into charts like timelines, Gantt charts, roadmaps, Kanban boards, and portfolios, teams can:
- See what each member is working on.
- Track deliverables and deadlines.
- Highlight milestones and dependencies.
This makes planning interactive, transparent, and more collaborative.
Projects can be visually organized with tools such as:
- Timelines,
- Gantt charts,
- Kanban boards,
- Calendars,
- Roadmaps,
- Dashboards.
More advanced software also adds features for tracking, reporting, budgeting, and forecasting, making these project management visuals more than just static charts.
Project management can be organized with:
- Basic tools like templates or office software (e.g., Microsoft Excel).
- Specialized tools designed for visual project management.
While Excel and similar platforms can handle simple tasks, they often fall short for today’s complex, data-heavy projects. Specialized PM software offers advanced visualization (critical path, dependencies, Agile boards) and better scalability. Finding the right PM tool depends on your project’s size, complexity, and methodology.
Visuals simplify complex project data and make it actionable. They help professionals:
- Save time and improve efficiency.
- Provide a clear overview for data-driven decisions.
- Track progress and spot risks or delays.
- Encourage cross-team collaboration.
- Anticipate and mitigate project roadblocks in real time.
Project visualization is the practice of illustrating project data in a clear, easy-to-follow format. It brings transparency and clarity to workflows, helping teams and stakeholders consume information quickly and act on it. As the Project Management Institute notes, visualization delivers data “in a way that anyone can consume it at a time, place, and manner that is convenient to them.”