The do’s and don’ts of creating a great Gantt chart for your PowerPoint presentation
Learn how you can create outstanding Gantt charts in PowerPoint with the Office Timeline tool and make boring presentations a thing of the past.

Last updated on June 11, 2021
A customer recently said something that really stuck with me. He said that “teams and leadership are all bored to death of looking at complex Gantt charts and project schedules.” This was a senior Project Manager in a global aeronautics company. My sense was that he has probably worked on some pretty big projects and that he had seen his fair share of Gantt diagrams. His comment resonated because I have made this mistake in my career.
A beautifully designed and easy-to-understand Gantt chart is not only an essential element of high-level PowerPoint presentations but also one of the main joys in a project manager’s life—like short Zoom meetings and the first coffee of the day.
As a former project manager, I know how it feels to be rushing to get that Gantt chart you created from scratch finished before the meeting starts, only to realize that the end result is not as professional-looking and engaging as you hoped it would be (especially if you try to paste your complicated Excel chart into a PowerPoint slide).
More often than not, the charts I used to create in the past ended up making it difficult for my audience to follow project progress and had ‘guaranteed boredom’ spelled all over them. Plus, keeping those Gantt charts updated proved to be a true nightmare.
That’s when I realized that I needed a timeline maker that would seamlessly plug into PowerPoint, the most popular medium for business presentations, and allow me to easily design, update, share and keep track of all my Gantt charts and timelines.
In this article, I want to show you how you can create beautiful Gantt chart visuals for your project schedule in an intuitive way, directly in Microsoft PowerPoint.
7 tips and tricks for making a great Gantt chart in PowerPoint
First of all, if you want to know more about how to make Gantt charts in PowerPoint, you can check the helpful step-by-step tutorial that teaches you not only how to create one manually from scratch but also how to generate it automatically.
With that out of the way, we can now focus on these 7 key tips that will help you create the most compelling Gantt chart presentations whenever your clients and executives ask for them.
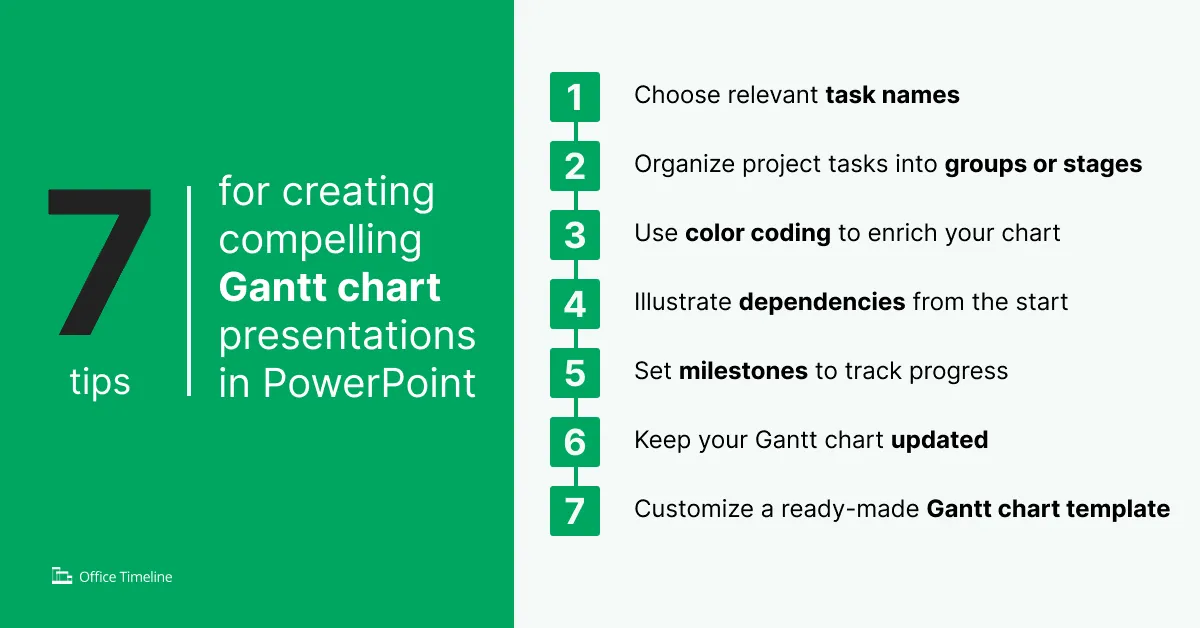
1. Choose relevant task names
Use descriptive task names when building your chart so that your audience can understand exactly what work each task involves. So instead of “Development Stage 1”, you could rather say “Brainstorming and planning.”
2. Organize project tasks into groups or stages
If you’re dealing with a more complex project, you should consider grouping your project tasks together. This will make your Gantt chart easier to scan and digest and efficiently communicate to your team and other stakeholders what activities are included in a deliverable or project stage.
3. Use color coding to enrich your chart
If there’s a way to keep complex project data interesting and easy to follow, that’s color coding. You can use various colors such as green, red, orange, and blue to illustrate completed tasks, in-progress work, and delays or highlight priorities and task dependencies.
4. Illustrate dependencies from the start
Project activities are interrelated, which means that preceding tasks directly influence the completion of succeeding ones. The most common type of dependency is finish-to-start, where the predecessor must be finished before the successor can begin. If you don’t show such a dependency in your Gantt chart, you risk having the whole flow of work interrupted, which often results in unwanted delays.
5. Set milestones to track progress
Adding milestones to your Gantt charts helps keep your team motivated and your project going as planned. Also, clients and executives find it easier to understand progress when they can see what milestones have been achieved and which ones follow next.
6. Keep your Gantt chart updated
Since change is a constant in project life cycles, it’s only normal that you should make sure that those changes get recorded into your Gantt chart. That’s why it’s important to choose the right tool that facilitates team collaboration when it comes to creating project visuals that reflect real-time progress.
7. Customize a ready-made Gantt chart template
As it happens with most management tools, there’s a learning curve involved that you have to go through in order to make impressive Gantt charts. However, you can flatten that curve and get the results you want while also saving time and effort by simply using pre-designed Gantt chart templates.
How to use Gantt charts the right way
As I look back the mistake was trying to use my project software or Visio for Gantt chart presentation work. It was difficult to paste their images into PowerPoint and really hard to finesse them so they looked ok. Despite best effort and lots of time trying to get these slides into a presentable state the result was never really that good. They had too much data squished onto each image and the aesthetics were awful.
This is what made it difficult for audiences to follow. I needed a Gantt chart maker that was native to PowerPoint so the slide could be manipulated, updated, edited and changed in PowerPoint as my project evolved.
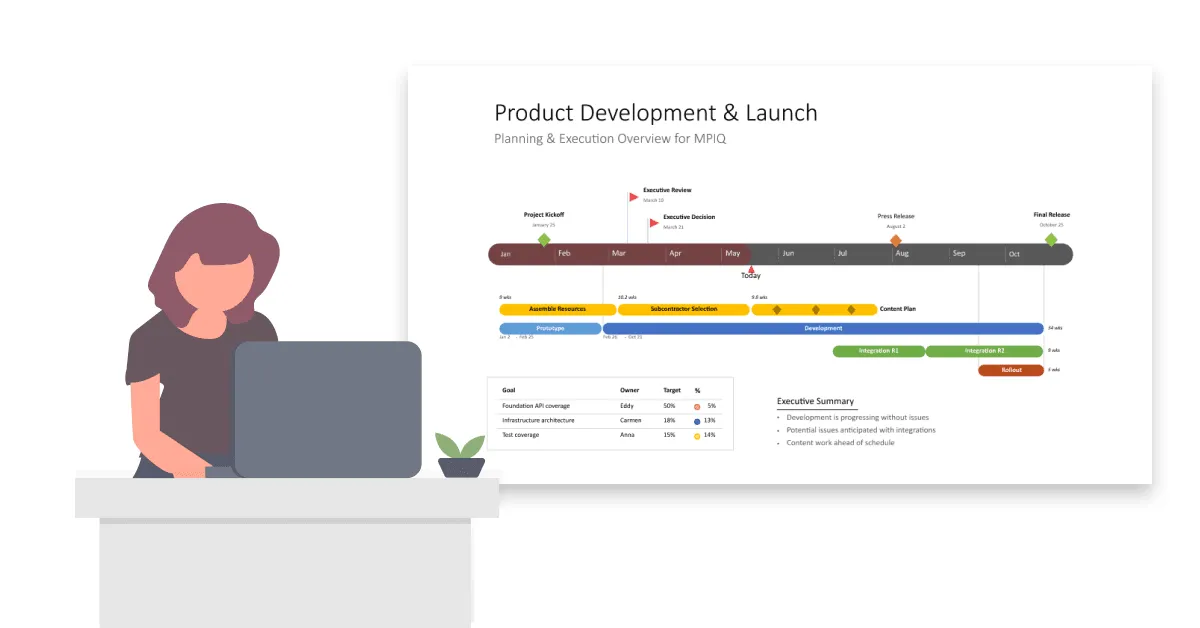
Now there is only so much you can fit on a PowerPoint slide, so I also needed to learn which parts of my project schedule were “presentation worthy,” and which parts could be left out of the presentation. Early on I thought presenting as much Gantt chart detail was the right thing to do.
But overtime I learned to summarize the key milestones and tasks, particularly for presentations to my leadership and to my clients. When I was able to condense project schedules it was easier to build more engaging slides. This made it much easier to communicate them and I felt like I could win the management and customer support I needed.
Get started with Gantt charts today
There’s no time to waste when you’re a project manager, especially when you have to make sure that there are no bottlenecks along the way and projects get delivered on time and on budget.
Office Timeline’s free PowerPoint Add-in allows you to create outstanding Gantt charts that your clients and executives will love in no time. Stay on top of things by communicating deadlines and tracking progress across projects with a user-friendly Gantt chart software that does all the hard work for you.
Download the free add-in for PowerPoint now and start creating stunning project visuals within minutes.
Tim is Co-Founder & CEO of Office Timeline, a Seattle-based start-up that aims to rid the world of boring, uninspiring meetings.
Tagged With:
Gantt chart 101Turn project data into professional timelines
Get the advanced features of Office Timeline free for 14 days.
