Swimlane Diagram Template
Without a doubt, timeline and Gantt chart makers can be incredibly powerful tools for any project manger whose primary job is to design the framework of a project, from scheduling activities to task assignment and resource management. If you’re looking to maximize productivity and handle those tricky stakeholder meetings like a pro, these visual representations of the Work Breakdown Structure (WBS) are your ace in the hole. Using Office Timeline, you can even create a Gantt chart or timeline in PowerPoint in under 2 minutes, as shown in this how-to video.
But what do you do when you have so many concurrent tasks and milestones overlapping that your project roadmap becomes unreadable?
You have two options: splitting the timeline into multiple slides or using a swimlane diagram template. To find out more about the first option, you can check out our support article for Excel, while those who prefer Microsoft Project can visit our support article for MS Project instead.
Let’s explore the swimlane option.
What are swimlane diagrams?
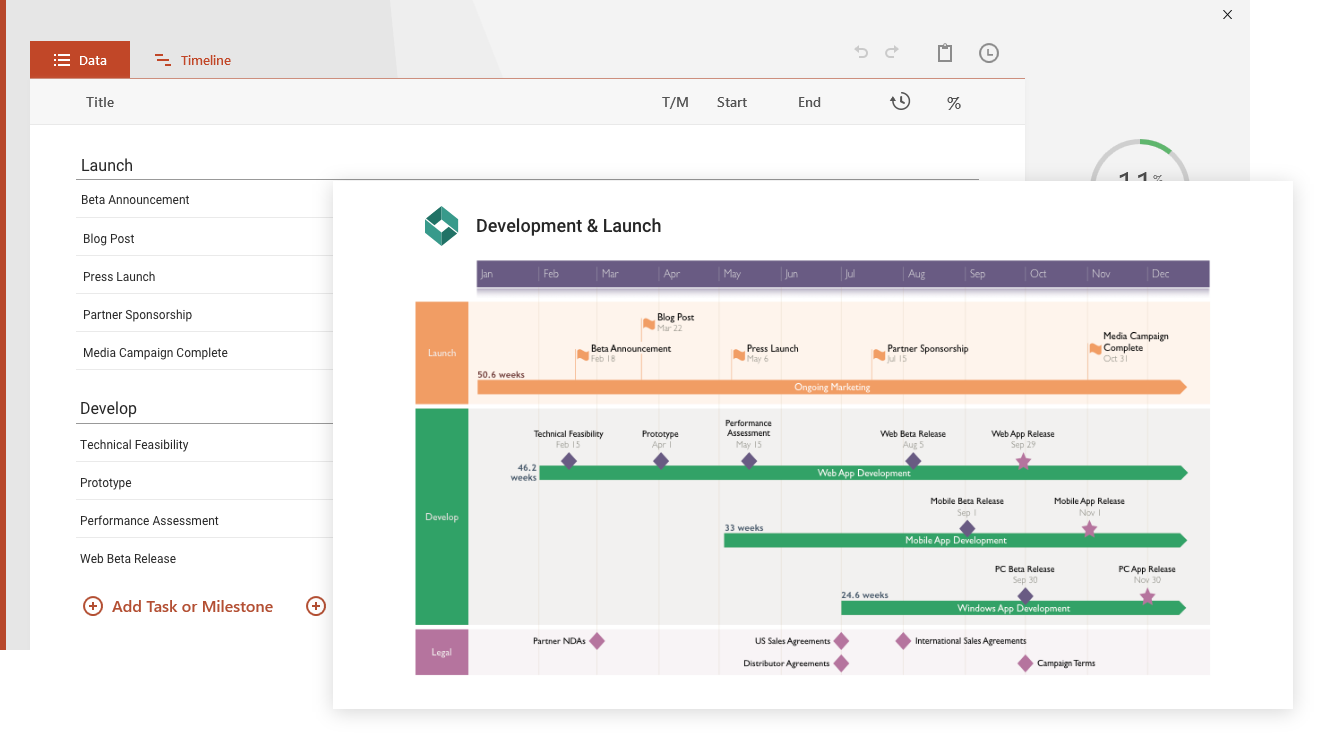
Swimlane diagrams bring an extra layer of order to your project roadmaps by grouping certain milestones, tasks or processes into “swimlanes” (also written as “swim lanes”) according to their category - it can be departments, employees, steps, or procedures. For instance, in our swimlane diagram example, the lanes are used to showcase the synchronized phases of a product roadmap, each with its specific tasks and milestones.
The beauty of swimlane diagrams comes from their flexibility, since their application and scope are up to you. Generally, swimlane diagrams are found in the context of:
To learn more about swimlanes and the best project management software apps that employ them, check out our blog post “Top 10 Swimlane Software for Project Management”.
Swimlanes in PowerPoint
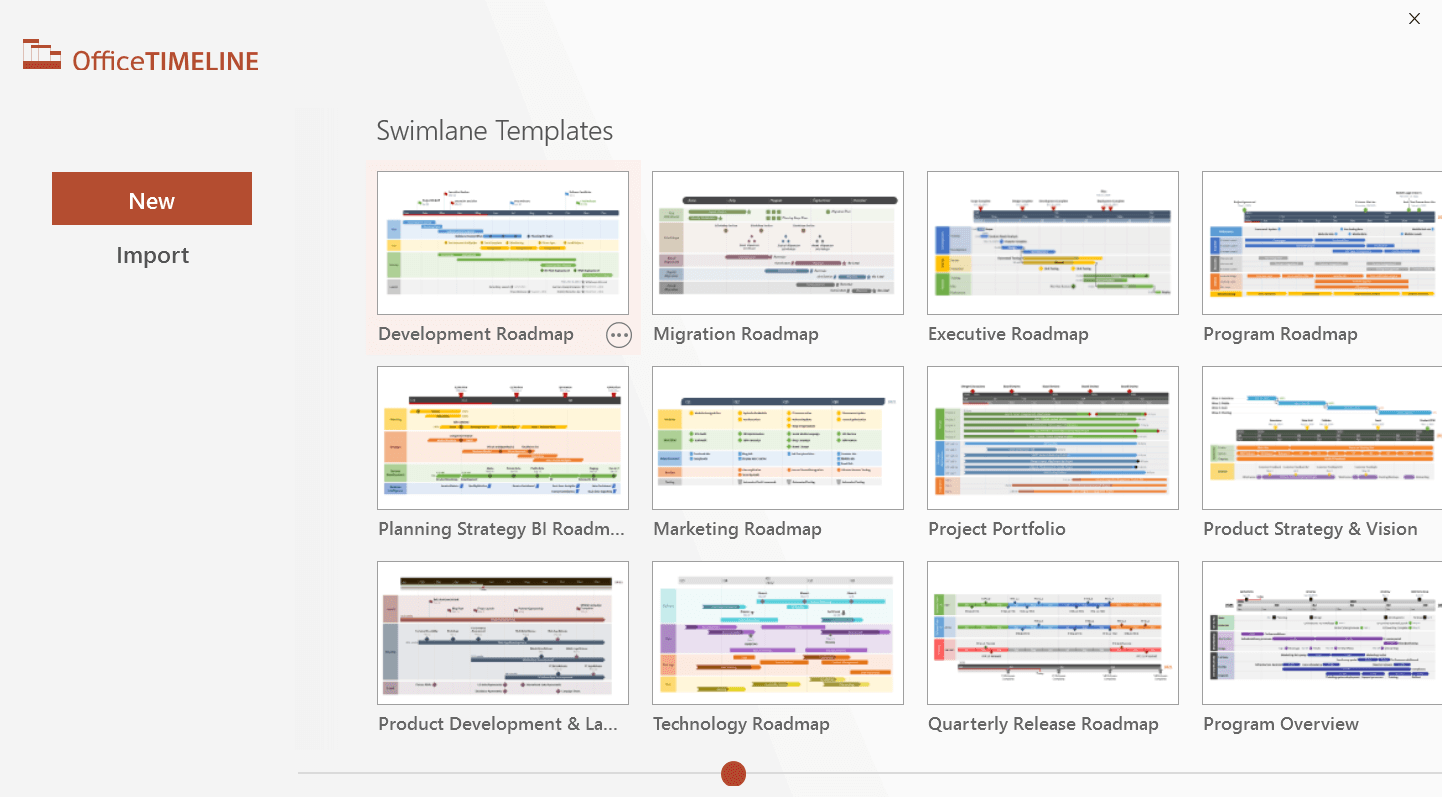
We’ve created this swimlane PowerPoint template that you can use to showcase your project roadmap to clients and stakeholders using Office Timeline’s most advanced version, which integrates unlimited swimlanes.. Editing can be done manually via PowerPoint or automatically, using our plug-in.
You can customize it functionally - to fit your specific project data - but also visually, in terms of colors, shapes and positioning. At the same time, you can leverage all PowerPoint's native features to add your company branding, your client's logo or a legend detailing your color codes. Bring that wow! factor to your PowerPoint presentations every time without spending hours on the design of your slides.
Swimlane diagrams – just the tip of the iceberg
Besides being one of the very few timeline and Gantt chart makers to feature swimlane diagrams, Office Timeline brings a wide variety of convenient options that compliment them. Use our add-in to easily:
For a full, no-holds-barred experience in designing presentations that will make your next strategy meeting a smashing success, try out Office Timeline’s free 14-day trial.
Frequently asked questions about swimlane diagrams
Explore the most frequently asked questions about swimlane diagrams and find out the answers.
How do you create a swimlane diagram?
A swimlane diagram, also known as a cross-functional flowchart, is a visual tool that shows the steps and interactions involved in a process or workflow. You can create a swimlane diagram by following these steps:
-
Define the process you want to document. This could be a business process or any other workflow you want to map out.
-
Identify the participants, the people or departments involved in the process. They will be shown with the help of the swimlanes in the diagram.
-
Create swimlanes - horizontal or vertical axes for each participant, which will serve as the divisions for the diagram. Assign each participant to a specific lane.
-
Chart process steps. Map out each step in the process using symbols and shapes.
-
Show interactions, i.e. how each participant interacts with the process, by drawing arrows between the steps in the swimlanes. These arrows will show the process flow from one swimlane to another.
-
Add details, any additional information that are relevant to the process (e.g., decision points, conditions etc).
Now you’re ready to use your swimlane diagram to map out project processes in order to help streamline your workflow.
What are the main elements of a swim lane diagram?
The four main elements of a swim lane diagram are:
-
Swimlanes. These are columns or rows that separate different process participants or functional areas. Each swimlane represents a specific role or department within a process.
-
Activities. These are the individual tasks or steps that make up the process. Activities are represented as boxes within the swimlanes, and the order of the activities indicates the flow of the process.
-
Arrows. These are the lines that connect the activities and show the direction and flow of the process. Arrows can be straight or curved and indicate the sequence of the activities within the swimlanes.
-
Decision points. These are diamond-shaped symbols that indicate where decisions need to be made in the process. Each decision point may involve a choice between two or more options, and the flow of the process will depend on the choice made.
-
Start and end points. The start and end points of the process are shown with a circle or oval shape.
What is the difference between flowcharts and swimlane diagrams?
The most important difference between flowcharts and swimlane diagrams is the separation in lanes. More precisely, swimlane diagrams include swimlanes that separate different process participants or functional areas. Meanwhile, flowcharts do not necessarily have swimlanes and do not explicitly separate roles or departments.
Swimlane diagrams are useful for documenting processes that involve multiple departments or participants, as they show how different departments/participants in the process interact with each other. The use of swimlanes helps to define and clarify different roles and responsibilities and make it easier to understand and present a process.
Flowcharts, on the other hand, are generally used to document a single process and usually do not show the interactions between different participants.
What is a cross-functional flowchart?
A cross-functional flowchart is a type of process flowchart that shows the relationships between participants in a process (for example, different teams or departments in an organization). Also known as a swimlane diagram, a cross-functional flowchart uses swimlanes to represent different departments or participants involved in the process and shows how they interact with each other.
Does PowerPoint have a swimlane template?
No, you cannot find pre-built swimlane templates in PowerPoint. There are only a few flowchart templates, but they do not include swimlanes, and are not visually appealing.
You can still get a variety of PowerPoint swimlane templates with the add-in from Office Timeline, which you can try for free.
Alternatively, you can create your own swimlane diagram from scratch in PowerPoint using shapes, lines, and text boxes. Thus, you can tailor it to your specific needs and design preferences, and you have the freedom to include as many or as few lanes as necessary for your diagram. The process is simple: use shapes and lines to create the swimlanes, and then add steps and other elements to the diagram, as explained in our tutorial on how to make a swimlane diagram in PowerPoint.
How do you create a swimlane timeline in PowerPoint?
A swimlane timeline is a visual representation of a timeline in which tasks or activities are placed in separate lanes or rows. It is used to represent the progression of a process over time. Each lane represents a specific person, group, or department responsible for completing the tasks, and the timeline shows the duration of the process. To create a swimlane timeline in PowerPoint, you can follow these steps:
-
In a new slide in PowerPoint, click on the Insert tab in the ribbon and select SmartArt.
-
In the Choose a SmartArt Graphic dialog box, select the Process category, and then choose a graphic that suits your needs. You can select Basic Timeline, or one of the simple “process” graphs, depending on your needs. This will be the first swimlane of your timeline. To make multiple swimlanes, just repeat the process or copy-paste the first swimlane.
-
Add text to the swimlanes by clicking on each box and typing in your text.
-
To add additional boxes, click on the Add Shape button on the SmartArt Design tab, in the Create Graphic section on the left.
-
To customize your swimlane timeline, you can change the colors, styles, and fonts by selecting the Format tab and using the various options available there.
For a fast, automated solution, with great-looking results and multiple template options, you can try for free the powerful add-in from Office Timeline. Use it to automatically generate swimlane timelines, then use the “dependencies” feature to indicate how tasks depend on each other.
How do I create Swimlanes in PowerPoint?
This is how you can create swimlanes in PowerPoint:
-
Open a new PowerPoint presentation or the existing one where you want to add Swimlanes.
-
Click on the Insert tab in the PowerPoint ribbon, then click on the SmartArt button in the Illustrations group.
-
In the Choose a SmartArt Graphic dialog box, select the Process category from the left sidebar. Here, you can choose from multiple graphic options that represent processes, which you can use as swimlanes. For multi swimlane graphs, you can either select one of list models, such as Chevron List or Vertical Chevron List, that can be used as a swimlane diagram or select a simple process, such as the Basic Chevron Process, and then multiply it on the same slide by either copy-pasting it or repeating the steps Insert > SmartArt > Process > Basic Chevron Process.
-
To insert your data for each lane in the Text Pane, click on the placeholders and type the text.
-
Customize the swimlane diagram by changing the colors, layout, and other design elements as per your requirements.
That's it! You have successfully created swimlanes in PowerPoint.
You can find more detailed instructions with images in our tutorial on how to make a swimlane diagram in PowerPoint.
How do you create a swimlane diagram or cross-functional flowchart in Excel?
To create a swimlane diagram (also known as cross-functional flowchart) in Excel, you can follow these steps:
-
In a new workbook in Excel, first create a two-column table: one column for the owners of the activities you want to map out, and one column for the process steps. These are the swimlanes of your diagram.
-
Then, to illustrate the process steps assigned to each activity owner, click on the Insert tab in the ribbon menu at the top of the screen, then click on the Shapes dropdown menu and select the Flowchart category.
-
To select and insert shapes based on their roles, hover over each option in this category to see what each represents. Click and drag to draw your swimlane diagram.
-
To connect the swimlane shapes, go to Lines in the Shapes dropdown menu (Insert > Shapes > Lines), then select the arrow shape. Click and drag from the starting point of one swimlane shape to the ending point of another to create a connecting line. Repeat to connect more boxes.
-
Add text labels to each swimlane shape to describe the activity and format the shapes as desired using the formatting options in the ribbon menu.
For more detailed information, check out our tutorial on how to make a swimlane diagram in Excel.
How do I make a swimlane diagram in Word?
To make a swimlane diagram in Word, you can use the built-in shapes and drawing tools to create the diagram. Here are the steps to follow:
-
To create the swimlanes, open Word and create a new document, then click on the Insert tab in the ribbon menu at the top of the screen, then and add two rectangles next to each other: the first one small, for title section of your swimlane, the second large, to represent the main part of your swimlane.
-
To create the tasks and decision points, click again on Insert, then click on the Shapes dropdown menu and select the Flowchart category. Here, you can select shapes based on their roles. To do this, hover over each option in this category to see the description.
-
To connect the swimlane shapes, go to Lines in the Shapes dropdown menu, select the arrow line, then click and drag the cursor as needed to create a connecting line. Repeat to create additional connections as needed.
-
Add text labels to describe each task/activity and format the shapes and lines as desired using the formatting options in the ribbon menu.
Find more detailed info along with illustrations in our tutorial on how to make a swimlane diagram in Microsoft Word.