Mastering Gap Analysis in Project Management for optimal results
Discover expert insights, step-by-step strategies, and downloadable resources for an effective gap analysis.

Gap analysis can revolutionize your project management approach. In this article, you’ll find out why, how, and what it takes to implement it efficiently.
Are you looking for a new way to optimize the resource allocation within your business? Have you been assigned the task of growing your team’s performance but you’re unsure where to start? Is your company’s new line of products not generating the expected ROI?
What these three scenarios have in common is ‘the gap’. More specifically, there is a noticeable discrepancy between the current state of affairs and the ideal, or desired, situation. But how can you determine the best course of action and what steps to take across the proverbial chasm linking where you are and where you could – and should – be?
We have created the project manager’s guide to gap analysis with the aim of answering this question and others you may have about the topic. First things first, before you can figure out how to address the underpinning issues, you need to know what is causing them.
This is where the gap analysis comes in. Let’s do a deep dive and discover how implementing gap analysis in project management can radically improve the outlook of your business.
1. Understanding gap analysis
The first step in using gap analysis correctly is having a good understanding of the concept. So let’s find out more.
1.1. What is gap analysis?
The strategic process of evaluating the present state of business performance against the desired levels of efficiency is referred to as gap analysis. The gap analysis can be applied to a wide range of business areas, including:
- Sales and profit margins;
- The management of human resources;
- Productivity and cost control;
- QA and energy efficiency;
- Employee satisfaction and performance;
- Marketing strategy effectiveness.
Comparing the future state with the current one is done by looking at factors such as resource allocation, capital infusions, technology utilized, etc. More specifically, project managers will use the identified disparity in the allocation and integration of company assets in order to create new strategies for moving things forward.
Naturally, this approach relies heavily on documenting current processes and measuring outcomes. The real-time data extracted in the gap analysis is compared to either a desired future state or the competitors’ performance. In turn, this allows a much better understanding of where you are versus where you could be on the efficiency scale.
The importance of gap analysis in projects stems from its invaluable insight into aspects like:
- What the clients really want versus the management’s perspective of the matter;
- Management’s expectation of product/service quality versus the actual quality specs;
- The services being delivered versus what is being communicated to the customer;
- Perceived product features versus expected product features.
1.2. Why is gap analysis important for project managers?
Now that we have a basic grasp of what a gap analysis is, let’s consider the benefits of including this tool in your project management activities.
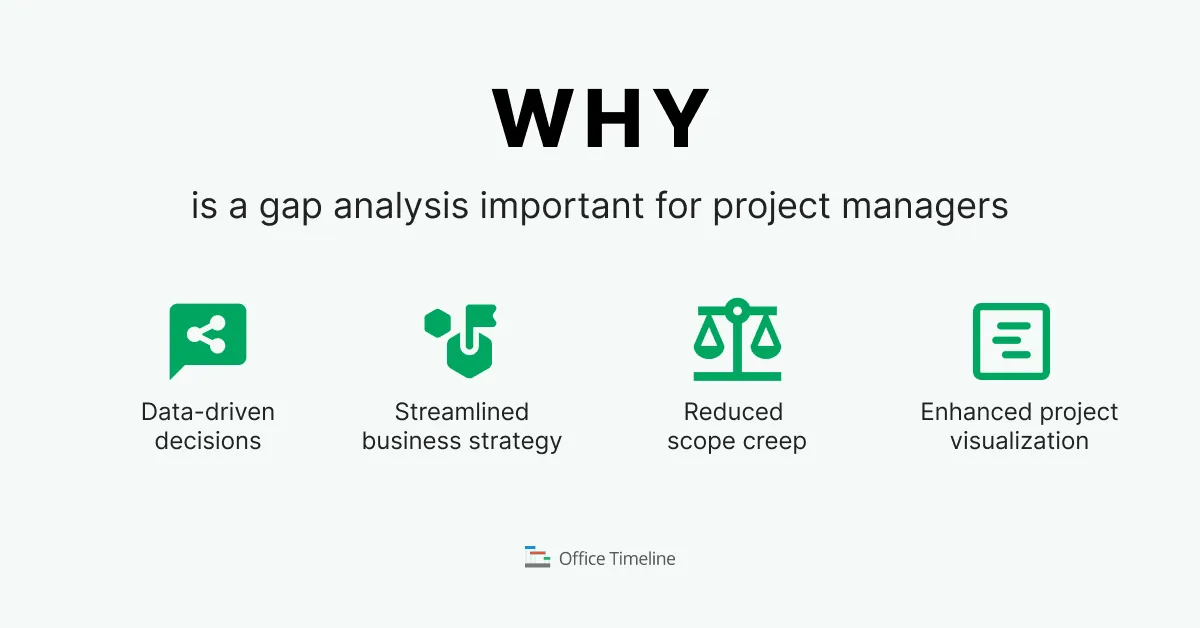
Better control of project data
Successful project managers (PMs) understand the critical importance of data-driven decisions. After all, how can you be expected to create an action plan that will increase performance before you know:
- What the current baseline is;
- Where your company is falling behind;
- What progress looks like.
It would be the equivalent of trying to land an aircraft before you know where the runway is and how much fuel there’s left in the tank: you might get extremely lucky, but the odds are definitely not in your favor.
Let’s briefly consider the standard job description of a project manager. Broadly speaking, their tasks are to identify the objectives and scope of a project, create a work breakdown schedule, set timelines and allocate resources.
However, more importantly, project managers are responsible for:
- Managing risks;
- Monitoring progress;
- Ensuring that the work is on track.
Briefly put, the PM is responsible for controlling virtually all aspects of the project using the data at their discretion. This is where the gap analysis shines as a project management tool, by:
- Spotting shortcomings, their nature and their point of origin;
- Optimizing or eliminating ineffective processes to gain access to additional resources;
- Providing a high-level overview of the project to determine whether sufficient capital to complete it exists.
Streamlined business strategy
Another key aspect of project management consists of ensuring there is alignment between the current goals of your undertaking and the overarching organizational objectives. A gap analysis can uncover goal inconsistencies and help synchronize the two sides for a more streamlined business strategy.
For instance, if the top management is planning to cut down production costs and your project aims to revitalize the outdated technology in the manufacturing department, a clash is inevitable; unless, of course, you can find a sweet spot between the two.
In this particular scenario, a gap analysis might identify ways to cut down expenses related to raw material procurement and allow diverting capital towards the acquisition of newer machinery.
Reduced scope creep
At the same time, it’s worth bearing in mind that numerous projects fail due to scope creep. As the complexity of an undertaking grows, various unplanned and often unnecessary tasks end up draining resources and put a strain on the original budget.
What follows are delays to the original timeline, overlapping efforts and inefficient investments of capital that reflect negatively on the company’s performance.
However, a comprehensive and regularly conducted gap analysis allows PMs to use real time data and limit or eliminate scope creep before it becomes such an insurmountable problem that stakeholders decide to pull the plug.
Enhanced project visualization
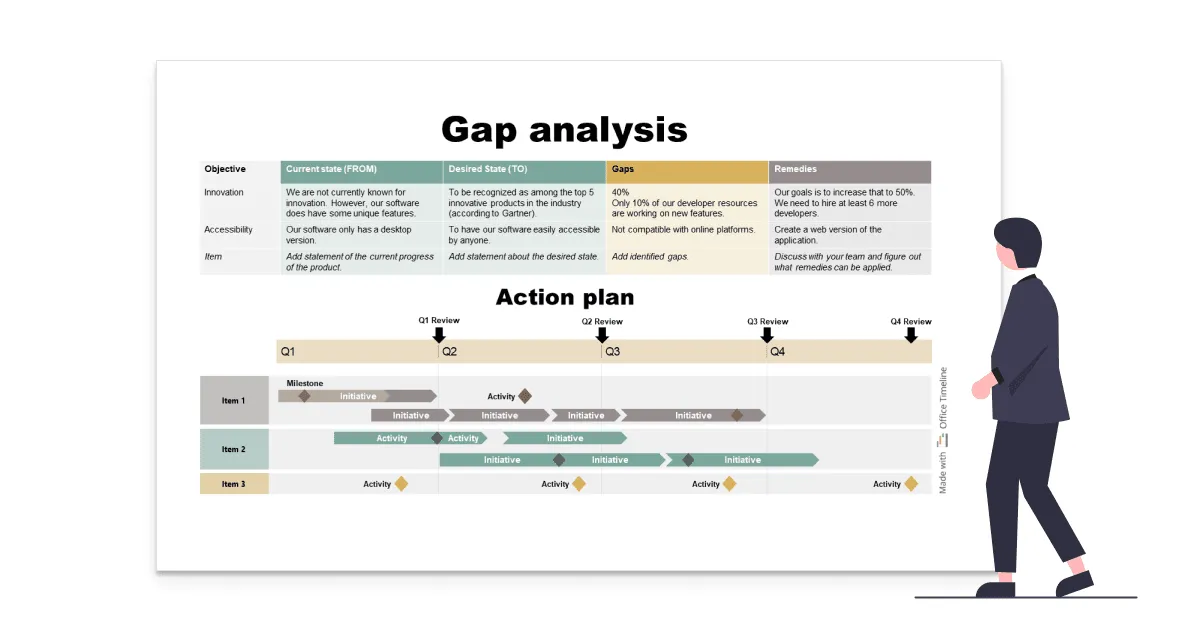
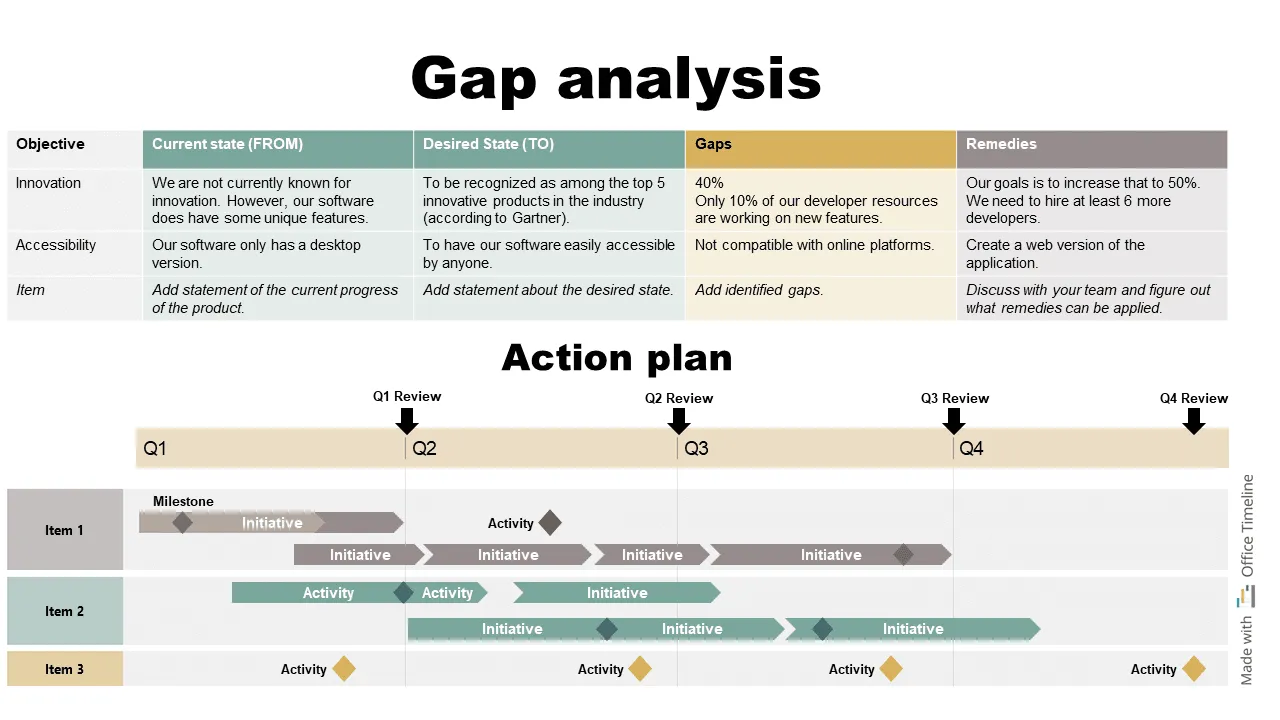
On a side note, timelines and Gantt charts are excellent tools for effective gap analysis because of their linear progression. To be more precise, the gap analysis measures the difference between two states (current and desired). The arrow of time proprietary to the aforementioned project management visuals allows you to draw a path from where you are now to where you would like to be in 6 months or 1 year. Check out our section on gap analysis template to learn more.
2. Key steps in performing gap analysis
Next, let’s have a look at the major steps involved in performing a gap analysis.
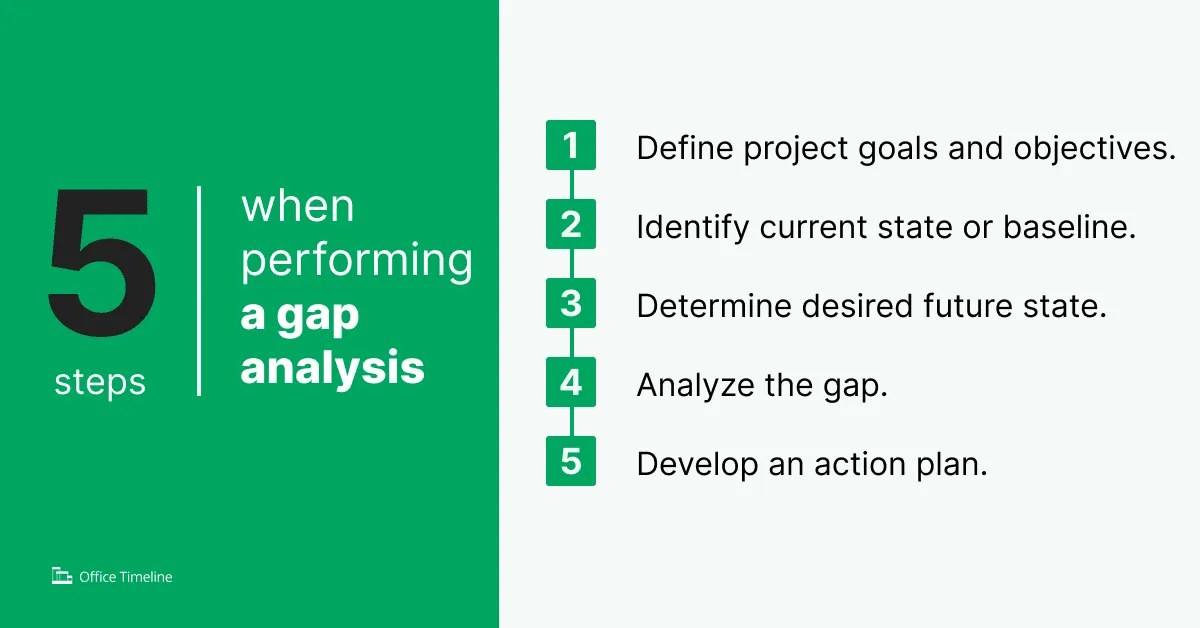
2.1. Define project goals and objectives
The layout of any project must include a clearly and comprehensively defined set of goals and objectives, that is, the why behind the project. It goes without saying that you won’t have much success presenting your initiative to your stakeholders unless you can sell it, and you can’t sell it without a clear picture of what you intend to achieve.
Another major reason to map out the objectives from the get-go is to avoid the above-mentioned scope creep; figuring out exactly what the goals are will enable you to distinguish between necessary and superfluous processes. Finally, having clear project objectives translates to better communication between the participants and teams involved, as well as the alignment of efforts towards the same endgame.
When you’re starting to define the goals, here are a few aspects to consider:
- Conducting a feasibility study
Your present resources and capabilities constitute an important variable for determining whether or not a project can be completed. The feasibility study can help contrast the measurable goals you set against the available capital (financial or otherwise) and allow you to evaluate the chances of success.
- Determining existing constraints
Every project will present you with a unique set of opportunities, but also challenges that need to be overcome. Be mindful of them when you determine the objectives, as these need to be achievable and realistic. Prioritizing deliverables and setting milestones (another great reason to use timelines and Gantt charts) is useful in tracking progress and identifying where the bottlenecks are.
- Defining success
Knowing the right key performance indicators (KPIs) to track is another major aspect in project management. These variables, which should be directly linked to the objectives you’ve identified, are a measure of how far you are from achieving the desired results.
SMART goals, for instance, are one of the frameworks that has proven its mettle time and time again. You can read our comprehensive guide to SMART goals, but let’s quickly review what the acronym stands for:
- Specific – defines what needs to be accomplished and what must be done towards this end;
- Measurable – relies on clearly defined metrics to evaluate progress;
- Achievable – ensures the availability of necessary resources and potential constraints;
- Relevant – checks if the overarching business strategy is in sync with the current project goal;
- Time-bound – specifies a fixed timeframe for achieving the objective.
While it’s not the only such framework in existence or applicable in every imaginable context, SMART goals have become an integral part of the project manager’s handbook. We will now move onto the more hands-on part of our guide to discuss a few ways to put this theoretical knowledge into practice, such as the steps for conducting a gap analysis.
2.2. Identify current state or baseline
At first glance, this task could appear overwhelming, but the good news is that it does not have to be. If you already have a balanced scorecard, then you should be able to extract the pertinent information from there, as this organizational management framework is all about communicating what a company has set out to achieve and how it plans to achieve it.
You can read more about the various types of balanced scorecards and download free scorecard templates to get you started. Other types of strategic plans can work equally well, as long as they contain the key performance indicators (KPIs) relevant to your project.
Let’s look at an example. We will assume that you are planning to increase the number of new customers on a year-to-year basis to 30%. Checking the records for previous years, you find that year-to-year growth of new business is at 8% on average, across the last 5 years. In this scenario, 8% represents the current state, 30% represents the desired future state and the missing 22% is the gap.
It’s important to note that the current state determined must be relevant to the goal. In the above scenario, knowing how much each customer spends on your products on average would not be very helpful, as that’s not a KPI relevant to the number of customers.
On the other hand, KPIs such as the number of abandoned shopping carts, brand satisfaction, the number of marketing campaigns conducted, etc. all have an indirect impact on your objective.
The bottom line is to correctly identify the current state in accordance with the goals you’re aiming for. Like reading a map, it’s necessary to learn your position before you can plot a course.
2.3. Determine desired future state
Sticking with the map analogy, figuring out where you are is just as significant to your journey as the destination. What’s important here is to have a reasonable timeframe for taking your project from the current state, which we’ve identified earlier, to the desired future state.
To better evaluate the duration for reaching your target, it helps to break down the work into more easily manageable phases, marked by milestones. Timeline templates are excellent tools for this task, thanks to their highly visual nature.
Knowing both the current and the desired states allows you to measure the discrepancy between the two, or more specifically, the gap. But what can we do with this information?
2.4. Analyze the gap
The next order of business is figuring out what is causing the uncovered gap in the first place. Why? Because every problem harbors the seed of its own resolution. Another way to put it is that you can track the issues causing the discrepancy between the present and desired state back to their point of origin simply by looking at the data and asking the right questions.
For instance, let’s assume that you run a small family restaurant and only about 50% of the tables are booked during weekends. Running the numbers, you calculate that you’d need at least 80% of the tables to be booked during weekends to turn a reasonable profit, so there is a 30% gap.
You can use a framework such as the “5 Whys” to ask relevant questions:
- Why aren’t more customers booking tables on the weekend? Because we only offer reservations via the phone.
- Why are we only offering reservations via the phone? Because our website design is outdated and does not include a reservation form.
- Why aren’t we updating the website design to include a reservation form? Because we haven’t invested in our online presence over the last three years.
- Why haven’t we invested in our last presence over the last three years? Because the restaurant is not turning enough profit.
- Why isn’t the restaurant turning enough profit? Because there are not enough customers booking tables.
While this clearly is a simplified version of the 5 Whys framework, it should give you an idea about the kind of questions you could ask yourself to identify the source of the gap.
In practice, a gap analysis is very unlike to unearth a single, major problem that, once addressed, will automatically take you to the desired state. More often than not, it will be a slew of tiny issues that become the proverbial monkey wrench in your works when taken together.
Once you have identified them, you can evaluate how they are connected and their impact on your success, and begin to prioritize accordingly.
2.5. Develop an action plan
Determining the nature and extent of gaps between the current and desired state, as well as the factors causing them, are only preliminary steps. By leveraging this information, you can now concoct strategies to narrow or close the gap.
Here are a couple of strategies that project managers can apply to this end:
- Plan, communicate and deliver: start out by creating a plan of action, set a timeframe for its completion, create a timeline that features all the tasks for the execution teams, and make sure all the information has been transmitted to everyone involved.
- Take responsibility: once you’ve settled on an action plan, keep in mind that you will be required to oversee the progress and come up with ways to overcome challenges that arise throughout the implementation.
- Assign resources and manpower: part of the PM’s job is to ensure that the teams have the resources necessary for completing their task, but also that the jobs are assigned to individuals with the right skillsets.
- Favor robust and simple strategies: it’s better to avoid complicating the action plan for marginal benefits, and to adopt a proactive approach instead of attempting to foresee every single scenario from the get-go.
- Recognition goes a long way: exceptional performance, teamwork and a results-driven mindset are the kind of qualities that should be celebrated and rewarded, as they play a major role in keeping your teams motivated.
In short, the optimal plan for bridging the gap implies that everyone knows what they are supposed to do, how to do it and how much time they have available. These are the hallmarks that recommend timelines and Gantt charts as the best graphics for planning and monitoring the work. Tasks can be used to break down the workload into manageable chunks, milestones mark the various phases of the project and, optionally, you can add swimlanes and sub-swimlanes to clarify which team is handling what.
3. Tools and techniques for gap analysis
In addition to timelines and Gantt charts, there are a number of other excellent tools for effective gap analysis you can use to better evaluate your current circumstances and identify ways to reach the desired state, and we will discuss them here. Each of them can provide its own unique insight.
For instance, while the SWOT analysis focuses on assessing the project’s inherent strengths and weaknesses, PESTLE looks at the external factors and the Fishbone diagram makes it easier to visually identify performance issues. Let’s take a closer look.
3.1. SWOT Analysis
The acronym SWOT stands for:
- Strengths – areas where your company is already performing exceptionally, or at the very least well enough to have a competitive edge in its niche;
- Weaknesses – areas for improvement, where the optimization of processes is necessary to avoid stagnation or faltering;
- Opportunities – circumstances external to the organization that can be harnessed to achieve development and growth;
- Threats – circumstances external to the organization that can interfere, and pose challenges to your projects.
In short, the SWOT analysis aims to offer project managers a more structured way of identifying internal and external factors that can influence the outcome of an initiative. Ideally, it should help PMs leverage the company’s strengths and opportunities, while at the same time minimizing the impact of weaknesses and threats.
SWOT is a flexible and robust framework, able to adapt to a wide array of scenarios you can expect in the business world.
You can break down a SWOT analysis into 6 steps, as follows:
- Internal audit
The first step is generally conducting a review of the company’s resources and overall performance. Many aspects can fall under this category, including expenditures, employee performance, protocols, etc. It’s advisable to focus on the ones directly affecting your current initiative, as there is the risk of becoming overwhelmed.
- External analysis
Next off, your organization must look at external factors with a potential impact on performance. These include the socio-economic climate, industry trends, competition, geopolitics, etc. Data can come from industry reports and good old market research, and can help spot golden opportunities or hidden risks.
- SWOT matrix
Once you’ve noted down both the internal and external variables, you can build a SWOT matrix to visually depict the interactions between them, for a clearer understanding. This graphic is composed of 4 adjacent squares listing strengths, weaknesses, opportunities and threats. You can check out various types of SWOT matrixes in our detailed guide.
- Strategy development
Based on the SWOT matrix, start setting some objectives that will represent the foundation of your organization’s future strategy. Use broad strokes and try to leverage opportunities while minimizing the impact of threats when you’re setting the direction.
- Action plan
From the objectives identified earlier in the strategy development phase, pick out the ones that are the most feasible. You can now begin to set specific action points that will lead you towards the desired state and create an action plan. Using visuals like timelines allows you to monitor how the project is progressing on a linear timescale, so you can make adjustments when things don’t go according to plan.
- Presenting results
Your stakeholders will naturally want to know whether the strategy is proving fruitful, and the best way to showcase your work is, you’ve guessed it, also with the aid of visuals. Timelines and Gantt charts are excellent ways to present the tasks handled so far and the remaining ones, while graph bars or pie charts are better at conveying the effectiveness of the plan on measured KPIs. Bonus tip, consider your company’s branding and style when you design the slides, for a more personal touch.
3.2. PESTLE Analysis
Unlike SWOT, the PESTLE analysis focuses exclusively on the external circumstances, to paint a detailed picture of the general context. Here’s what the PESTLE acronym stands for:
- Political – government control and regulations of businesses, taxes, fiscal policies, tariffs, trade disputes, antitrust and anti-competition issues (example: companies resolving to relocate their facilities to another country due to increasing taxation);
- Economic – interest rates, inflation, currency exchange rates, employment (example: the impact of exchange rates on corporations operating in multiple countries);
- Social – demographics, lifestyle trends, consumer attitudes, working conditions (example: the impact of the pandemic on the employees’ preference to work from home);
- Technological – availability of automation, R&D costs and benefits, infrastructure capabilities, cyber security (example: the implications of transferring company data from physical, dedicated servers to cloud-based solutions);
- Legal – regulations within the industry, employee and consumer protection laws, permits and licenses, IP protection (example: the risks of developing an IP in a country where the legal infrastructure covering IP theft is lacking);
- Environmental – carbon footprint, extreme weather conditions, availability for use of natural resources, climate change impact (example: publicly trading firms being required to update their recordkeeping to account for greenhouse gas emissions).
Depending on the nature of the project and the industry, certain factors in the PESTLE analysis may weigh more than others. For instance, the technological, legal and environmental sides of things would be more impactful for a pharmaceutics company than, say, the social factors.
Nonetheless, when taken as a whole, they paint a clear picture of the potential impact of risks and opportunities.
Analysts can utilize these variables quantitatively in their financial models and risk assessment tools, making the PESTLE a valuable part in any gap analysis.
Examples here could include the need to adjust projected revenue growth to account for the expected inflation rates or updating the financial model in accordance with the impact of increasing automation on labor costs.
3.3. Fishbone Diagram
Gap analysis is, at its core, a method of identifying the reasons why an organization is not achieving its full potential. In other words, one of its aims is to figure out what the underlying problems are.
The fishbone diagram (also referred to as herringbone diagrams, cause-and-effect diagrams or Ishikawa diagrams) is often used in tandem with our framework; it’s a visual tool to help identify the potential causes for the occurrence of an event, outcome or issue.
Here is how you can get started with this framework:
- Determine what the problem is: Your problem will constitute the head of the fish; you can also use this section to create a brief description of the problem or to add details that may be helpful in solving it.
- Selecting the appropriate cause categories: On the uppermost and lowermost parts of the diagram, you can start with the types of cause categories that are likely to have an impact on your problem. There are multiple templates of fishbone diagrams (simple, 4S, 8P, or Man, Machine materials, for instance) to help you get the ball rolling if you get stuck.
- Brainstorming specific causes: Using the category guidelines, you can come up with various sources for your issue, and add these in appropriate section inside, forming the “skeleton” of the fish.
- Digging deeper: As you come up with specific causes during your brainstorming session, you might find that you need to add new categories and create further branches on the fishbone.
- Finding consensus: With all the input added to the diagram, it’s time to discover what the major underlying causes – there could be multiple – for the problem are.
- Identifying solutions: Finally, with the principal causes found, you can start working on solutions that alleviate or eliminate them, thus addressing the problem and preventing reoccurrence.
It’s worth noting that fishbone diagrams are considered part of the tools for effective gap analysis also because they tend to reveal weaknesses in processes during the brainstorming sessions. As employees with different perspectives chip in, their input often identifies bottlenecks that were previously unknown to the management. The simple graphic format is also a bonus, since most people are visual learners and problem-solvers.
4. Downloadable PowerPoint template for gap analysis
To help you with developing an action plan once you’ve complete the gap analysis, we have created this downloadable PowerPoint template for gap analysis, which you can download free of charge, using Office Timeline. You can edit the fields and colors to match your company’s branding directly in PowerPoint, but it’s much faster and easier to do so with our add-in.
To get a sense of how Office Timeline can help you create amazing looking timelines, Gantt charts, roadmaps or swimlane diagrams, you can try out the free 14-day trial.
5. Conclusion
Conducting a gap analysis can yield numerous benefits and is, therefore, one of the most valuable tools in the project manager’s arsenal. Knowing where you are, where you want to go and how to get there can be instrumental in creating a feasible and effective plan of action.
This framework allows you to question and evaluate processes in your company by comparing the baseline with a desired future state, in order to optimize results and minimize expenditures.
It’s worth remembering that a gap analysis isn’t something you do once; it should become part of your venture’s continuous improvement plan. The desired state is not a fixed point that can be reached, but a continuously moving target on the business battlefield. There are always ways to do things better than your competitors or simply better than you did them yesterday.
Nonetheless, since you can’t spend all of your working hours creating presentations for your stakeholders, one way you can expedite the process is to use templates. Simply input the data and you’ve got yourself an action plan ready to go.
6. Gap analysis FAQ
Let’s explore some of the most frequently asked questions about gap analysis.
Gap analysis is a formal framework used to evaluate the current state of a business venture or a project in comparison with a future desired state. To this end, it analyzes various factors such as technology, planning, capital, etc. and helps identify areas where the allocation and integration of these resources can be optimized. In short, gap analysis relies on real time data to map a path towards success.
The importance of gap analysis in projects cannot be stressed enough. In every company, resources – human, physical or technological – are finite. A project manager’s job is, to a large extent, ensuring that the capital is allocated in such a manner that it allows the successful completion of goals and objectives. Therefore, the best way to go about it is to ensure that the organization is not bleeding resources by sticking with clinging to outdated and ineffective processes. At the same time, if everyone’s focus is aligned towards the same goals, scope creep becomes a non-issue.
There are often inconsistencies between the general business strategy of an organization and the projects it undertakes, and these are not always obvious. For instance, while both the stakeholders and the production departments are working towards increasing the profit margin, the former may be trying to do so by cutting spending while the latter by replacing outdated machinery.
Performing a gap analysis reveals these discrepancies and can even chart a middle-ground path forward.
To get started with a gap analysis, you will need to:
- Define the project goals and objectives;
- Identify the current state or baseline;
- Determine the desired future state;
- Analyze the gap between them;
- Create an action plan.
As you will most likely carry out this evaluation many times and in different contexts, we strongly recommend using templates, like the free downloadable PowerPoint template for gap analysis in our guide.
There are a number of frameworks PMs can employ to define their project goals, but SMART is among the most frequently used ones, particularly in conjunction with gap analysis. You can check out our comprehensive guide to SMART goals, but here’s a short recap of the criteria they should fulfil:
- Specific – defines what needs to be accomplished and what must be done towards this end;
- Measurable – relies on clearly defined metrics to evaluate progress;
- Achievable – ensures the availability of necessary resources and potential constraints;
- Relevant – checks if the overarching business strategy is in sync with the current project goal;
- Time-bound – specifies a fixed timeframe for achieving the objective.
Balanced scorecards are one of the most effective tools for assessing the current state of a project or a company, as these frameworks often contain all the data required. To determine what data to extract, you should first set a goal and then examine all the KPIs pertaining to it. There can be many “current states”, but only the one that you intend to change is relevant to you.
The desired future state should be an achievable point within a reasonable timeframe that is considered progress from the current state. You can set this target based on internal (past evolution) and external data (competitors, market conditions, etc.). By breaking down the necessary work to reach the desired state into smaller project phases and manageable tasks, you can create a relevant timeline and estimate the project’s duration much more easily.
Almost every project manager’s guide to gap analysis recommends using question-based frameworks like ‘The 5 Whys’, the Mckinsey 7-S, SWOT, or the Nadler-Tushman to figure out the origin of the identified gap and how to address it. However, it all boils down to selecting the appropriate framework for the specific problem that you wish to address.
Developing an action plan is the final, hands-on part of the gap analysis framework. Timelines and Gantt charts are some of the best tools for effective gap analysis because they allow breaking down a large project into smaller, distinct phases with the help of milestones, transforming the workload into manageable tasks and setting deadlines. This type of project visuals not only helps plan the work, but are also excellent ways to showcase progress for the stakeholders and management.
Besides timelines and Gantt charts, you can complement your gap analysis with frameworks like SWOT, PESTLE or the Fishbone diagram. All of them can be employed separately or in combination, depending on the type of data you intend to extract and evaluate.
Conducting a SWOT analysis reveals both internal organizational factors (strengths, weaknesses) and the external context (threats, opportunities). These variables offer an overview of the business and its industry context, so as long as you’re in the know, it becomes easier to spot gaps and create strategies for bridging them.
The PESTLE framework is designed to evaluate external circumstances rather than an organization’s capabilities. However, it is more exhaustive than SWOT’s threats/opportunities sections. PESTLE looks at political, economic, social, technological, legal and environmental factors that can impact your company’s future plans, allowing you to see the bigger picture when you evaluate business strategies.
Fishbone or Ishikawa diagrams are designed specifically for determining the origins of an issue. In this framework, you start with a problem and work backwards to first identify the category of factors that can have an impact, and then the specific causes behind them. In essence, it’s a brainstorming technique in which the visual representation of the issues and causes facilitates analysis and solution finding.
Discovering the origin and extent of the gap between the current and desired states is step one. Step two involves creating an action plan with a set deadline that takes into account all the data uncovered in the analysis and transforms it into actionable steps. Creating a timeline of the project anchors it into reality.
To stay afloat and thrive, all organizations must continue to evolve and grow. As of such, there will always be a current state and a desired future state that it has yet to reach. Conducting regular and thorough gap analyses is an excellent way to continue progressing and keep up with the competition.
Tim is Co-Founder & CEO of Office Timeline, a Seattle-based start-up that aims to rid the world of boring, uninspiring meetings.
Turn project data into professional timelines
Get the advanced features of Office Timeline free for 14 days.
