If you prefer managing projects in Microsoft Excel, you’re in good company. Despite not being built as a dedicated project management tool – and with countless specialized apps available – it remains a go-to solution for many project managers.
Why is it so popular? Because it’s familiar, accessible, and cost-effective. For simple projects, spreadsheets offer a practical way to plan and track work without steep learning curves or high subscription fees.
On this page, you’ll learn how to use Excel for tracking, reporting, and visualization. We’ll show you how to build Excel Gantt charts, timelines, project planners, and trackers – plus give you a head start with free, presentation-ready templates.
From spreadsheets to project visuals
Excel is great at crunching numbers, but when it comes to managing projects, raw data alone isn’t enough. Stakeholders need to see the story behind the data – quickly and clearly.
That’s where visual project management proves its value. Instead of burying teams in long, text-heavy reports, it transforms schedules, trackers, and status updates into intuitive charts and dashboards.
By combining data analysis, reporting, and visualization, project managers can turn complex project information into concise, actionable insights. With Gantt charts, timelines, and project trackers, you can share real-time views of milestones, risks, and issues – giving teams and stakeholders the clarity they need to collaborate better and make faster, smarter decisions.
Impress stakeholders with clear project visuals
Office Timeline transforms project details into visuals that engage executives, align teams, and make every update easy to present and remember.
Visual project management tools
Good project management tools go beyond simple task lists. To keep execution moving, they typically offer:
- Task tracking;
- Deadline management;
- Progress monitoring.
Visual project management tools take it a step further by turning raw data into intuitive, easy-to-read visuals.
The best solutions also deliver:
- Customizable visualizations;
- An intuitive interface;
- Real-time collaboration;
- Scalability for growing teams and projects;
- Seamless integration with the tools managers already use.
Is Excel a visual project management tool?
Strictly speaking, Excel isn’t visualization software. Yet it remains one of the most popular project management tools for small to midsize projects.
Why project managers choose Excel:
- Familiar and accessible;
- Versatile for many use cases;
- Cost-effective compared to dedicated tools.
Paired with Excel’s built-in charts and graphs, its core strengths – data organization, analysis, and storage – make it a surprisingly capable PM tool. With the right setup, you can:
- Track tasks.
- Monitor progress.
- Present project data visually.
The caveat: Excel has its limits. For complex or multi-project environments, capacity and functionality may fall short compared to dedicated project management tools.
Still, there are solutions that turn spreadsheets into visuals that teams and stakeholders can grasp more easily. One example is the Office Timeline add-in for PowerPoint, which integrates with Excel so you can import your data and transform it into clear, presentation-ready project visuals.
Prefer to keep everything in Excel? Office Plan, our upcoming add-in, lets you create clear project plans right where your data already lives.
Data visualization in Excel
Excel’s main data visualization engine is its Charts feature (found under Insert on the ribbon). Depending on what you want to highlight, you can choose from a wide range of built-in chart types, including:
- Column charts – compare data across categories;
- Bar charts – horizontal alternative to column charts;
- Line charts – show data changes over time;
- Pie charts – illustrate proportions or percentages;
- Area charts – highlight the magnitude of data over time;
- Scatter plots – show the relationship between two variables;
- Waterfall charts – reveal how values increase or decrease step by step;
- Stock charts – track the movement of stock prices or other instruments;
- Combo charts – combine chart types to emphasize different insights.
For project management, Excel can also be stretched further to create more complex visuals, such as:
- Gantt charts – to compare planned work vs. actual status;
- Timelines – to map tasks and milestones in sequence;
- Strategic roadmaps – to present a high-level project overview;
- Swimlane diagrams – to show responsibilities across teams or processes.
These advanced visuals require more effort to build than basic charts, but they deliver far greater value for planning, tracking, and communicating projects.
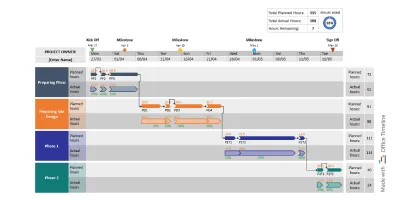
Plan smarter, present clearer
With Office Timeline, you can transform complex Excel data into PowerPoint visuals that are easy to update, share, and understand.
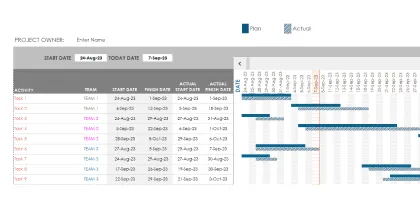
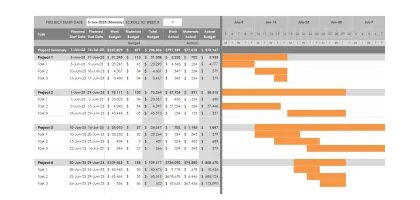
Gantt charts in Excel
Gantt charts are one of the most effective ways to visualize and track project progress. They map tasks and activities against timeframes in a clear, easy-to-read format – making them especially valuable for complex projects with multiple tasks and dependencies.
To create a Gantt chart in Excel, you’ll need to:
- Organize your data in a table with tasks, start dates, and end dates.
- Insert a stacked bar chart.
- Format it until it resembles a Gantt chart.
You can find detailed steps in our tutorial on how to make a Gantt chart in Excel.
But be warned: building a Gantt chart manually takes time and effort. To save resources, use our free presentation-ready Gantt chart templates – professional designs tailored for project management needs.
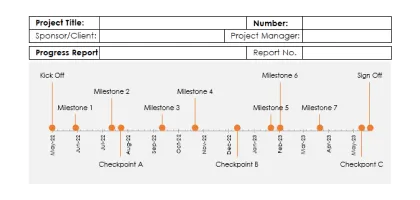
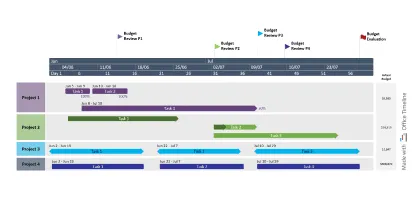
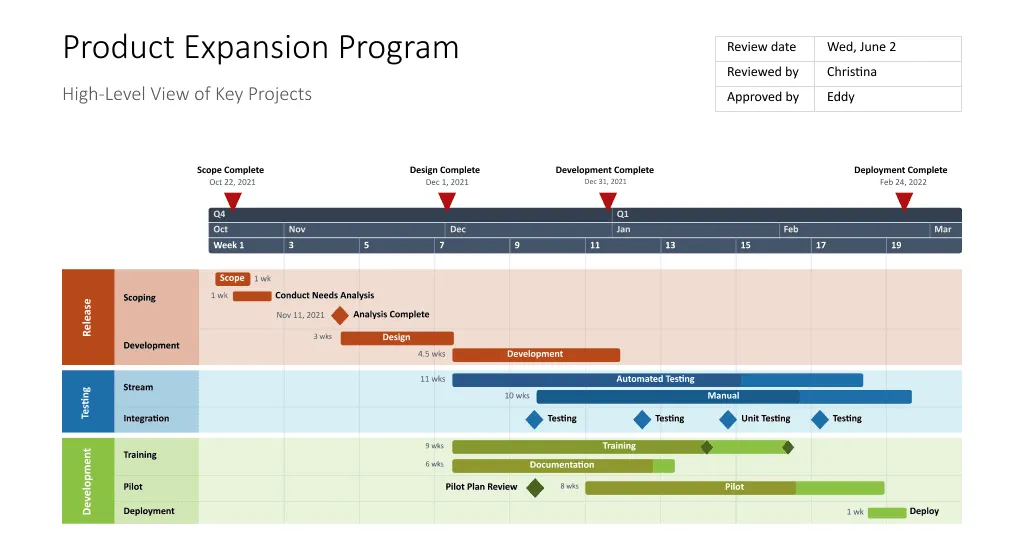
Timelines in Excel
A timeline illustrates events in chronological order across a linear timescale. It helps break projects into manageable chunks, highlight milestones, and monitor progress at a glance.
You can build a timeline in Excel in several ways (see our tutorial on how to make a timeline in Excel). For a faster start:
- In Excel, go to File > New and search for “timeline” templates.
- Or explore our gallery of Excel and PowerPoint timeline templates built for project management.
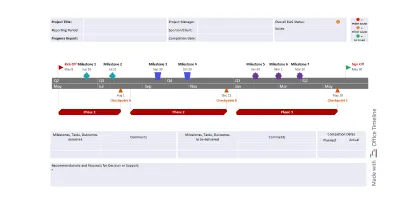
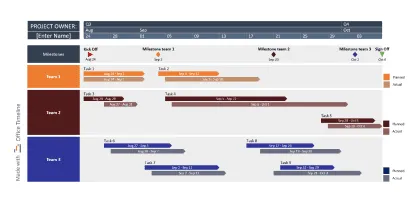
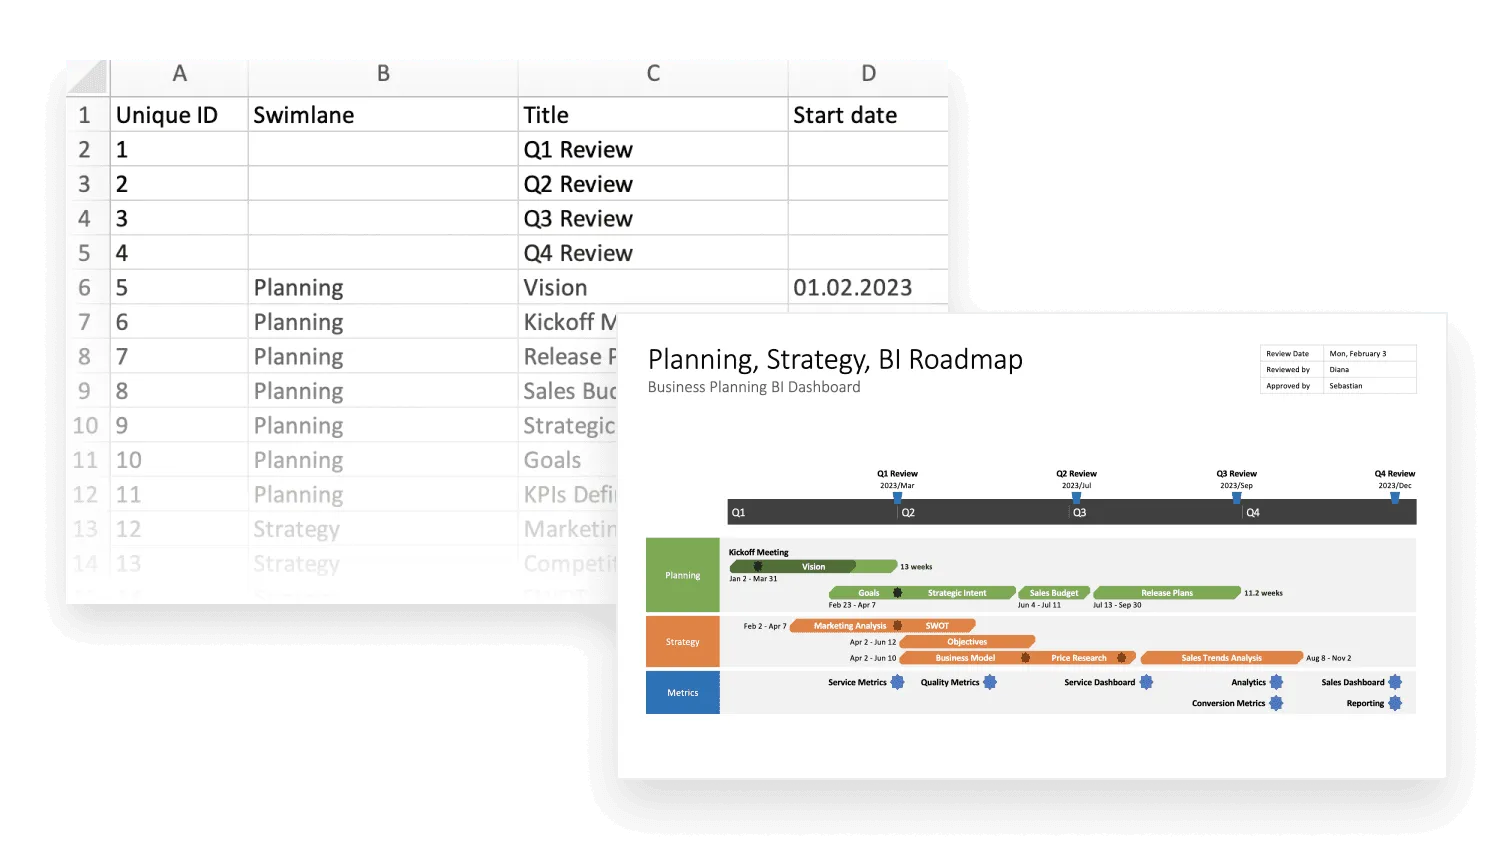
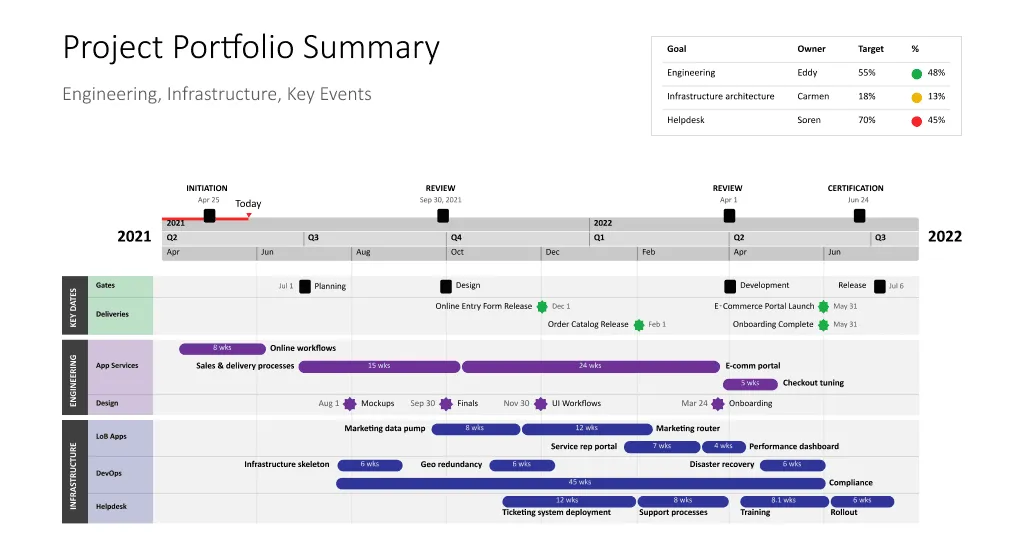
Roadmaps in Excel
A roadmap provides a high-level view of project goals, deliverables, and timelines. Its primary purpose is to align stakeholdersstakeholders – teams, executives, and clients – on a shared vision of the project’s journey.
- Organize data in a table with tasks and milestones.
- Use SmartArt or custom shapes to visualize the progression.
- Arrange elements logically to illustrate trajectory and outcomes.
Because Excel’s roadmap options are limited, many PMs turn to templates. To help, we’ve created a set of Excel and PowerPoint roadmap templates designed to jumpstart your planning process.
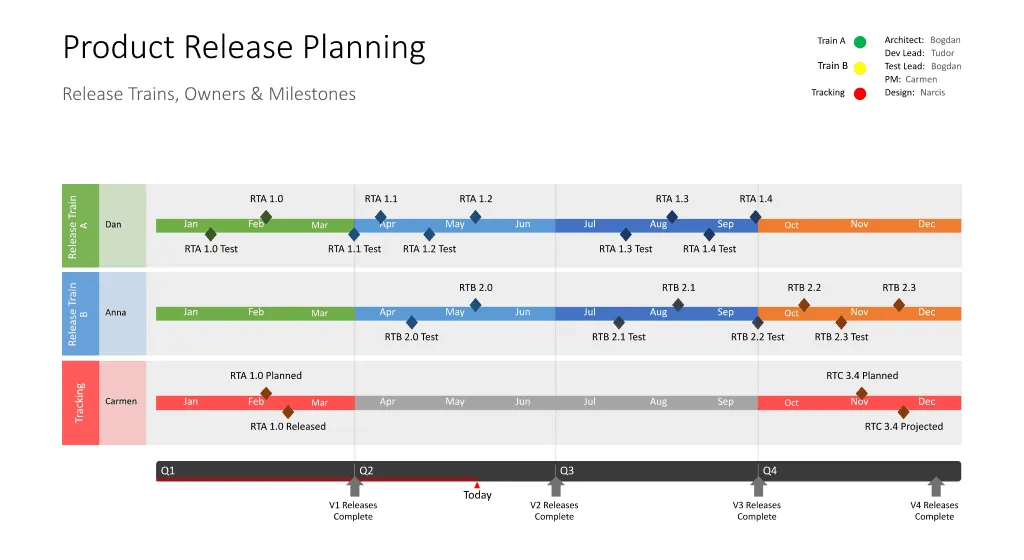
Swimlane diagrams in Excel
Swimlane diagrams are cross-functional flowcharts divided into lanes by group, team, or process. They make it immediately clear who is responsible for what, which is critical in complex projects involving multiple departments.
Without swimlanes, project visuals often become cluttered, and responsibility tracking quickly turns into a headache. By contrast, swimlane diagrams provide a clean, structured view of ownership and workflows, making collaboration far easier.
To start building one, explore our step-by-step tutorial on creating swimlane diagrams in Excel, or skip the manual work with our presentation-ready swimlane templates in Excel and PowerPoint.
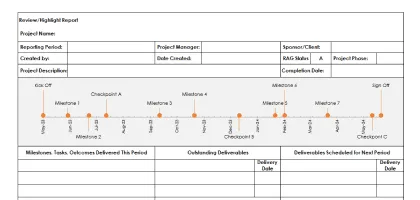
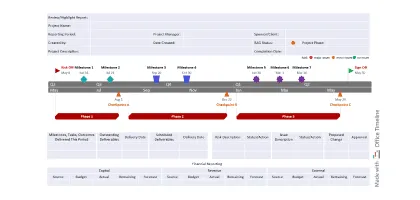
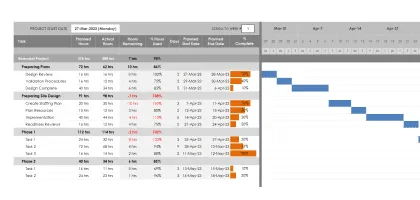
Track projects the easy way
Office Timeline turns Excel data into clear, professional trackers you can update in minutes – improving visibility and keeping teams aligned.
Frequently asked questions
Find quick answers to common questions about working with Excel as a project management tool.
Yes. Excel works well for simple projects, especially if your team is small and budget-conscious. While not designed as a PM tool, it can handle:
- Planning and scheduling;
- Tracking resources and budgets;
- Managing day-to-day tasks.
You can also build visuals like Gantt charts and timelines to map out project phases.
No, Excel doesn’t come with a dedicated project management tool. But it can still manage small to midsize projects.
With Excel you can:
- Organize, store, and analyze project data.
- Use prebuilt planners and trackers (File > New > Search “planners” or “charts”).
- Customize templates to fit your workflow.
Explore more options in our gallery of free project management templates.
Excel handles small and medium projects well but struggles with complex or multi-project environments. Common issues include:
- Time-consuming data entry: Updating large spreadsheets is slow and error-prone.
- Accuracy risks: One formula error can compromise results.
- Limited advanced features: Dashboards, expense tracking, and automation are minimal.
- Visualization gaps: Tailoring views for different stakeholders is difficult.
For richer visuals and automation, add-ins like Office Timeline can save time and reduce errors by generating timelines, swimlanes, and critical-path diagrams directly in PowerPoint. The add-in also integrates with Excel, so you can import your spreadsheet data directly and turn it into visuals that are easy to present and share.
Yes. Under File > New, search “project plan” or check the Planners and Trackers category. You’ll find several customizable templates to get started quickly.
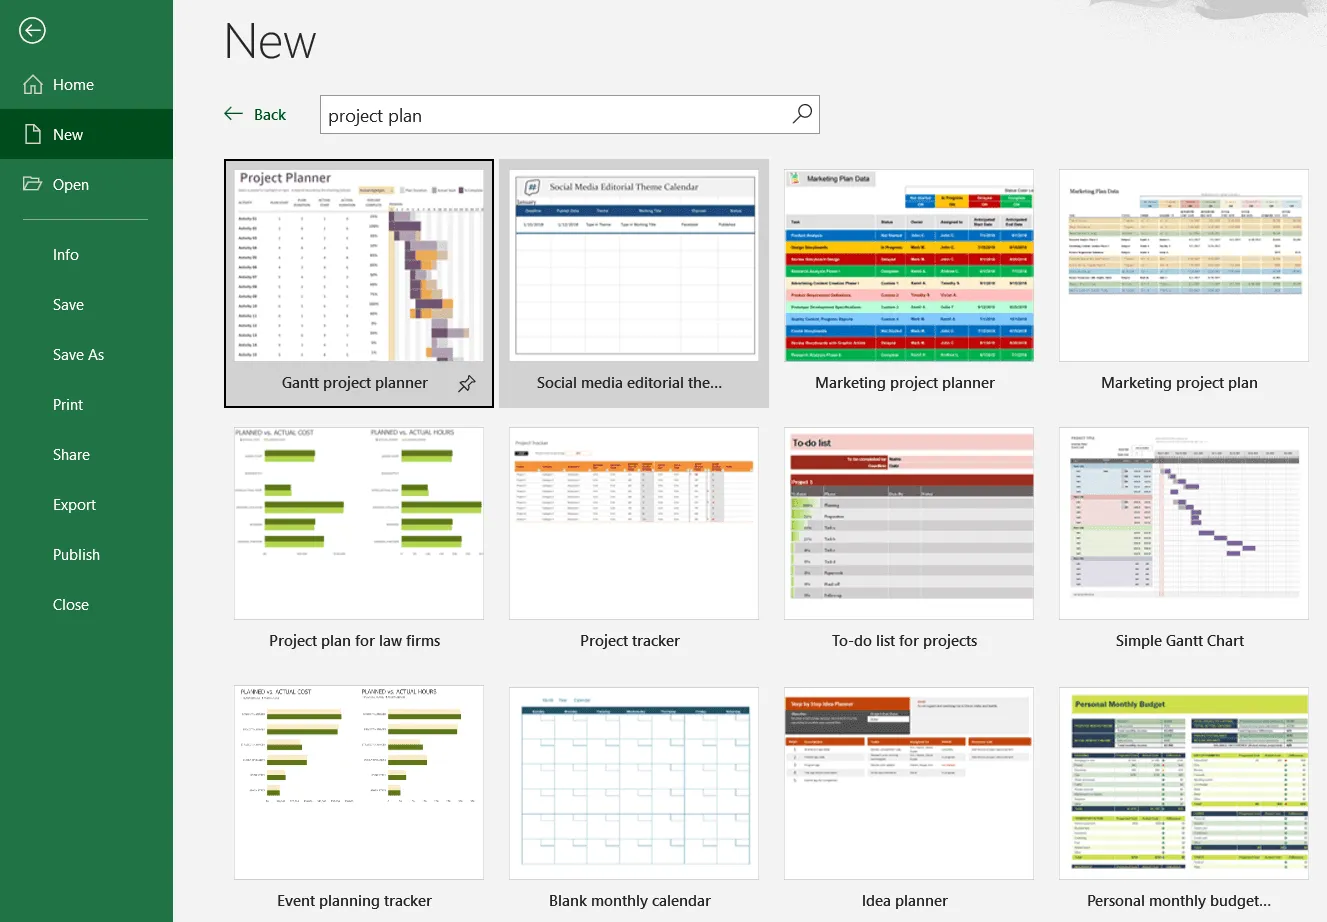
You can also use our free presentation-ready templates for more visual project planning.
Options depend on your project’s complexity:
- Simple trackers: Create tables with columns like task, due date, status, or owner. Add filters for quick sorting.
- PivotTables: Summarize tasks by team member, progress, or completion.
- Gantt charts: Use Excel’s bar charts or our Excel Gantt chart templates to track timelines.
- Timelines: Map tasks and milestones chronologically.
Tip: Keep task lists updated. Accurate planned vs. actual data is key to reliable tracking.
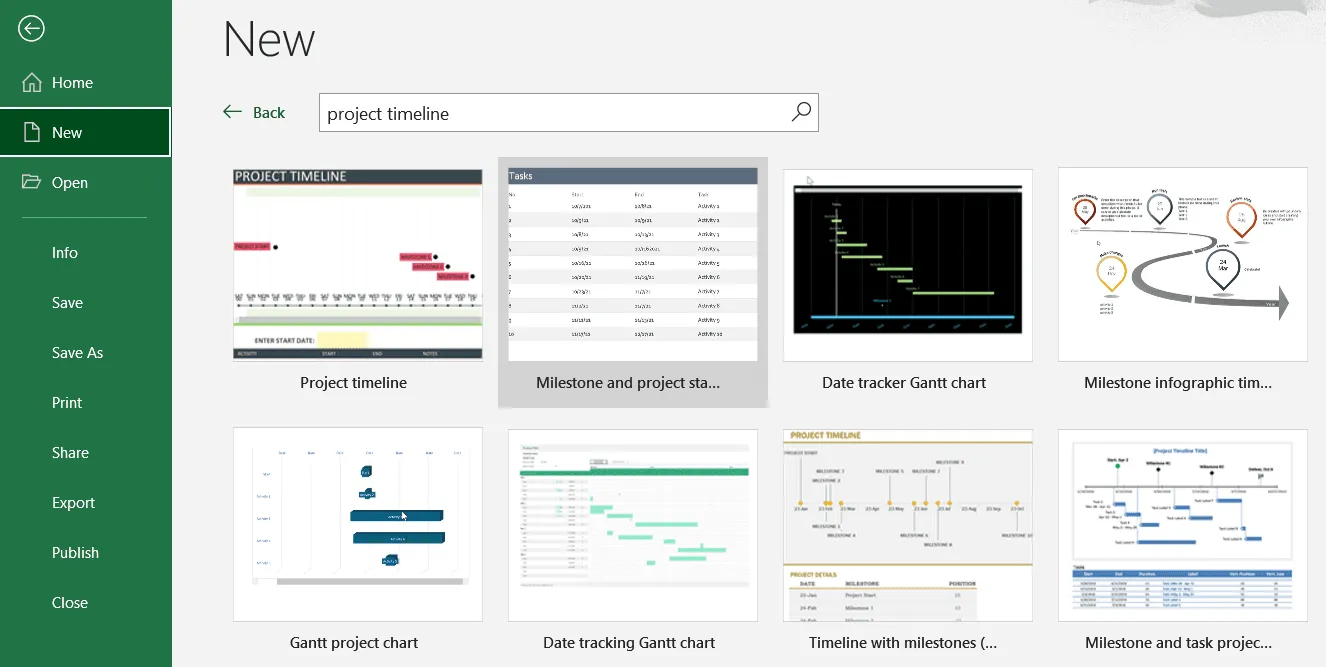
Yes. Go to File > New and type “project timeline” in the search bar. Several predesigned templates will appear, ready to customize.
Use separate worksheets within one workbook for:
- Task lists;
- Gantt charts;
- Resource allocation;
- Budgeting;
- Risk management.
Then, create a master worksheet dashboard that consolidates key information with charts and links.
Tips for better organization:
- Use templates for faster setup.
- Apply formulas, filters, and conditional formatting.
- Keep layouts consistent with clear headings.
- Name worksheets and columns descriptively.
- Update regularly and keep data clean.
It’s possible, but requires discipline:
- Create one worksheet per project (tasks, resources, budgets, risks).
- Build a master sheet summarizing project name, manager, start/end dates, and progress.
- Add charts for a quick visual overview.
The more projects you add, the harder Excel becomes to manage. For advanced needs, consider specialized project management software – or use Office Timeline, a PowerPoint add-in that integrates with Excel to consolidate your spreadsheet data and turn it into clear, presentation-ready visuals across multiple projects.
Excel supports basic project management tasks through:
- Task lists: with owners, start/end dates, and status.
- Resource allocation: who and what is assigned to tasks.
- Budgeting and costs: compare projected vs. actual spend.
For complex or multi-project scenarios, dedicated project management software can be more efficient.
An Excel project template is a reusable worksheet that saves setup time. To create one:
- Gather needed info: project name, dates, tasks, resources, budget, risks.
- Create separate worksheets for each (Gantt, budgets, trackers, reviews).
- Use a consistent layout with clear headings.
- Add a master dashboard linking to each sheet, with charts for quick updates.
Remember: a template is only a starting point – you’ll need to customize it for each project.
You can also search for project templates in Excel (File > New > Search online templates) or download from our free template gallery.
Yes. We’re developing Office Plan, an Excel-based add-in currently in Beta stage. It’s designed to help you create professional project plans straight from your spreadsheet data, without switching tools.