How to make Gantt charts with your usual office tools
Learn how to make easy-to-understand Gantt charts using your favorite productivity tools.

Using Gantt charts to visualize plans and schedules
Gantt charts are powerful planning tools as they show activities or tasks and their corresponding timeframes in a simple visual format, making it easy to see the big picture at a glance, coordinate work, and track progress. Professionals who wish to communicate their plans and schedules through a Gantt chart don’t need to install complex applications to create one. They can use the office software they’re already familiar with, as most of the “standard-issue” productivity tools have functions that can help create such visuals. Alternatively, they can use a dedicated online Gantt chart maker that would generate their visual better.
Depending on the software you use, making a clear, eye-catching Gantt chart that anyone can follow may be quite a laborious process. To help professionals get started faster, this page provides a series of tutorials that explain how to create a Gantt chart with the most popular office tools.
See a detailed tutorial that explains how to build an Excel Gantt chart and format it to look clean and easy to follow.
This step-by-step tutorial explains how to build a Gantt chart in Word using the tool’s Stacked Bar feature, along with some customization tips.
See how to create a Gantt chart by formatting a Stacked Bar chart or using a simple PowerPoint plugin.
This tutorial explains how to generate a clear, simple Gantt chart in MS Project and prepare it for client presentations and executive meetings.
See how to create a Gantt chart within your Google spreadsheet by using a Stacked Bar Graph and a bit of formatting
See how to turn your data table into a Gantt chart by tweaking the tool's 2D Stacked Bar feature.
This tutorial explains the steps involved in building and customizing a Pages Gantt chart.
This step-by-step tutorial will show you how to create a simple Gantt chart in Keynote starting from one of the built-in chart types available.
Why professionals rely on Office Timeline
I am constantly required to provide executive-level views of project plans in an uncomplicated way. Office Timeline makes vibrant, easy to understand Gantt charts, and the import and refresh functionality make it a must-have application in my project toolkit.

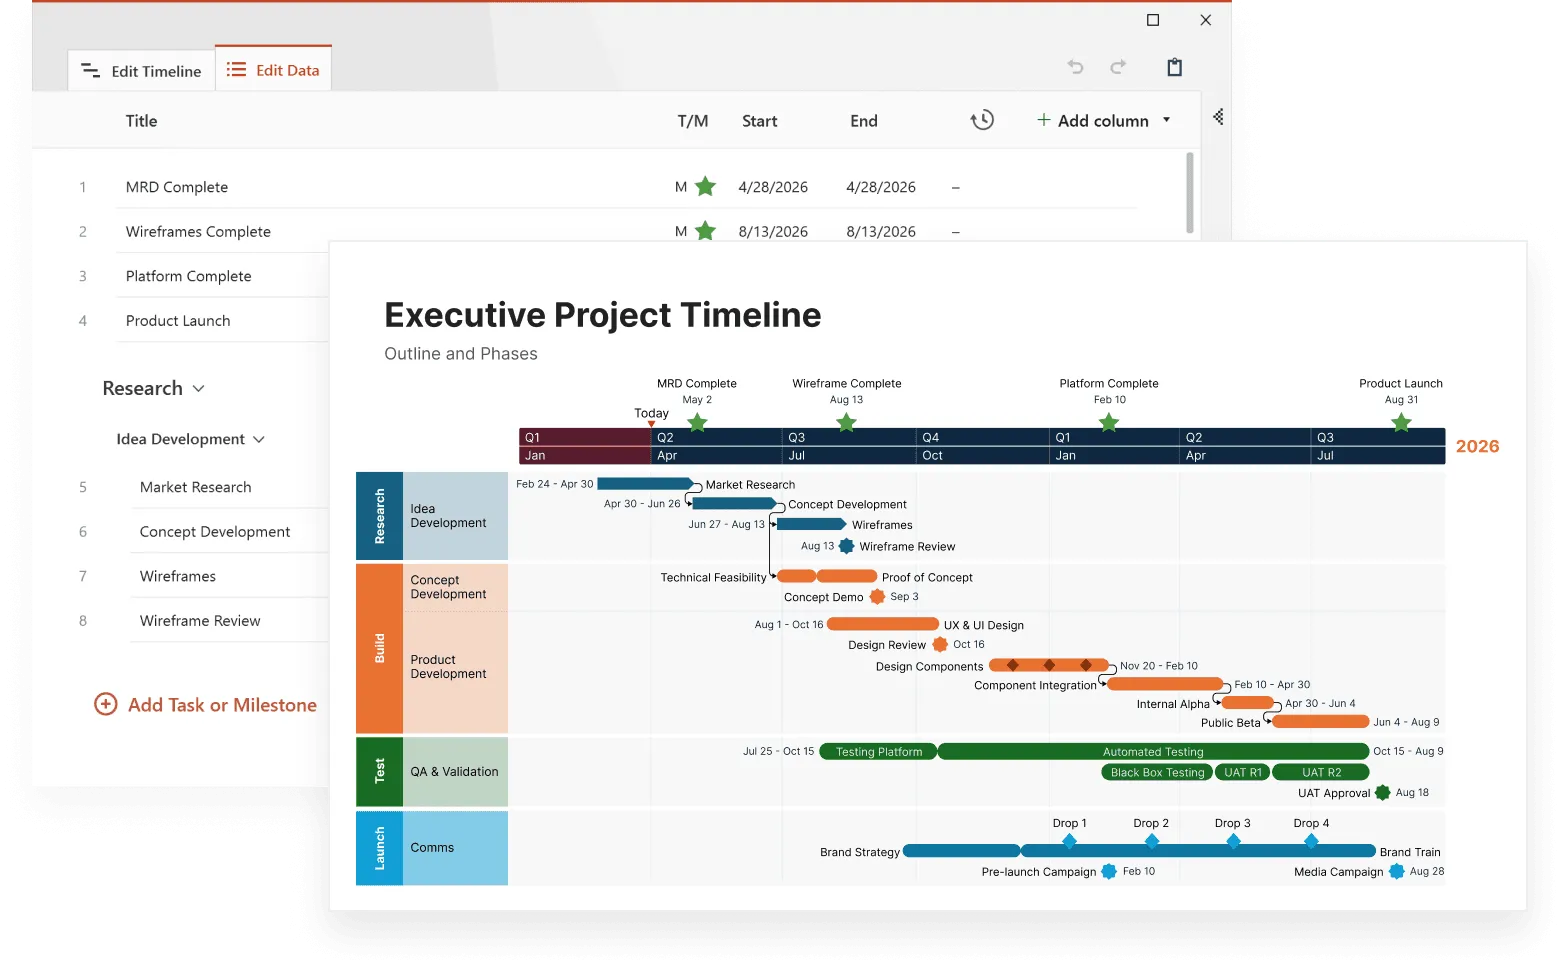
PowerPoint Gantt Chart Maker
For important presentations, professionals can use a PowerPoint Gantt chart maker to build eye-catching visuals in minutes. The Office Timeline PowerPoint plug-in integrates with popular office tools to instantly turn raw data into Gantt chart slides and update them automatically.


