In project management, roadmaps provide a big-picture view of your product or project strategy. They help align teams, executives, and clients on a shared vision and illustrate how plans evolve over time.
A roadmap is essentially a visual overview of goals, key deliverables, and timelines – easy to understand at a glance. Now let’s look at how you can build one in practice.
Options for making an Excel roadmap
You can build a roadmap directly in Excel by structuring your data in a table and using cells and shapes to represent tasks and milestones. If you need a roadmap that you’ll update frequently for clients or executives, it may be quicker to build it in PowerPoint.
On this page, we’ll cover both approaches: first, step-by-step instructions for making a roadmap manually in Excel, and then a faster way to generate one automatically in PowerPoint by copying or importing your Excel data.
Which tutorial would you like to see?
Manually create a roadmap in Excel
Before diving into the step-by-step instructions, remember that roadmaps are high-level strategy overviews. You should first map your strategy clearly and identify its main components so you can define and align the items in your roadmap before building it in Excel.
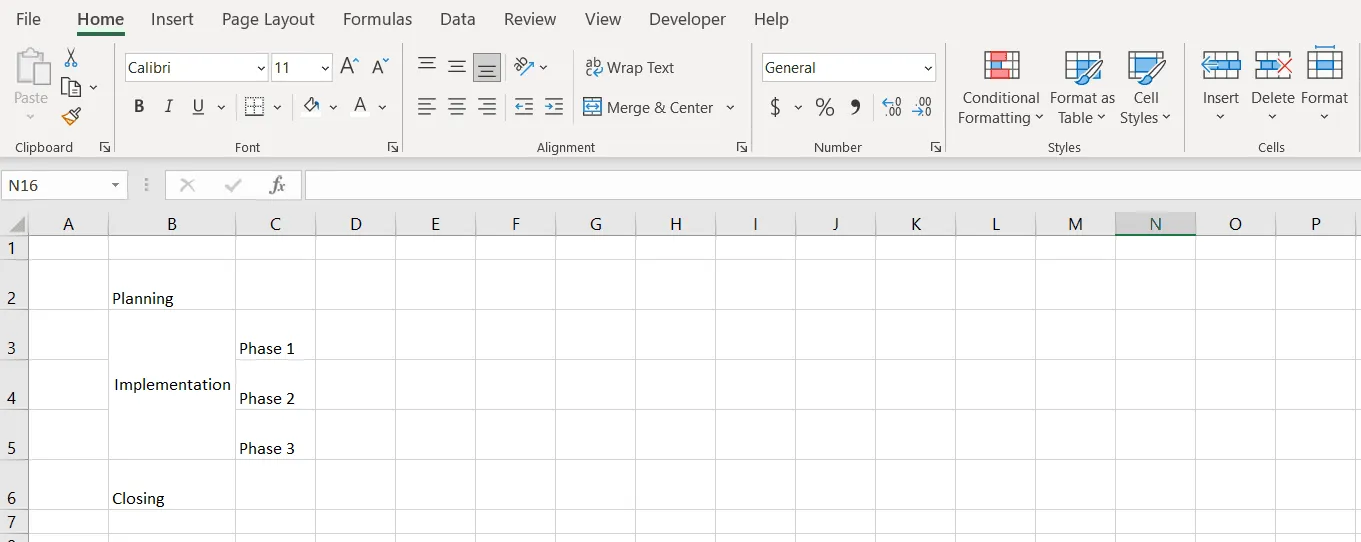
1. List the key components of your project.
Start by identifying the main categories of your roadmap. In a new spreadsheet, list the main components in a column. This will be the vertical axis of your roadmap. Based on what you need to visualize, the roadmap components may represent processes, product phases, features, teams, resource allocation or scope details and priorities. In our roadmap example below, we listed a few project steps and broke down one of the steps into phases.
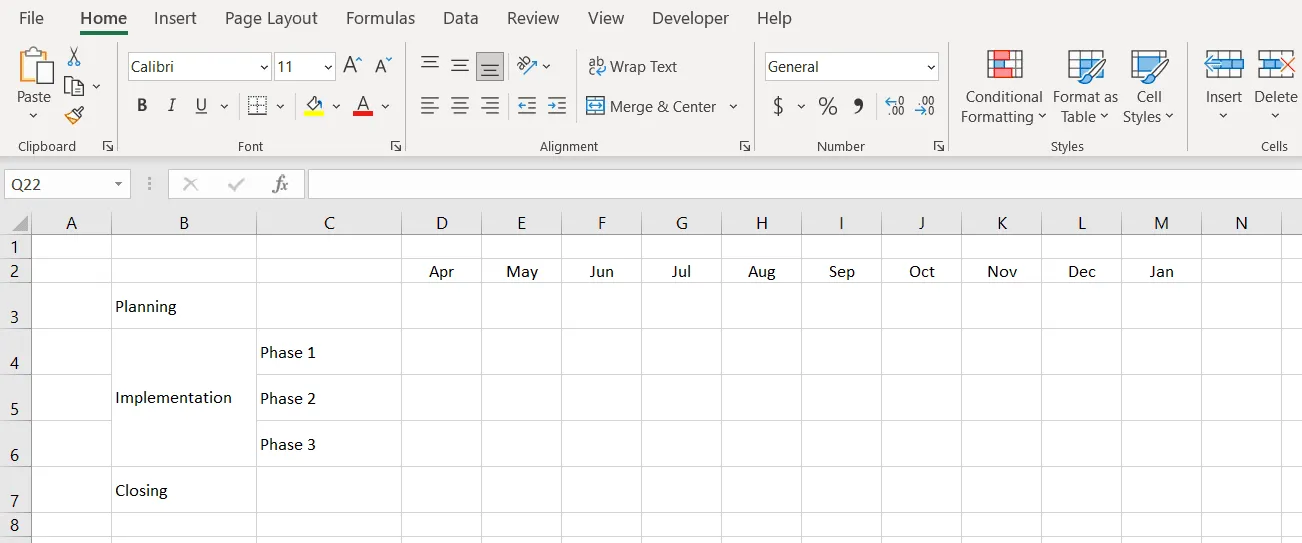
2. Set a timeline at the top.
The first row in your table will be built as a timeline band, being the horizontal axis of your roadmap. List the time units of your choice (months, quarters etc.) so that you can use them as time reference for the tasks and milestones you’ll include in your roadmap.
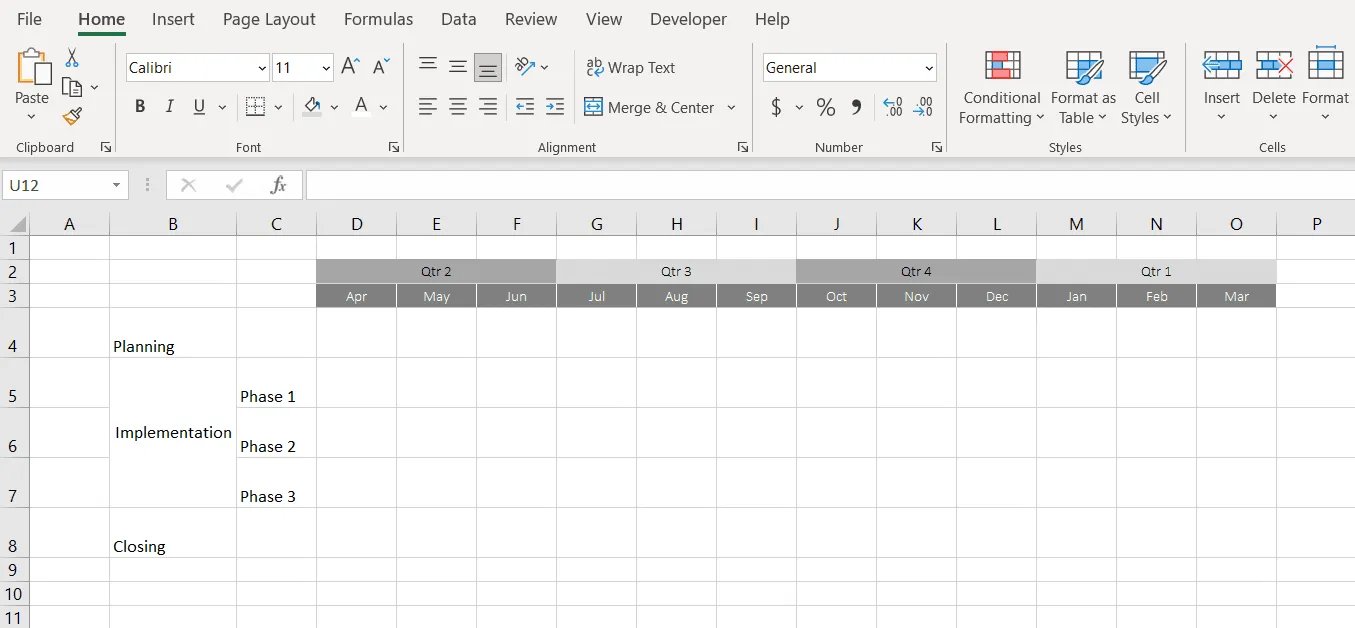
You can add as many time units as you need in this step or at a later time. Also, if you need multiple reference sets, you can insert multiple time bands. In our example, we wanted to have a quarterly time band as well:
3. Set up horizontal swimlanes and sub-swimlanes.
For improved clarity, you can visually group the process steps by placing them in parallel rows that divide the roadmap into swimlanes. Thus, each swimlane will correspond to a process step. Also, for secondary process steps, you can set up sub-swimlanes (secondary swimlanes). In our roadmap example below, we listed a few project steps and broke down one the Implementation step into phases, (Phases 1, 2, 3).
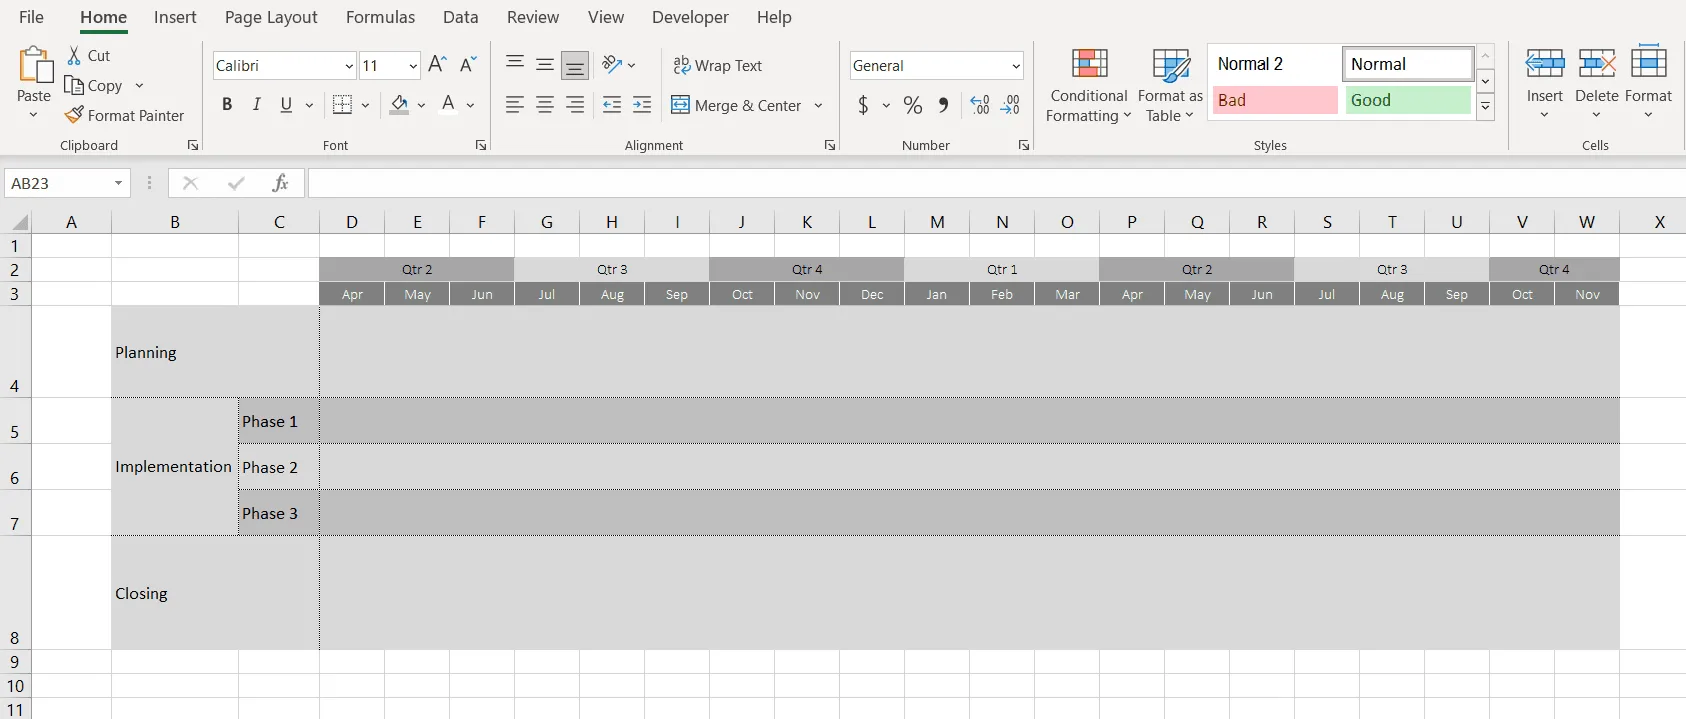
Thus, the vertical axis will represent the steps of the overall process, while the horizontal swimlanes describe the details included in each process and process phase.
4. Include the details of each project step in swimlanes.
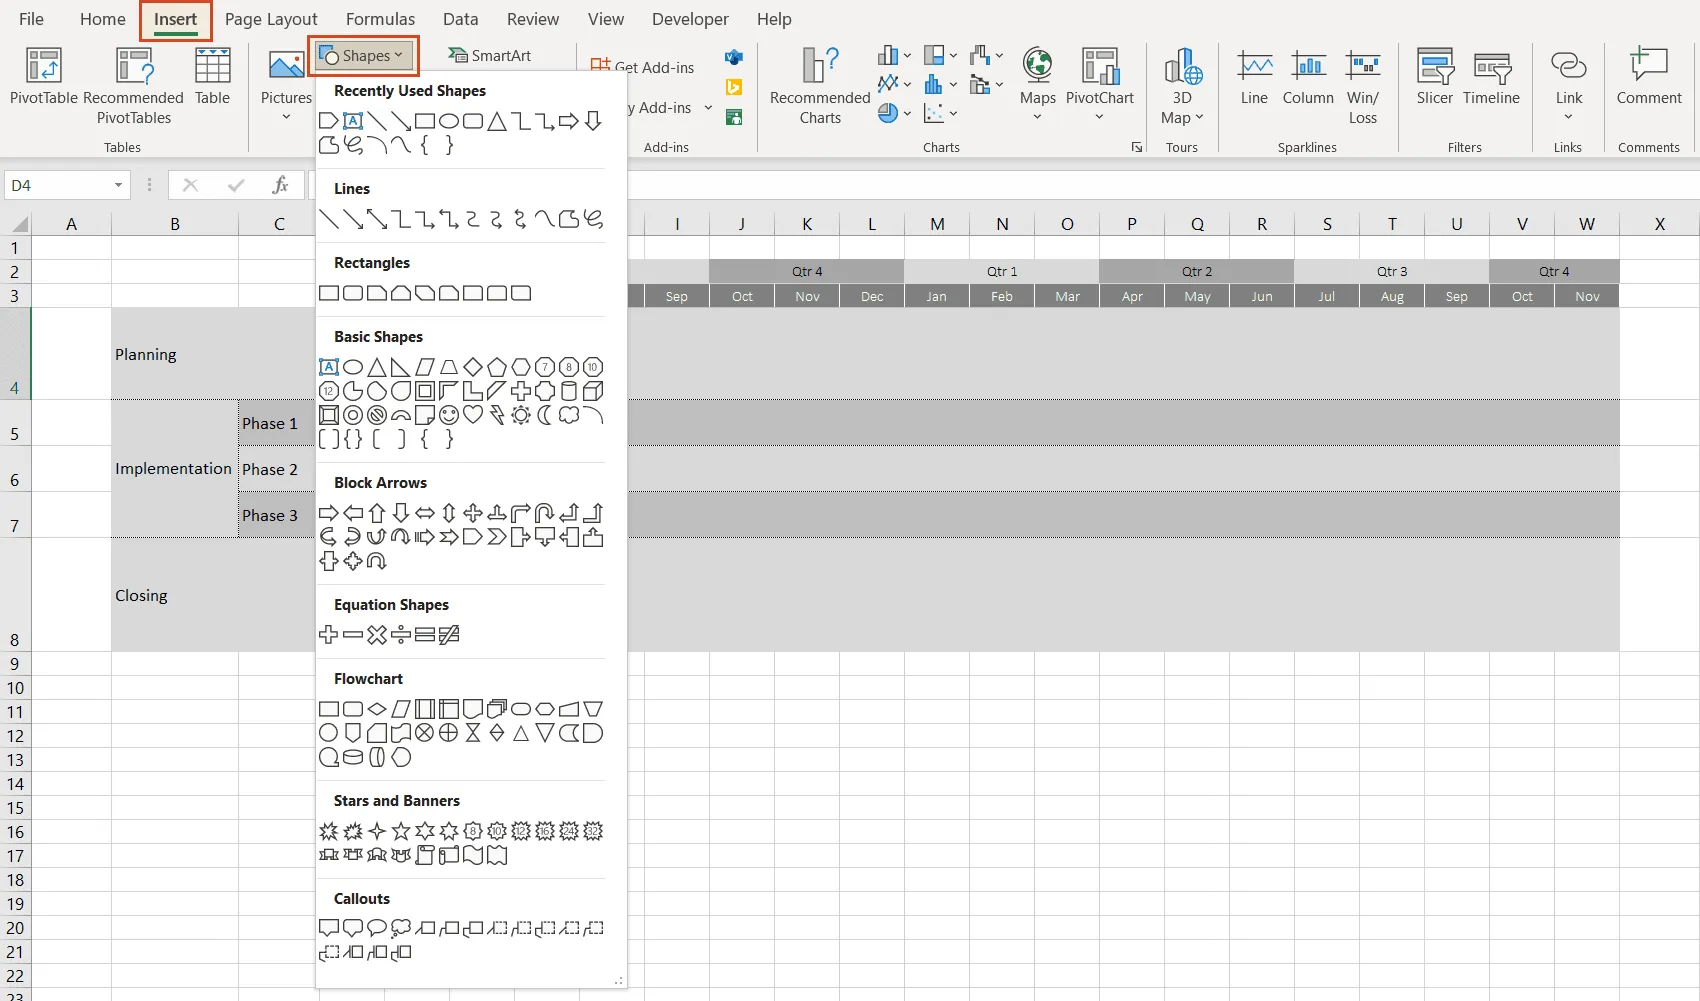
On each swimlane, insert shapes to include details for each project phase or component that we set as a column in step 1 of these instructions.
a) Go to Insert > Shapes and select the shape you like.
b) Draw the shape. Place the cursor in the needed position, on the swimlane or sub-swimlane where you want to position the shape and drag to draw.
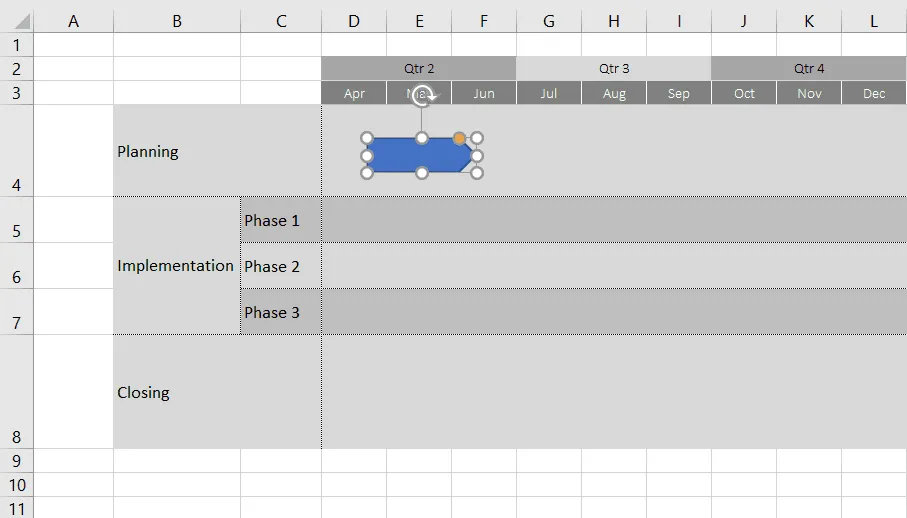
c) Adjust shape width to fit the time reference. Roughly estimate the time frame of each project component represented by a shape and use the time band as a reference to adjust the size of the shapes. Drag the left end or the right end of the shape to bring the shape to the needed width, so that it matches the time reference on the timeline.
d) Add as many shapes as needed in the desired format. Repeat steps a, b, c as many times as you want, adding various shapes to your roadmap, and placing them as needed.
If you want to optimize the looks of your roadmap, here are some tips and tricks to help you format your roadmap in Excel:
i. Move multiple shapes at once. To so, click on the desired items after pressing and holding the Ctrl key, and drag and drop them into the new position.
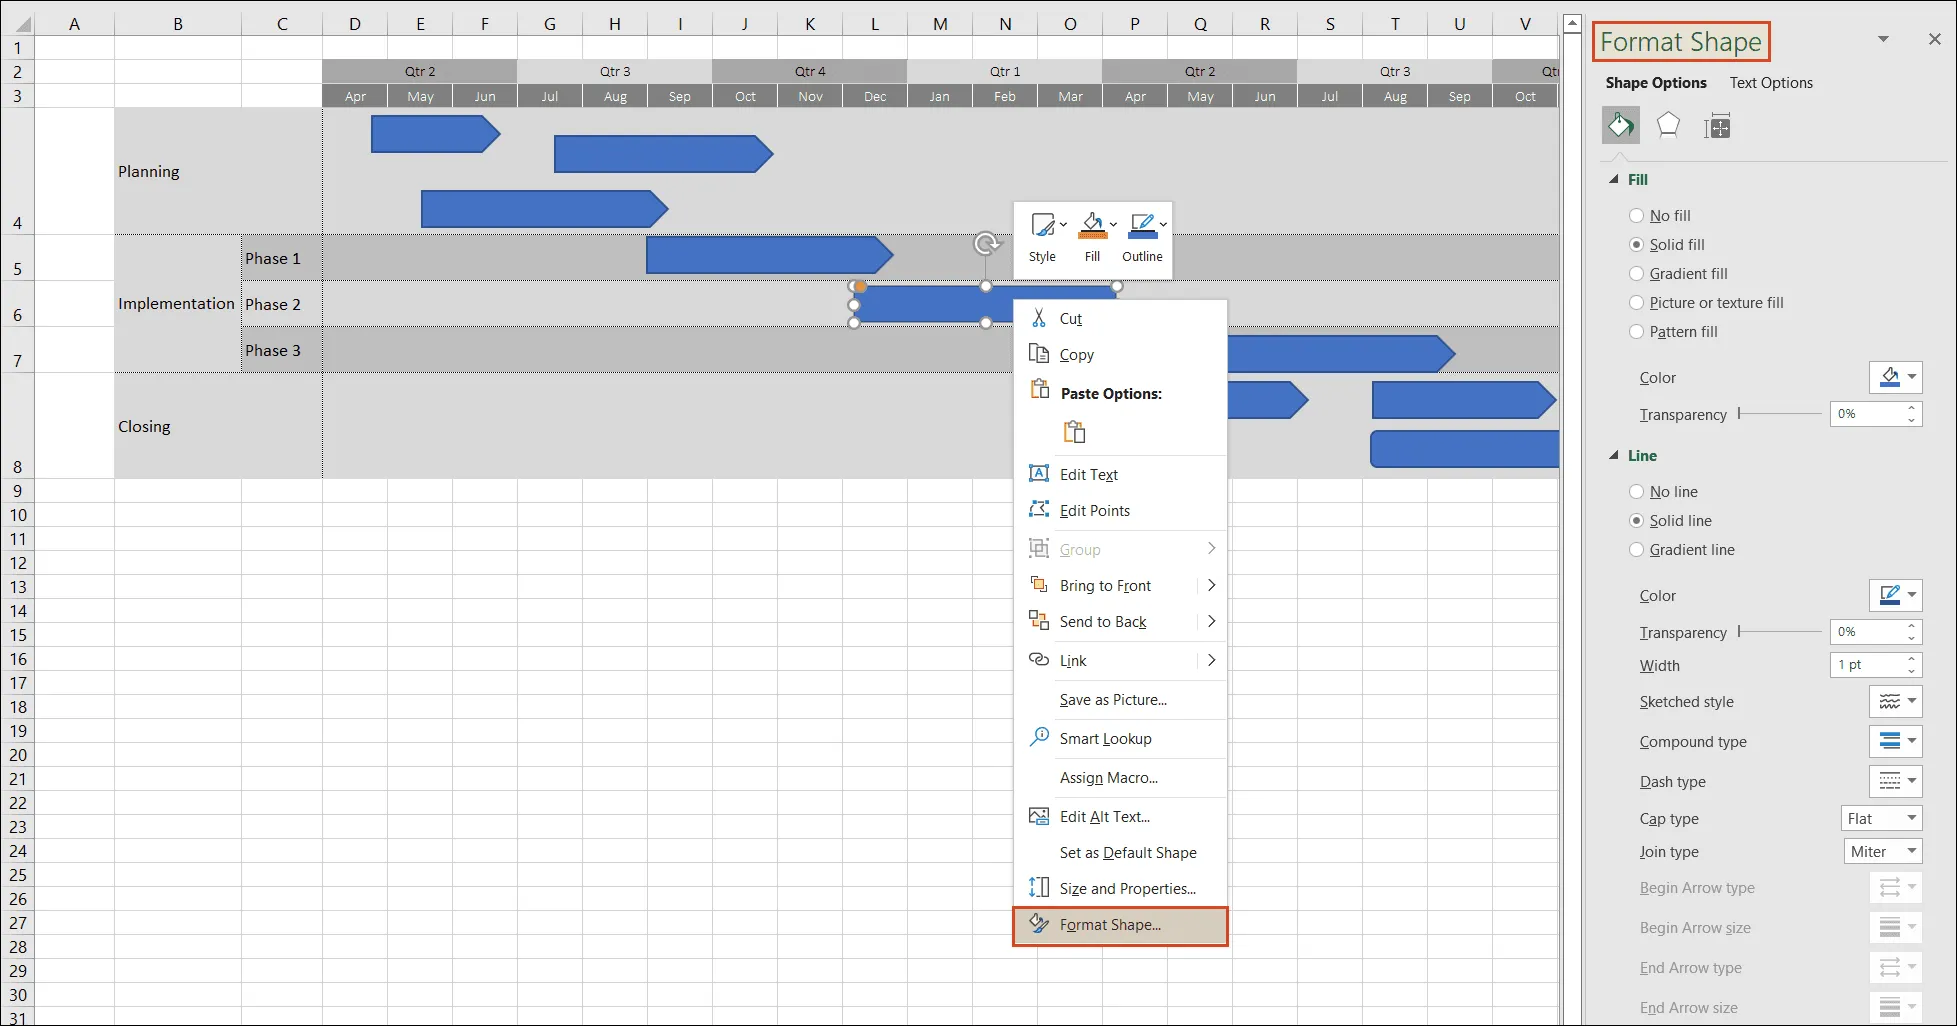
ii. Format shapes. Right-click on any shape and open the right-side Format Shape menu. Here, you can find a series of formatting options such as edit shape, change shape color, apply shape effects, text box positioning, aligning, grouping, and various text formatting options (text effects and coloring), which we’ll need later, after adding text to shapes.
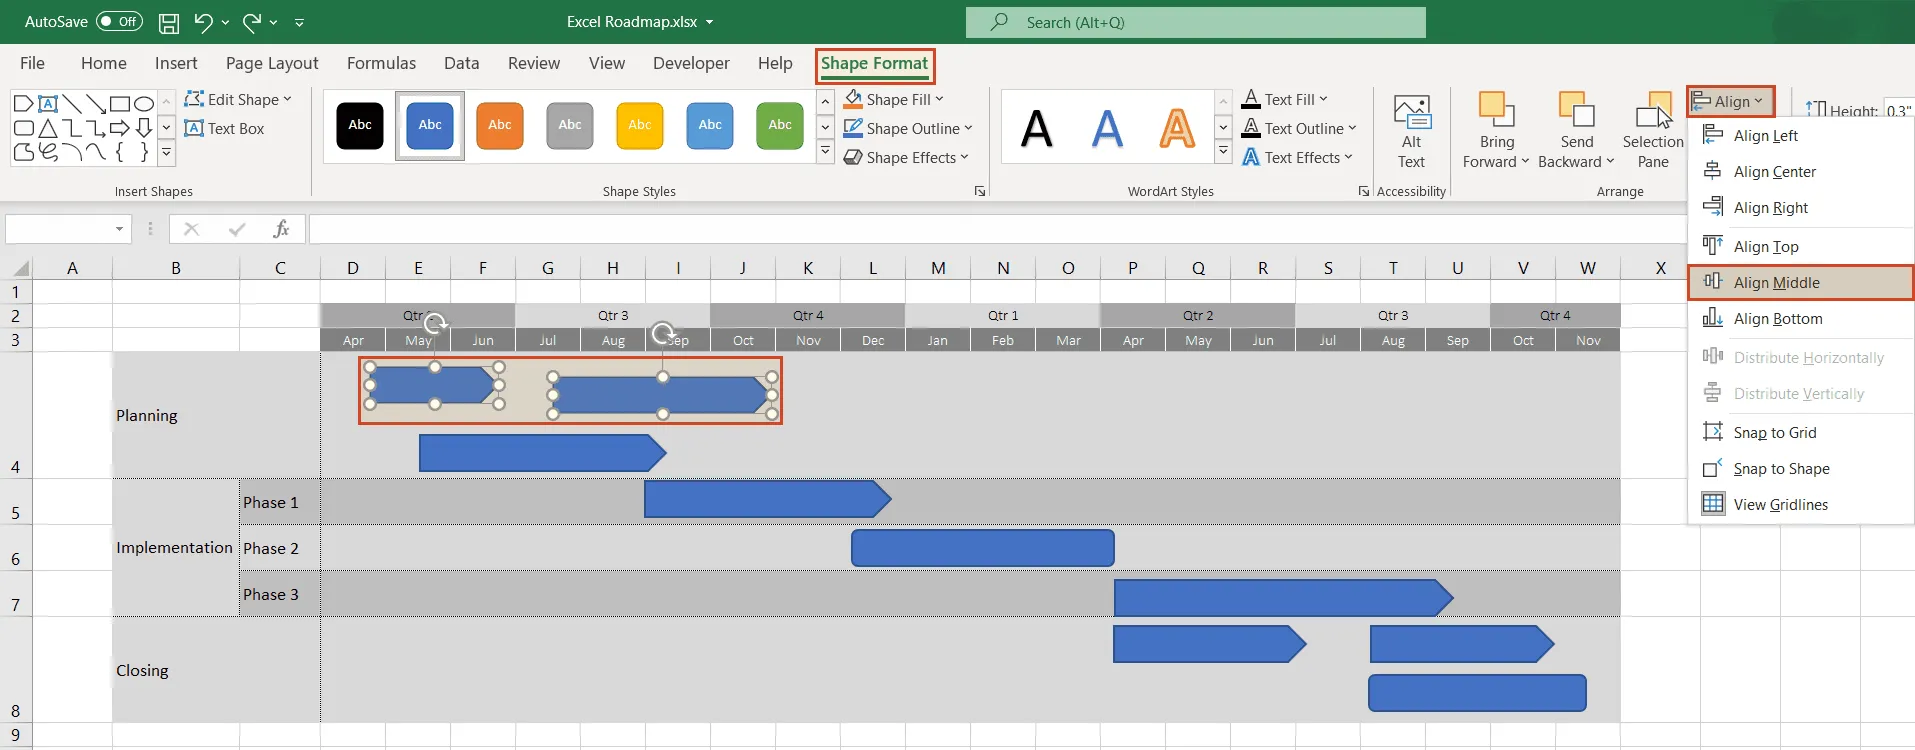
iii. Align and group shapes. Selecting one or more shapes will also enable the Shape Format option in the top menu. Here, you’ll find options to align shapes vertically or horizontally…
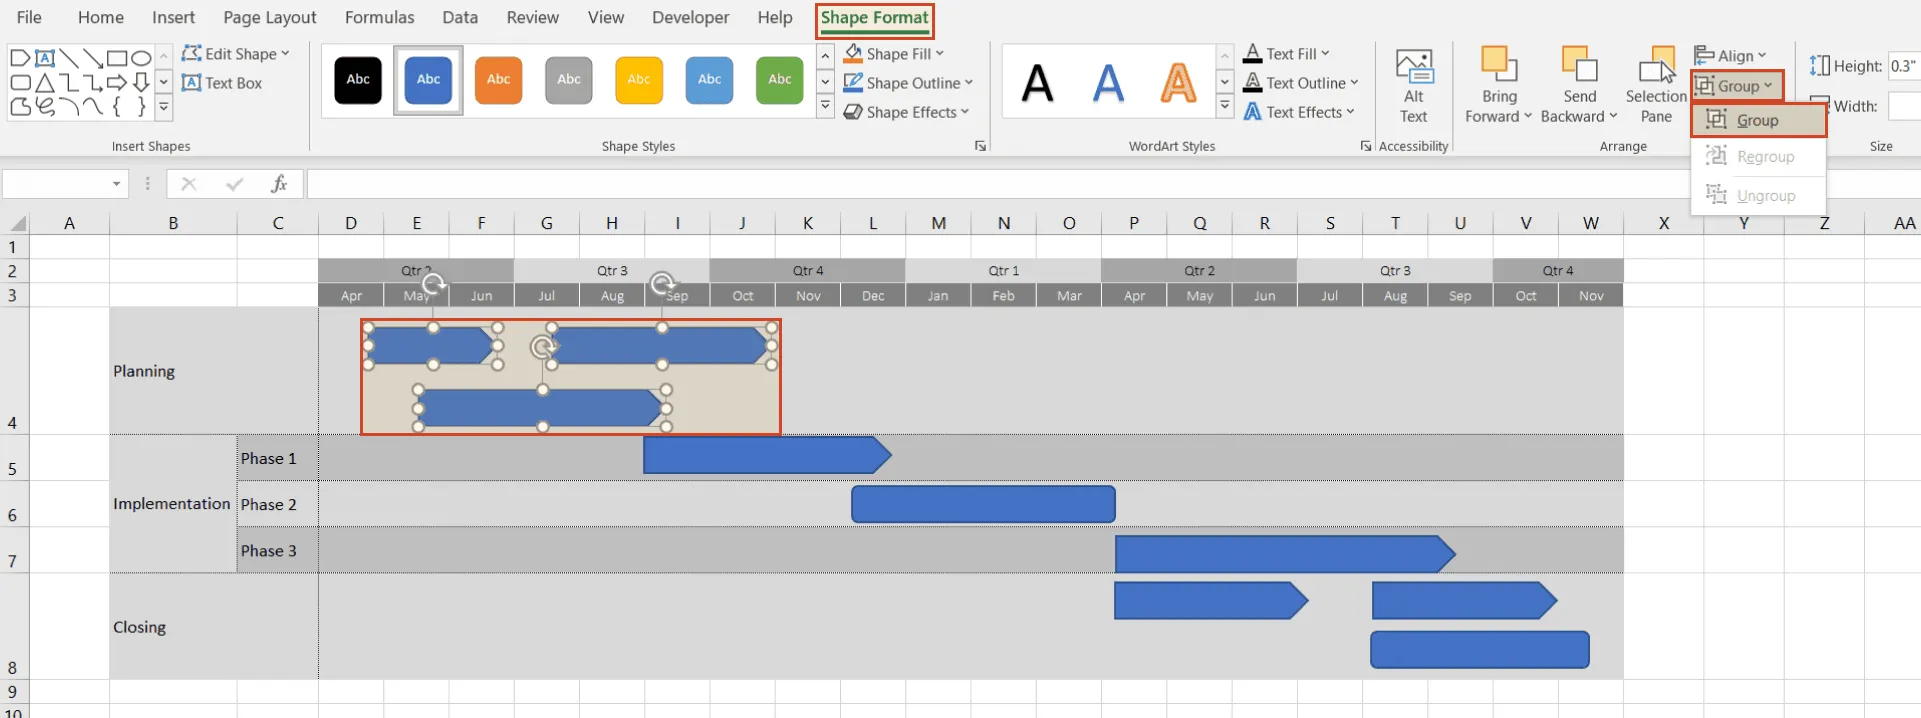
... or manage shapes as a group (move more shapes at once or assign properties collectively instead of one by one):
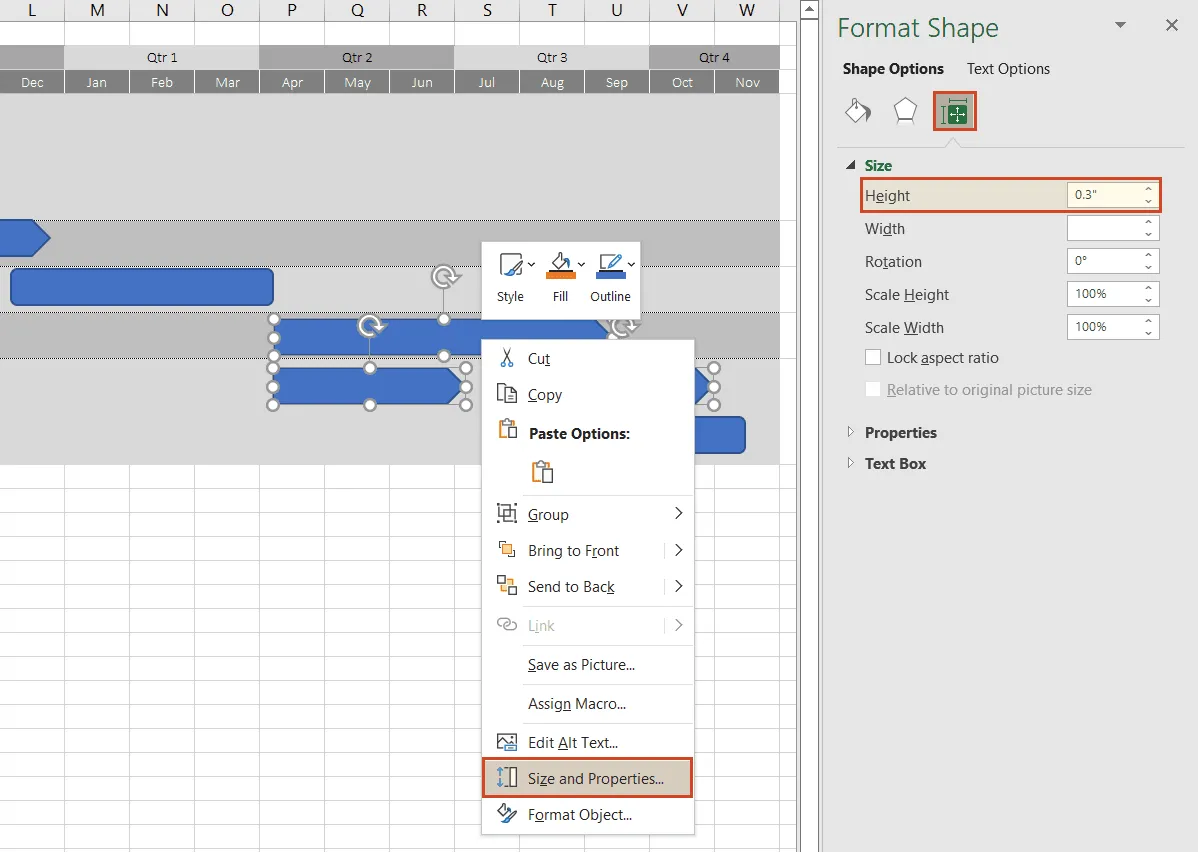
iv. Set the same height for multiple shapes.
Select all shapes while pressing and holding the Ctrl key, then right-click and choose Select and Properties from the menu that shows up next. In the Format Shape pane that appears on the right, go to Shape Option > Size, and set the height using the corresponding control button. For our roadmap, we’ve set the height of our shapes at 0.3 inches.
5. Add descriptions to shapes.
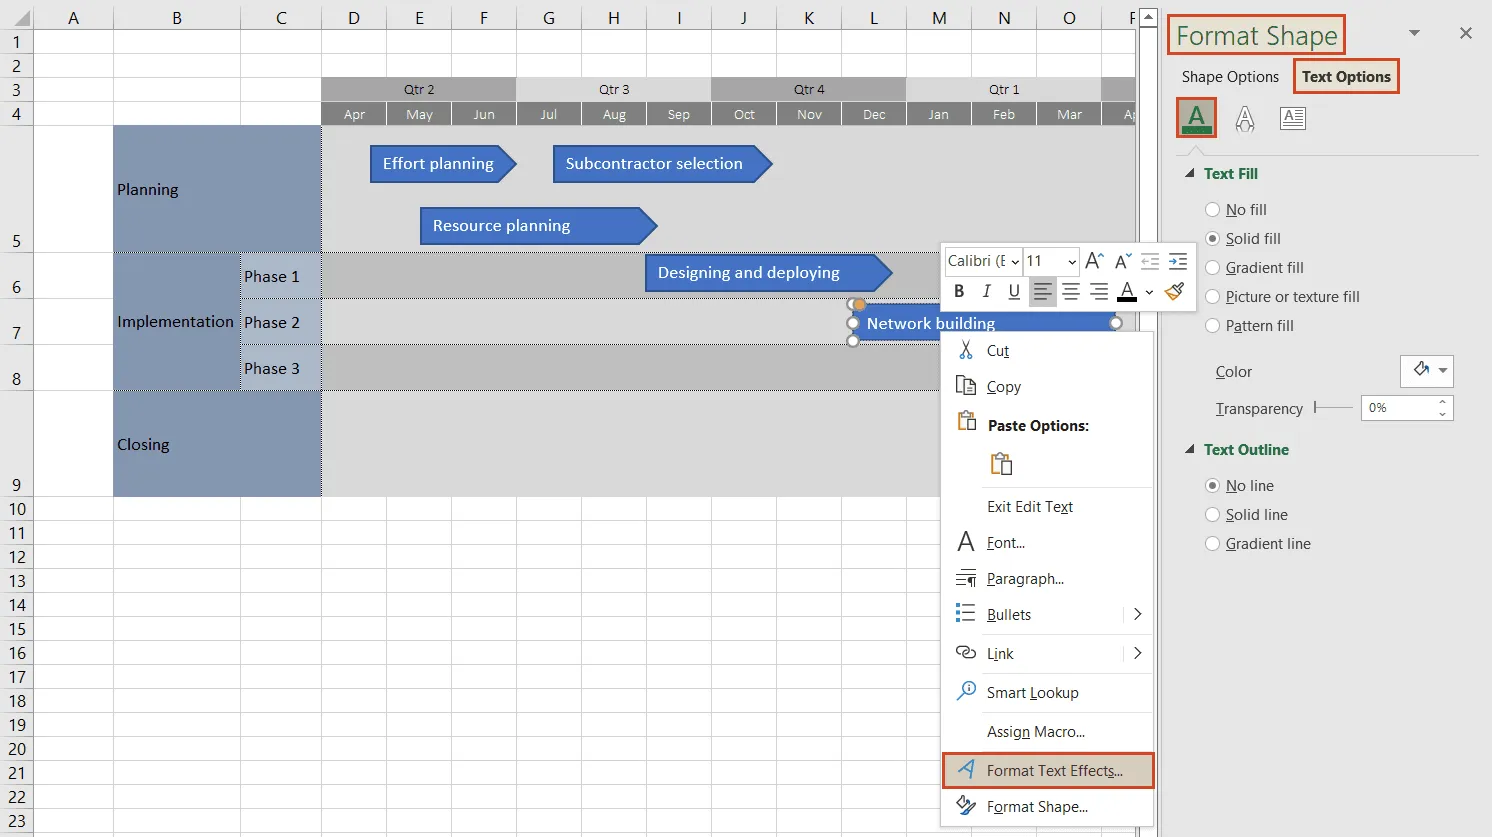
To add descriptions of the swimlane components to the shapes, simply double click any shape and start typing. You can style the text, add effects, change colors, change text box settings by right clicking any shape and selecting the option Format Text Effects.
6. Add milestones.
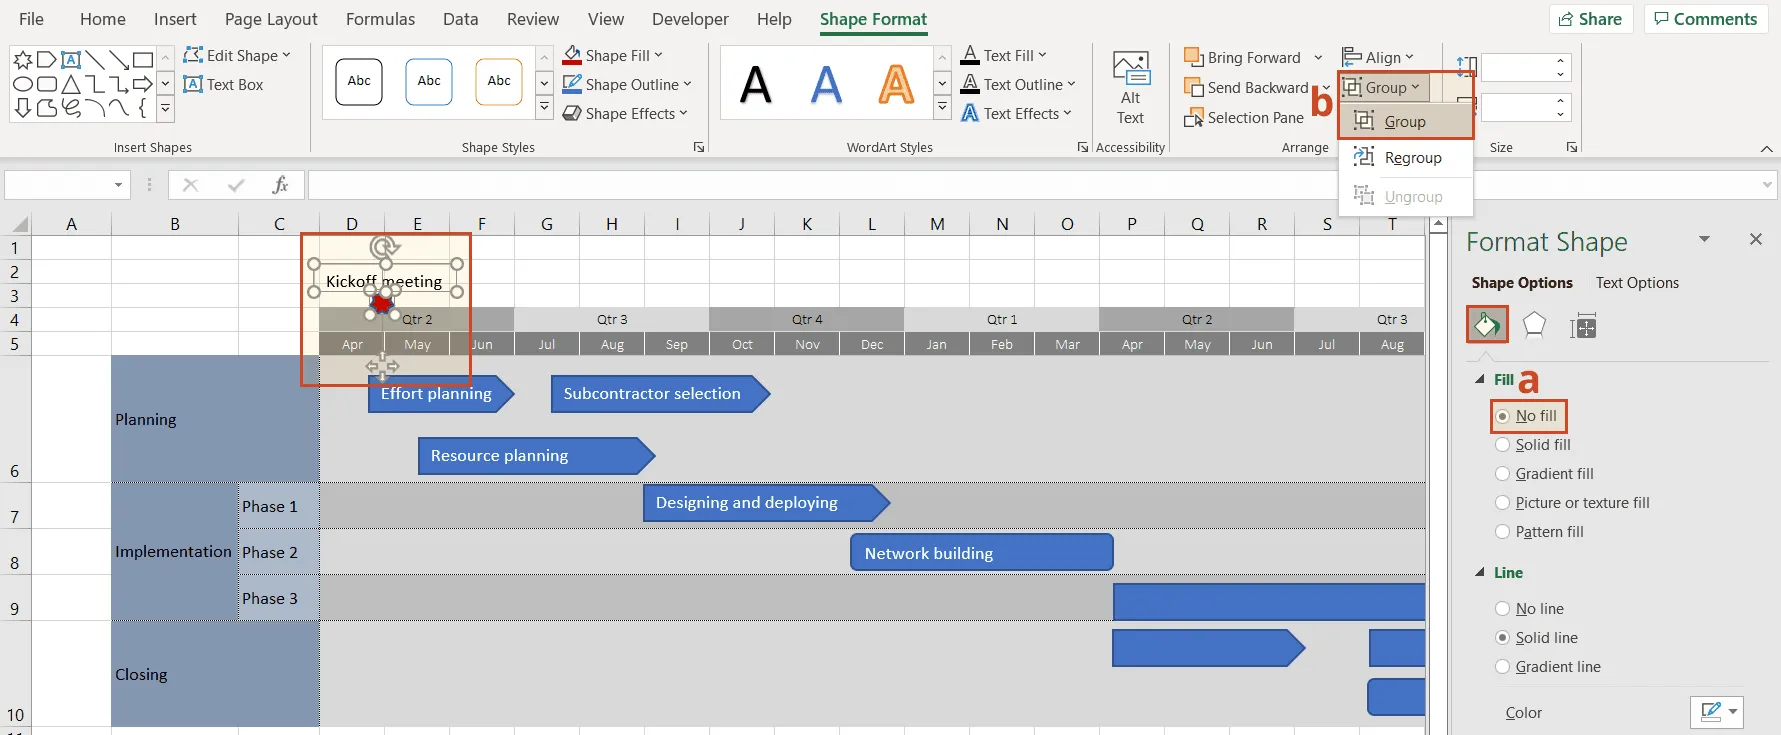
To add a milestone, apply the same actions used to insert a task-associated shape (as described in Step 4). To label the newly added milestone, go to Insert > Text Box, and then position the text box right above or under the milestone. Next, you’ll need to check these steps:
a. Make the text box transparent by right-clicking on the shape, accessing Format Shape > Shape Options > Fill, and checking the No fill option. This will prevent the text box from overlapping other shapes no matter where it’s positioned.
b. Group the milestone shape and its associated text box together to make sure you can simultaneously move them around. To do this, select both items and go to Shape Format > Group.
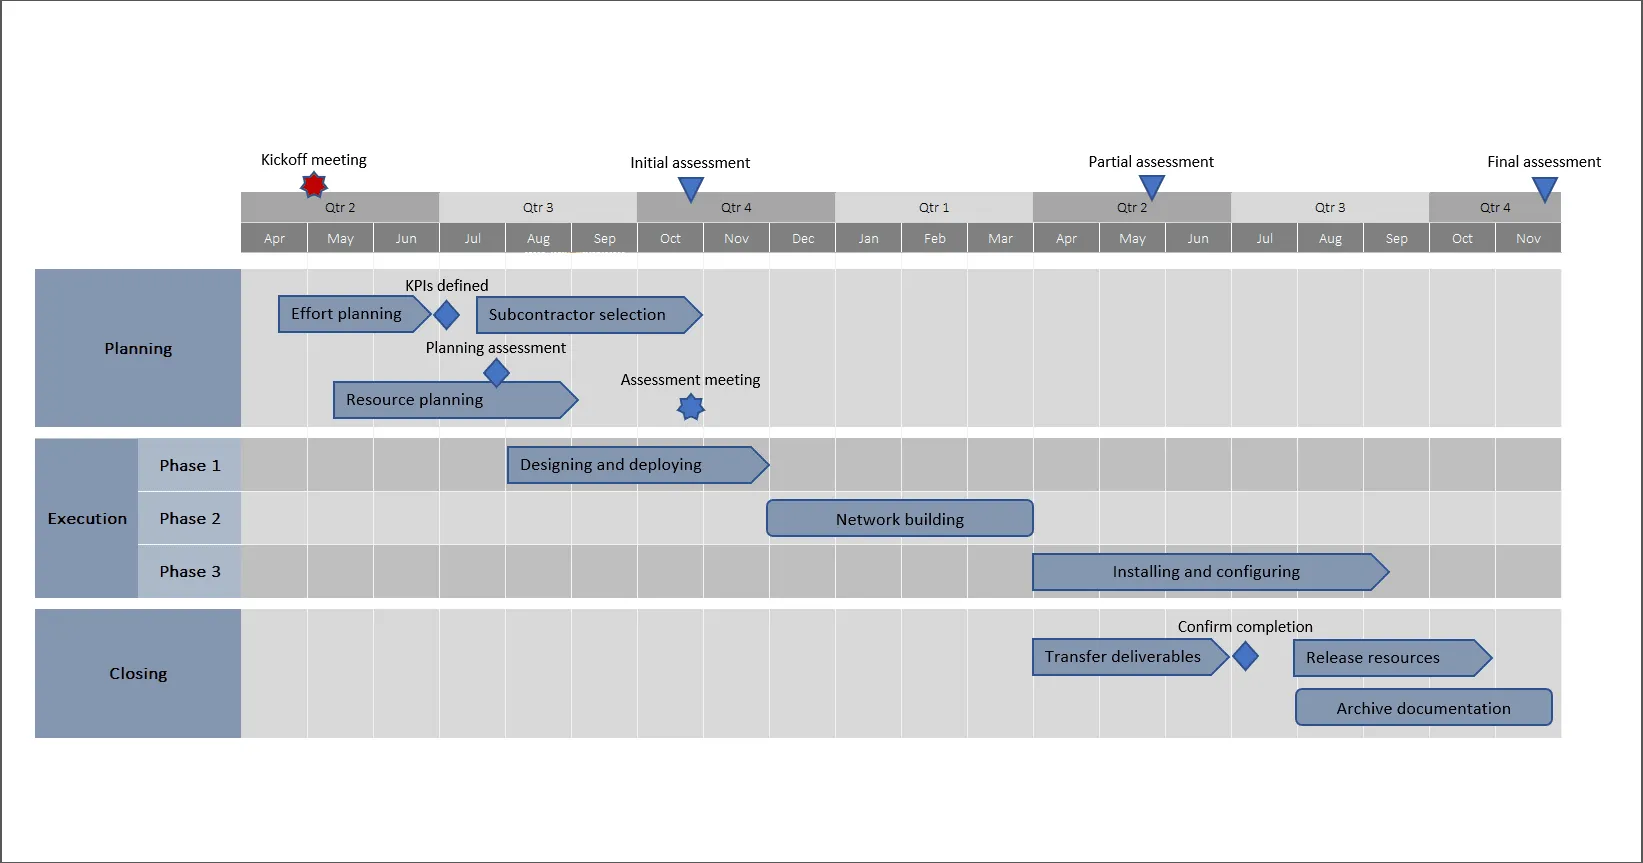
And here’s how our final Excel roadmap looks like after some further customization, adding more milestones, and changing shape and text colors:
To practice making roadmaps in Excel and jumpstart the whole process, download for free the Excel file we’ve used for this demonstration.
Get this free roadmap template
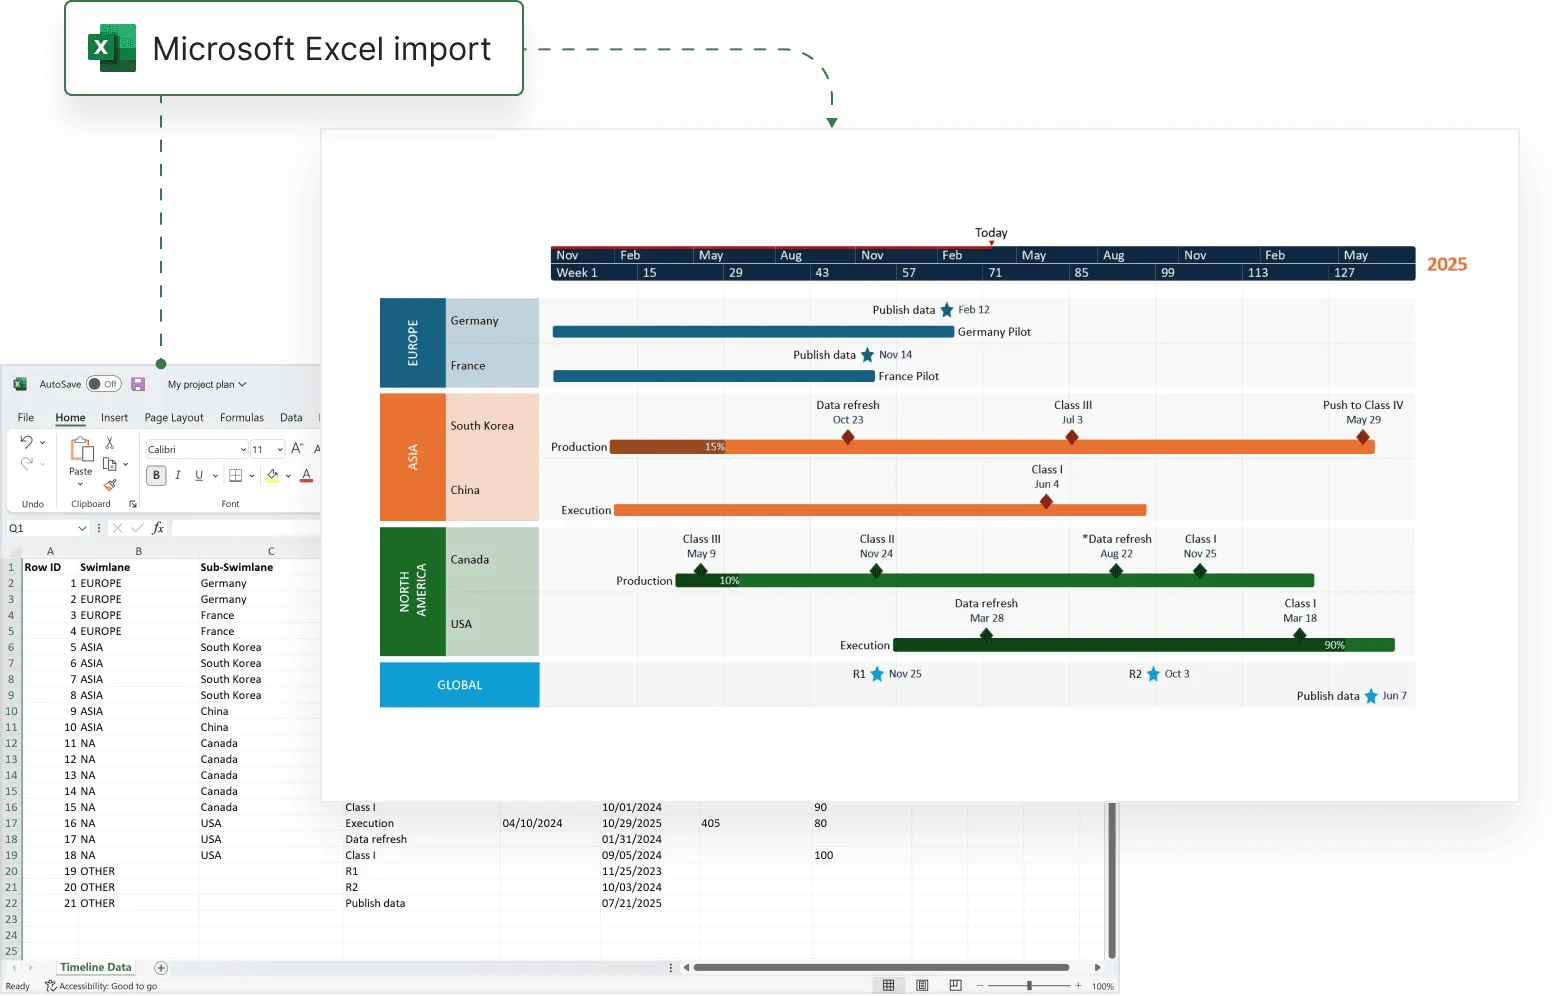
Automatically create a roadmap with Excel data
Manually building a roadmap in Excel can be time-consuming as it requires quite a bit of editing efforts. To make things easier and to save time, you can use Office Timeline, an intuitive add-in for PowerPoint that automates the process.
Offering a diverse range of ready-made roadmap templates to choose from, the add-in also lets you copy-paste or import data from Excel and other productivity tools. It is compatible with Microsoft Excel, MS Project, Smartsheet and Wrike, so you can easily integrate data from the most popular project software.
In the steps below, we will show you how to quickly build and customize a roadmap using Office Timeline.
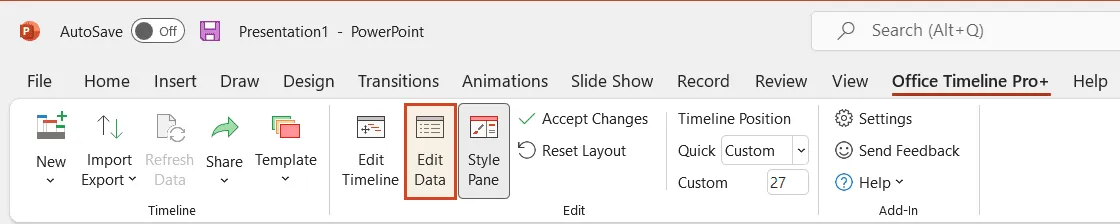
To begin, you will need to install the Office Timeline roadmap creator, which will add a new tab to the PowerPoint ribbon.
1. Launch the Office Timeline wizard.
a) Open PowerPoint, click on the Office Timeline tab, and then click the New icon.
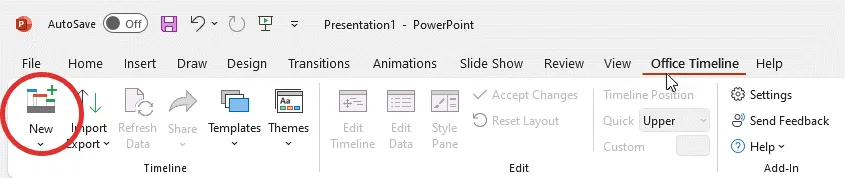
This will open a gallery that provides a variety of styles and templates you can choose from for making a roadmap in PowerPoint.
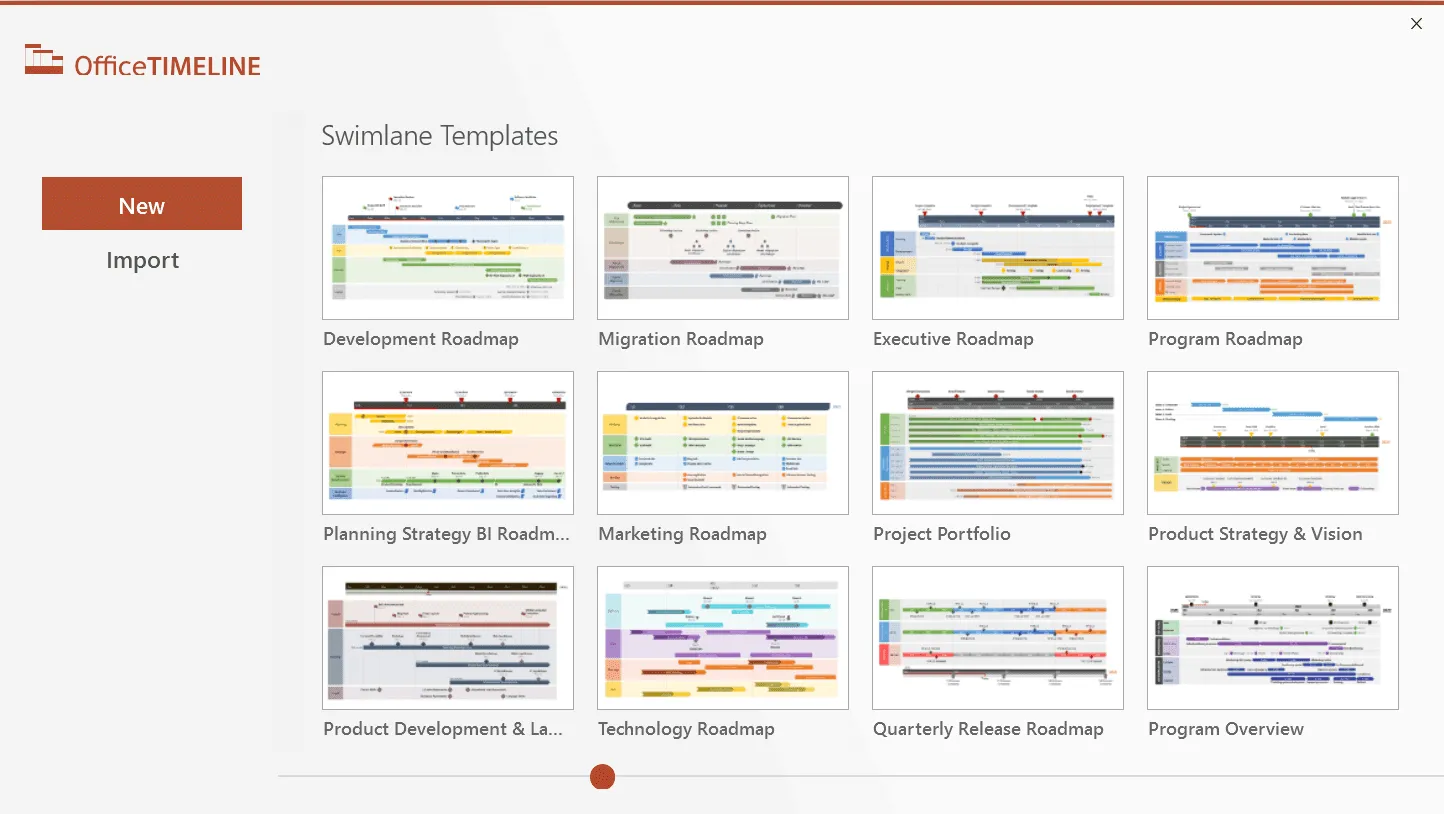
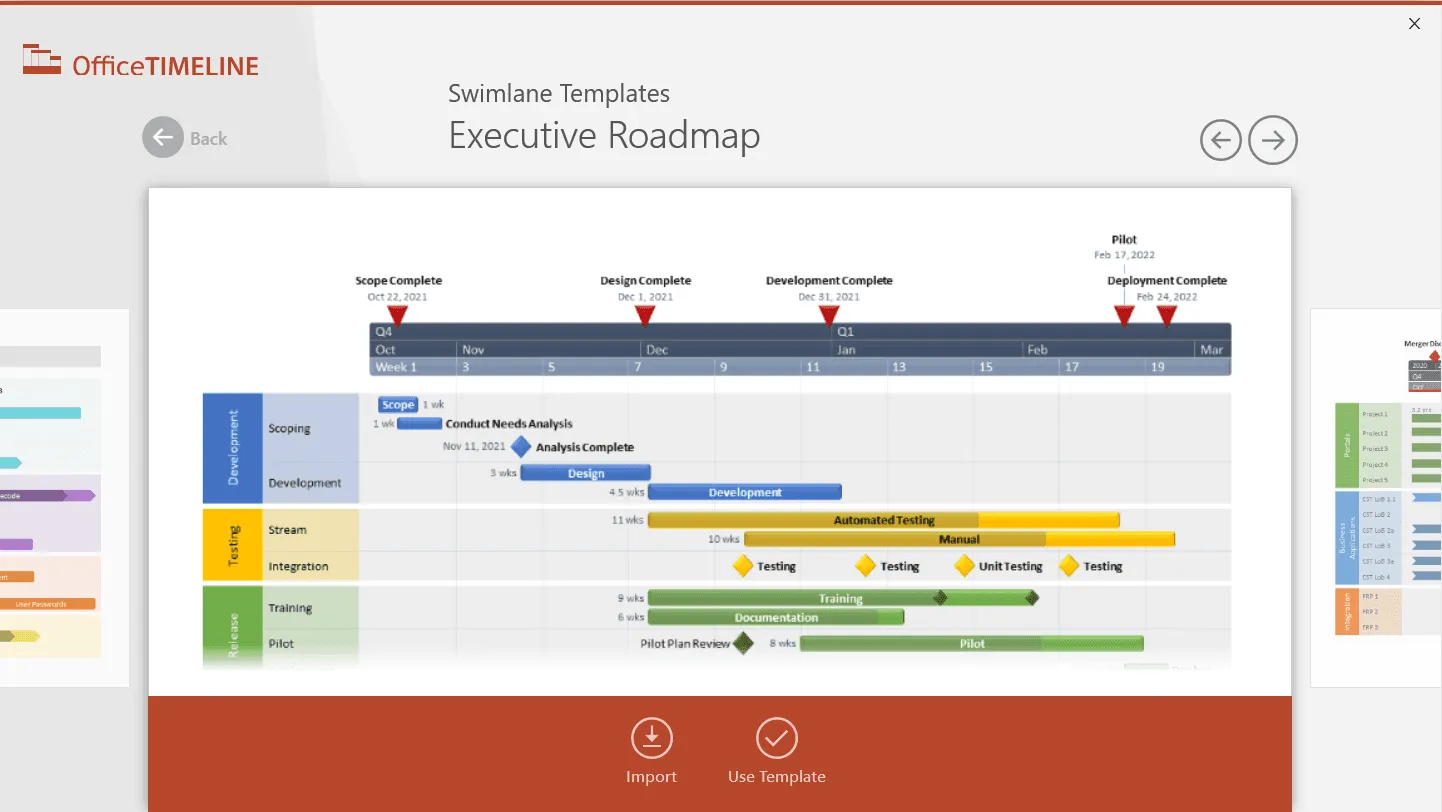
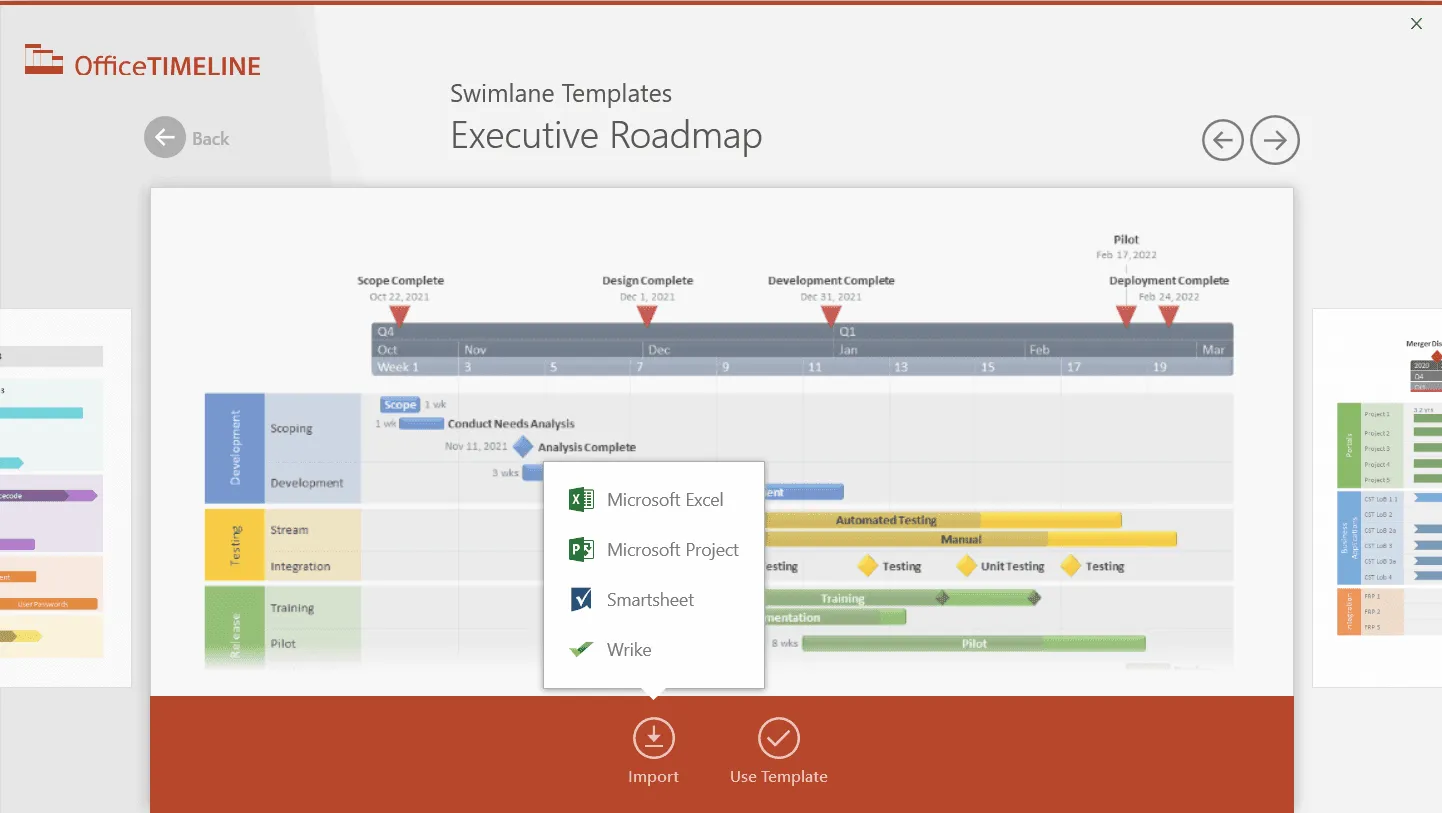
b) Use one of the pre-designed templates. To select your preferred sample from the gallery, double-click on it. This will open a preview window where you need to click on Use Template to proceed. For this demonstration, we chose the Executive Roadmap template.
2. Paste or import data.
Once you’ve selected your preferred template, you will be taken to the add-in’s Data Entry wizard. Here is where you can enter your tasks and dates manually or copy-paste them from an existing Excel file.
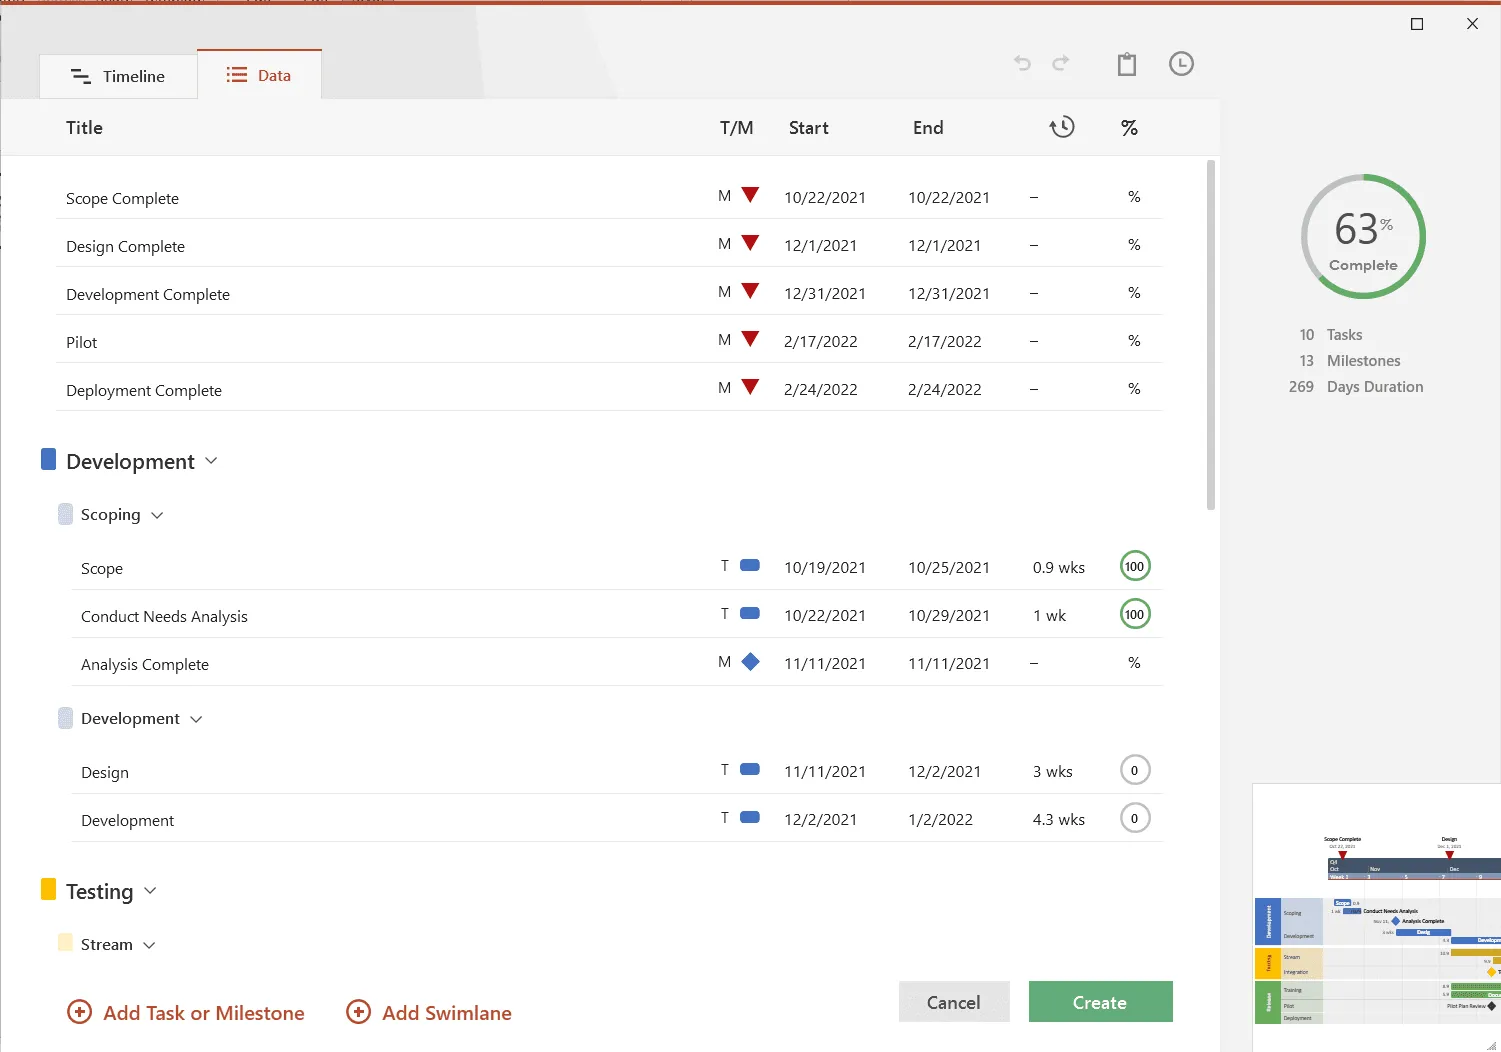
To bring in your project data, click on the Edit Data button that you can find in the Office Timeline ribbon.
If you prefer to import your data from an Excel table directly, rather than copy-paste it, click on the Import button in the preview window and follow the steps from the Import from Excel wizard, as shown in this quick tutorial.
When your data is ready, click Create to finalize this stage. A new roadmap slide will be instantly generated in PowerPoint, the preview of which is displayed on the right side of your screen.
3. Style to perfection.
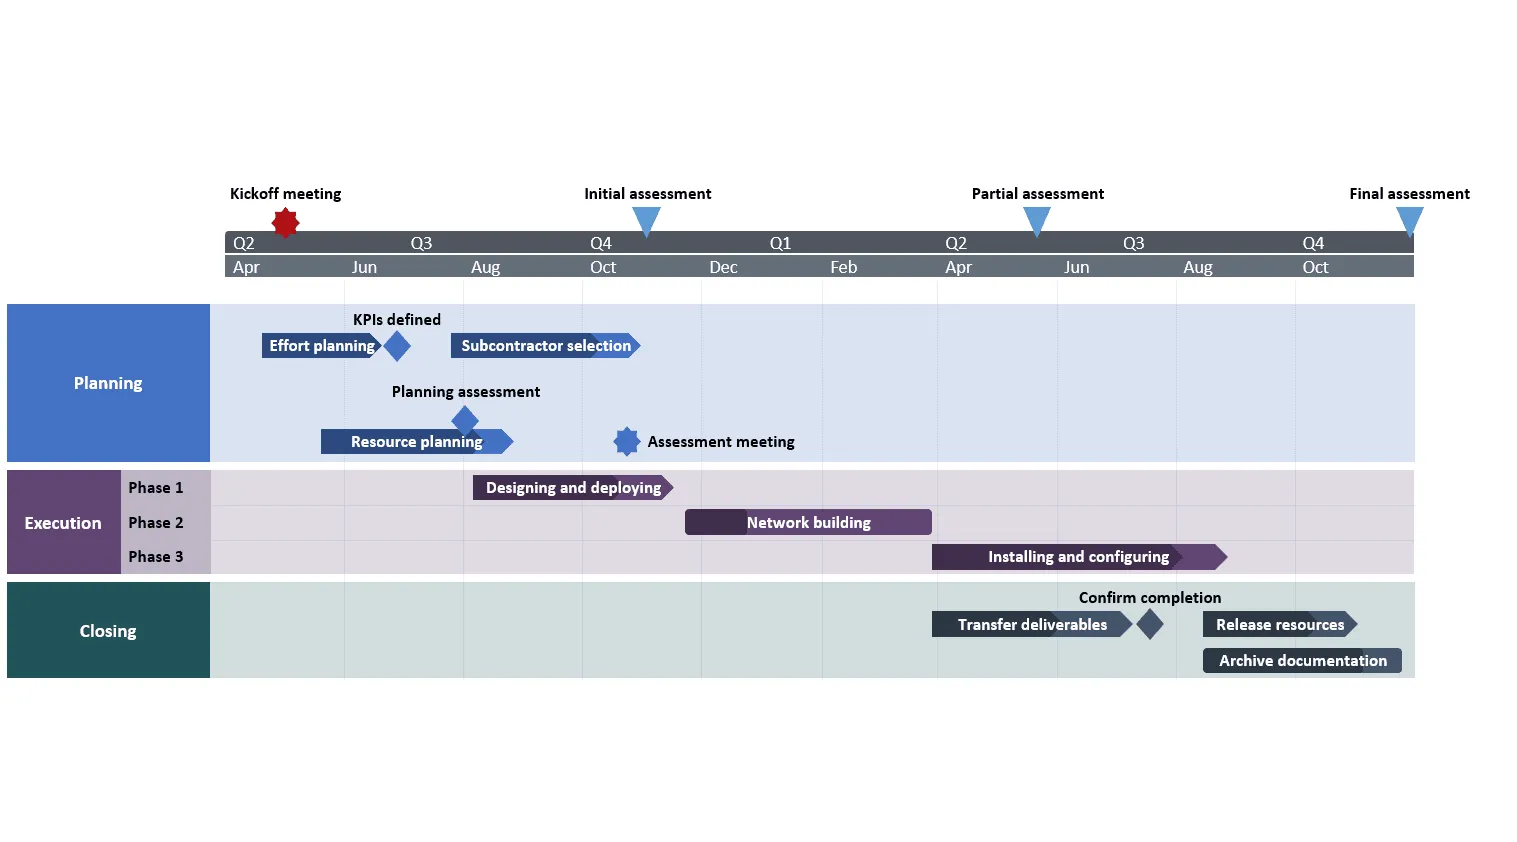
Once created, your roadmap can be edited, styled or updated automatically using the Office Timeline controls in the dedicated menu. You can add or edit data at any time, format fonts and shapes, change colors and positions, or add other timescales (months, quarters etc.). In our roadmap example, we’ve also simplified the roadmap a bit, keeping a two-tier timescale and one swimlane with sub-swimlanes.
Finally, you can get a PowerPoint roadmap that looks similar to this:
To help you get used to creating roadmaps with just a few clicks, we’ve included below our PowerPoint roadmap slide as a free downloadable template that you can easily customize using Office Timeline.
Get this free roadmap template
FAQs about making roadmaps in Excel
Yes, you can find some roadmap templates in Microsoft Office’s online library. We checked them out for you and found some pluses and some minuses. On one hand, they’re readily available – all you need to do is open Excel and access File > New > Search, then type “roadmaps” in the search box. On the other hand, we concluded that, in spite of the considerable time spent on customization, the final result was not very concise nor the looks that impressive. Moreover, there’s no automation when working with these templates, which means that you need to update the roadmap by hand every time your project changes.
As a more time-efficient alternative to building clear, professional-looking roadmaps, we recommend that you try out the free Office Timeline roadmap creator. The tool automatically turns your data into visuals that are rich yet easy-to-understand at a glance, and greatly simplifies the customization work through its intuitive controls and functionalities, thus saving you the hassle.
Microsoft Office offers several unsophisticated roadmap template options in their online library. If you need more complex roadmaps, with specific designs for various purposes and industries, browse our roadmap templates collection.