Flowcharts help you visualize and understand processes. If the process requires the collaboration of multiple departments or teams, the chart will get complex and you’ll need to clarify who does what with the help of a swimlane diagram, also known as a cross-functional flowchart. Swimlane diagrams group process steps into parallel rows or columns to show how they are assigned to specific step owners.
If Microsoft Excel is the tool you’ve chosen to create a basic swimlane diagram, you can do this by using the Insert > Shape option to visually represent actions in a table. However, this method requires heavy customization work and can prove quite time-consuming.
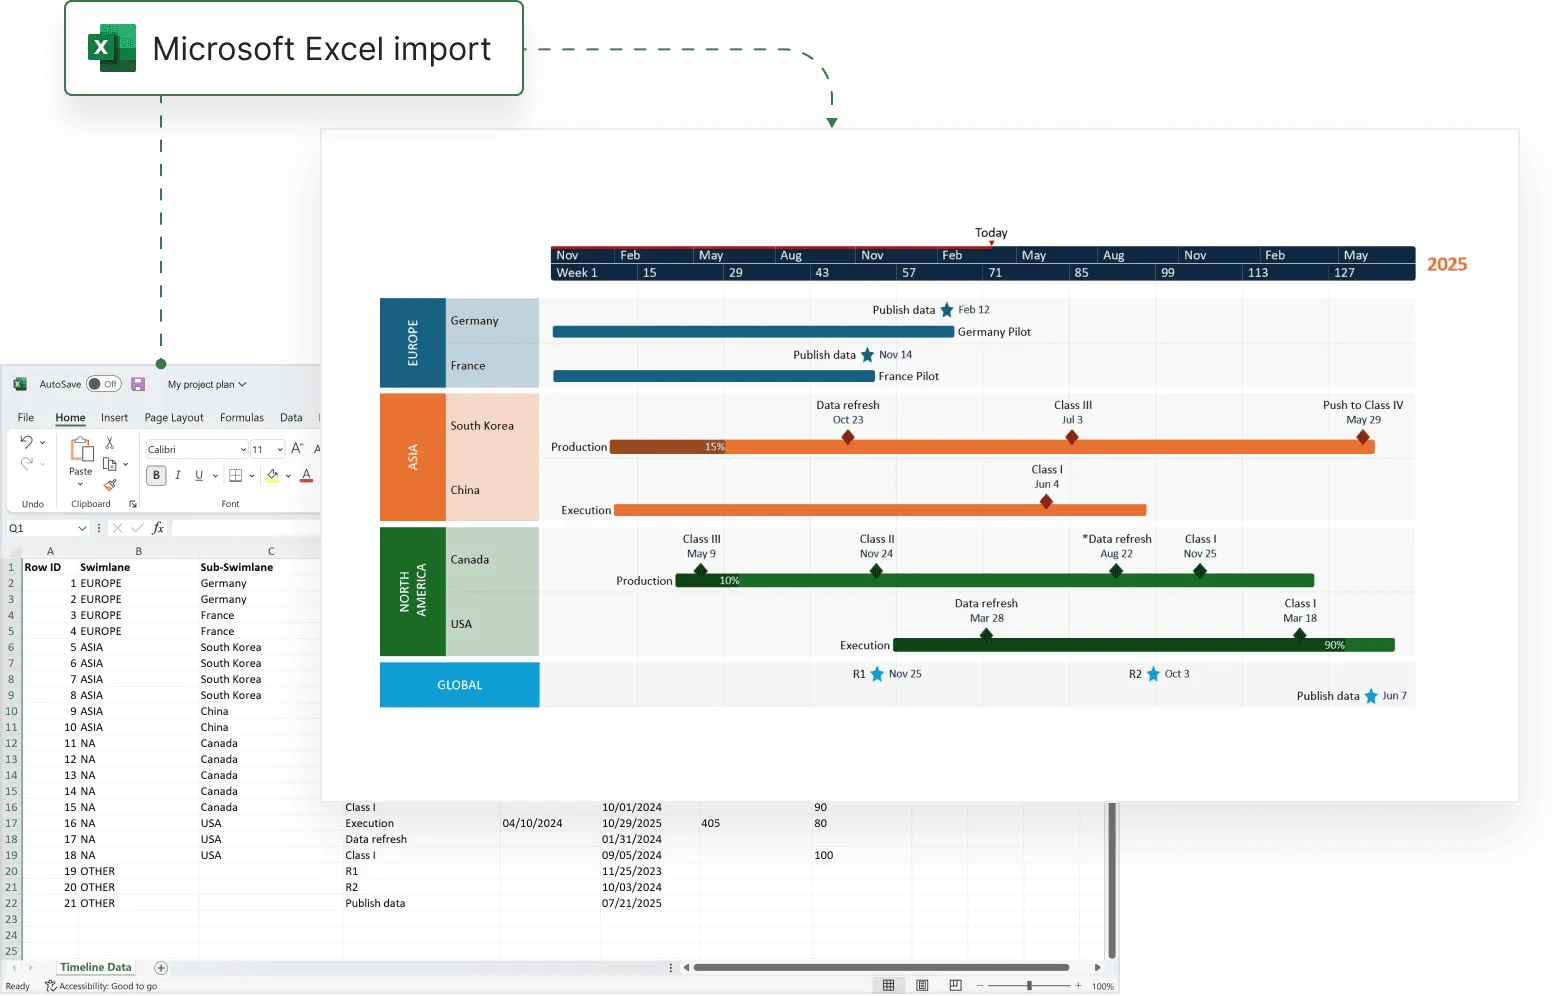
The simple and fast solution for producing professional-looking swimlane diagrams is to automatically have your Excel data imported into PowerPoint and turned into a stylish visual in seconds with the help of a powerful extension called Office Timeline.
On this page, you can find instructions for each of these two options in separate sections. First, we will give you step-by-step instructions for making swimlane diagrams in Excel. Then, we will show you how you can instantly create a presentation-ready swimlane diagram in PowerPoint starting from your Excel data.
Which tutorial would you like to see?

How to manually make a swimlane diagram in Excel
1. Create swimlanes.
In order to group process steps by owner, you’ll need to place them in parallel rows. These will be the swimlanes in our diagram. Thus, each swimlane will link a certain step owner (or team or department) with the process steps they need to perform. To do this, we created a two-column table: one column for the step owners and one column for the process steps. Our table will have as many rows as owners involved in the process we want to map out.
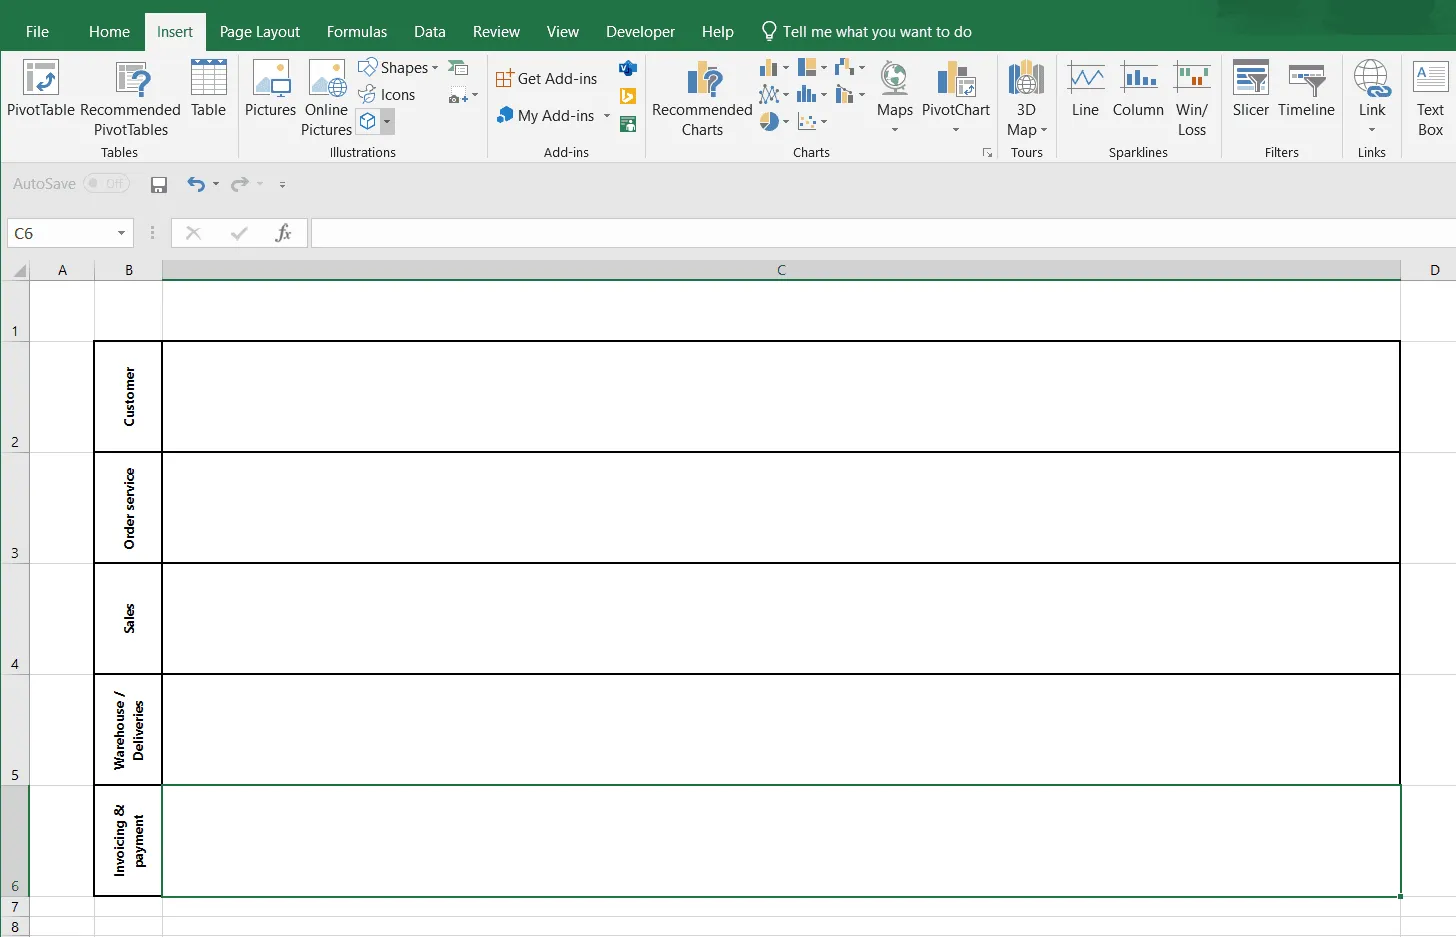
Tip: To change text orientation within the swimlane title sections, right-click on the cells, then go to Format Cells > Alignment > Orientation and set the orientation to 90 degrees.
2. Build a flowchart.
After creating the swimlanes, we need to build our flowchart to illustrate the process steps assigned to each step owner.
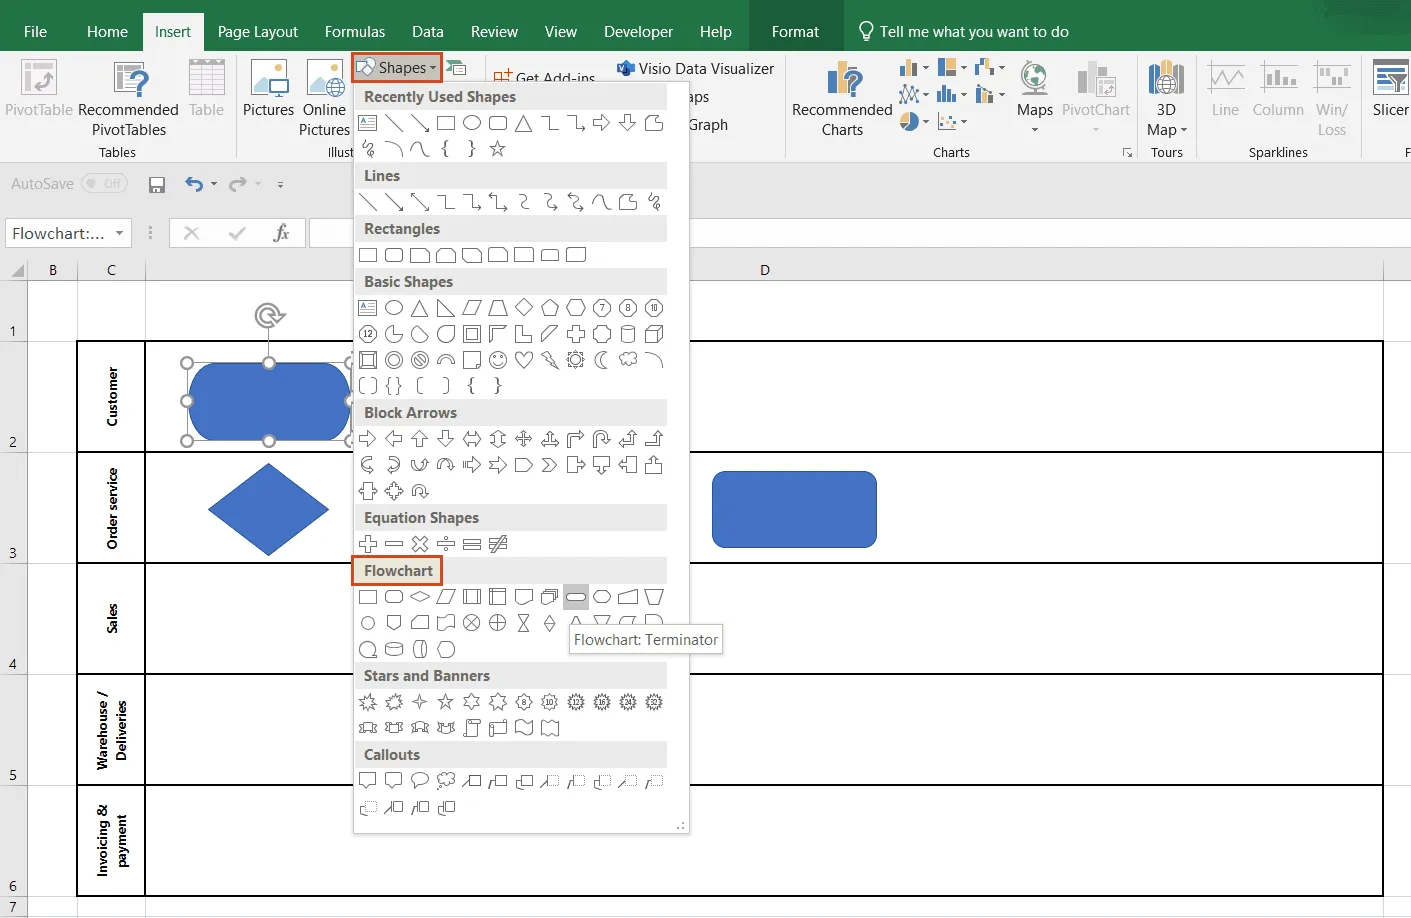
a) Include shapes as project steps.
On each swimlane, insert shapes to visually represent the project steps assigned to each step owner. To do this, go to Insert > Shapes > Flowchart and select shapes as needed.
When choosing the shapes, it is recommended that you follow flowchart conventions: Per current ISO standards, flowchart shapes have different roles. For instance, the arrow shows the order of steps or operations, the “Process / Activity” shape (rectangle) represents a step / operation, the “Terminal / Terminator” shape (oval) is set at the beginning and end of a process, etc.
Tip: To check and adjust shape size, select the shape, and then access Format > Size.
b) Insert connectors (arrows).
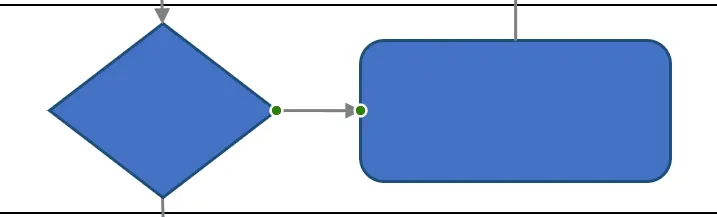
To convey the flow direction of the process steps, we need to connect the shapes (steps) using arrows. For this, access Insert > Shapes and select the arrow shape. Draw an arrow from one shape to another and move the connecting points until they turn green. Thus, you will make sure that the connecting arrows stick to the shapes if you need to change the position of the shapes later.
3. Customize your swimlane diagram.
a) To change shape color, go to the Format tab, where you’ll find options to customize colors, fonts, and sizes of your flowchart shapes. Select the shape to be formatted, then change its color or outline style using the tools in the Format tab (Shape Fill, Shape Outline, etc.). We chose to color shapes according to their roles (same role, same color) to make processes easy to track at a glance.
b) To add text to a shape, just double-click on it and start typing. You can change the font, size or color by selecting the text and using the size and style options in Home > Font.
c) Add text boxes near the “Decision” shape, which is the diamond shape, to indicate the path of the process. Here, you’ll need to insert short words like yes/no or true/false, since the “Decision” shape will usually contain a yes/no question or a true/false test. For this, go to Insert > Text > Text Box and place the text box next to the diamond shape. Customize font in Home > Font.
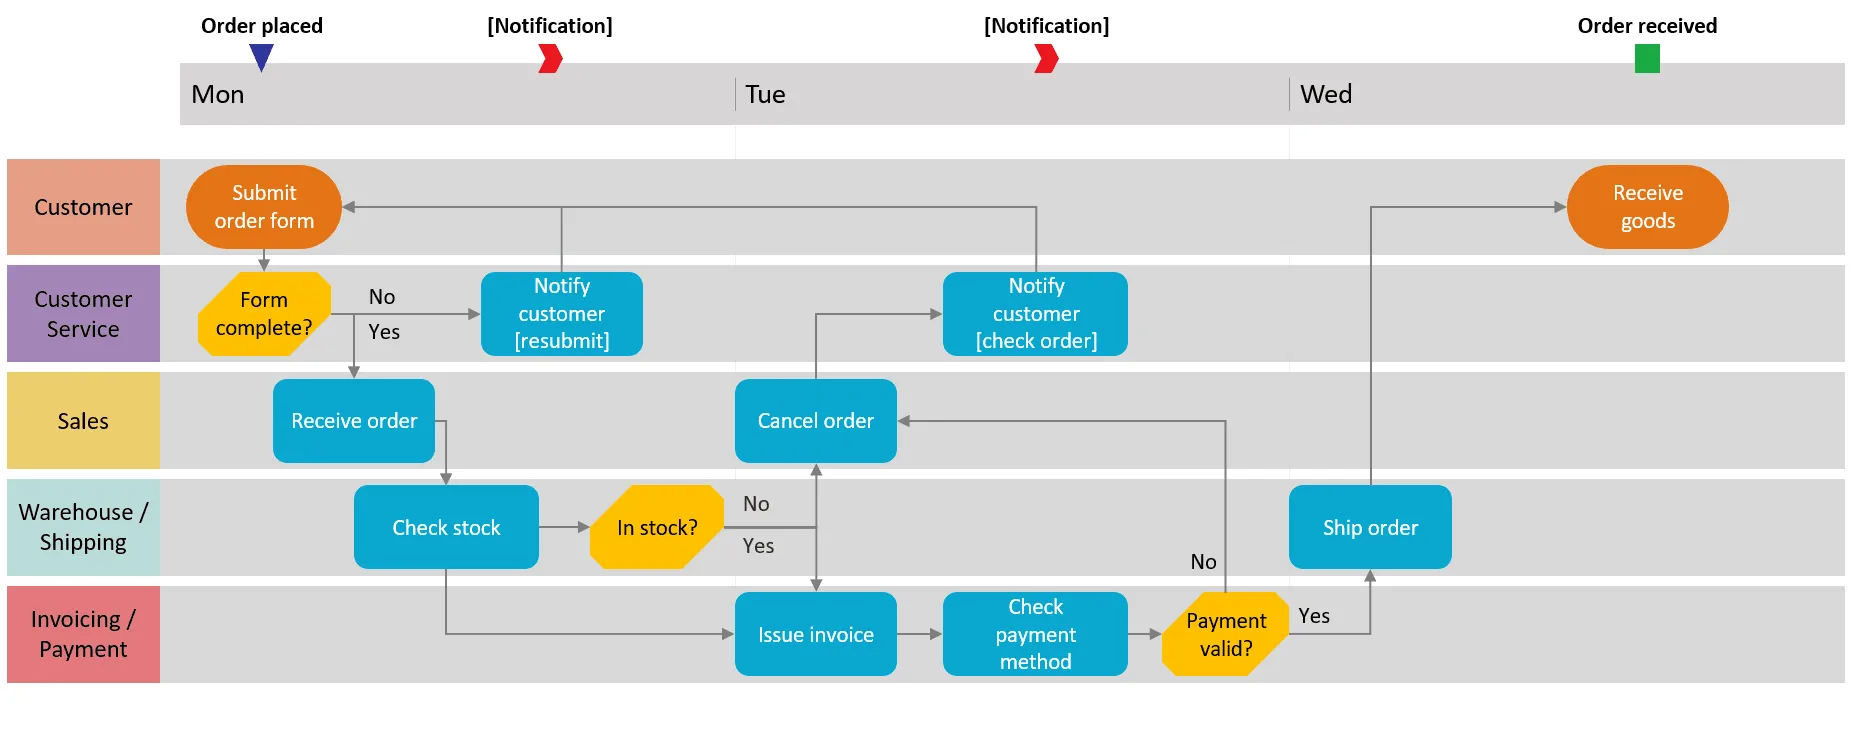
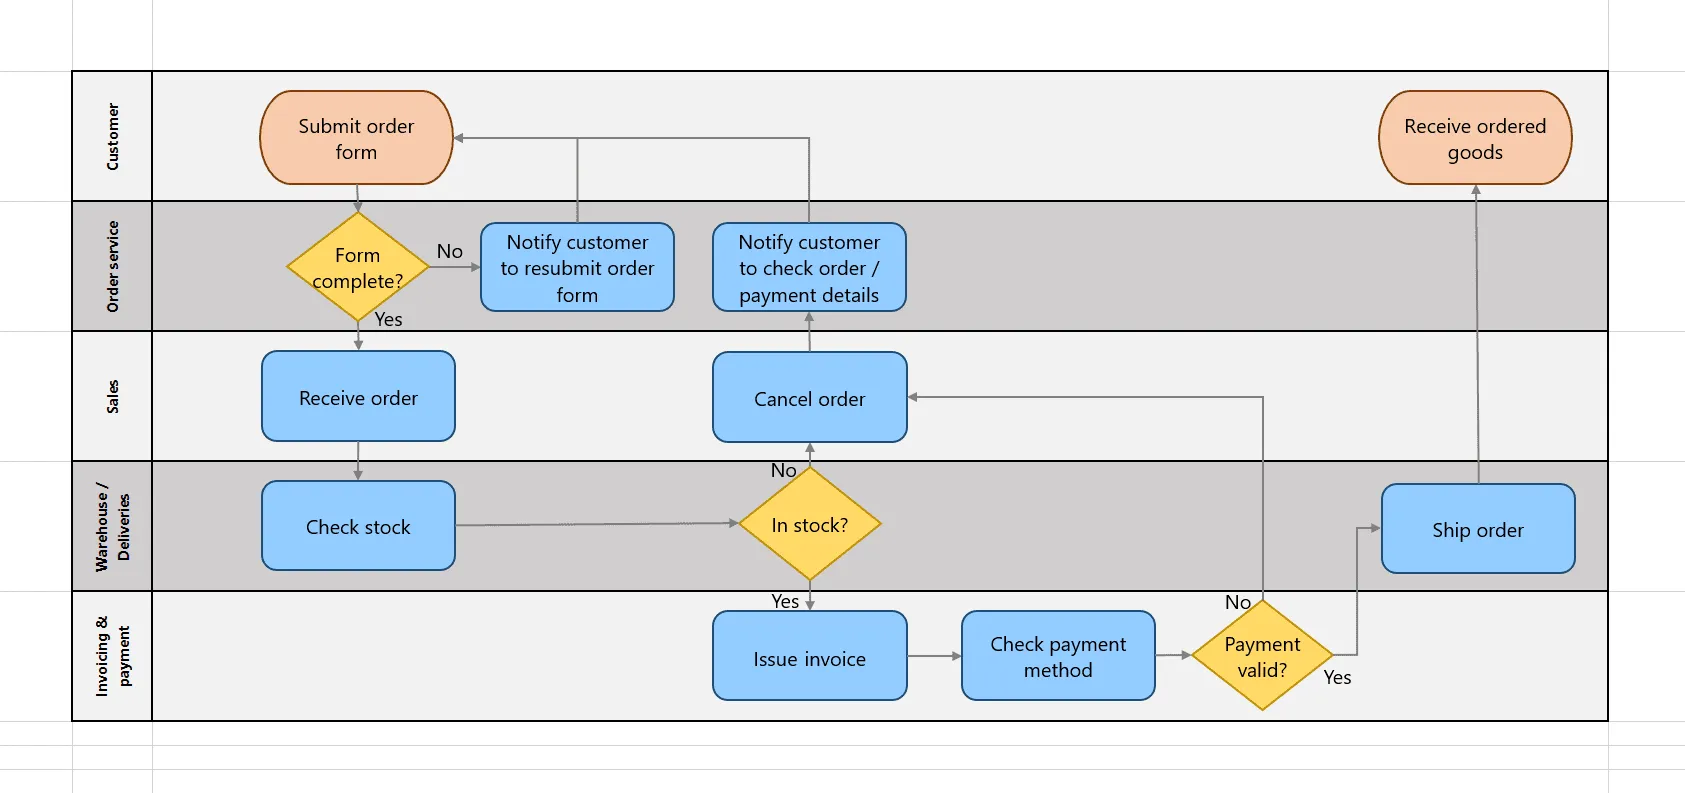
And here’s how your Excel swimlane diagram could look like after a few edits:
Download manual Excel swimlane diagram file
If you’d like to use the swimlane diagram created in this guide as a template to help you move faster, you can download the file below, free of charge.
Get this free swimlane diagram template
How to automatically make a swimlane diagram in PowerPoint
Creating a basic swimlane diagram in Microsoft Excel is not only a tedious manual activity, but it can also prove quite time-consuming if you need to produce a high-level, customized flowchart for executive presentations.
Our suggestion for a faster, more professional-looking output is to use a swimlane diagram tool like the Office Timeline add-in for PowerPoint. With Office Timeline, you can choose to enter your data manually, copy-paste it, or import it from Excel to PowerPoint automatically. As a result, you’ll get an auto-generated, clear swimlane diagram that can be used as a presentation-ready PowerPoint slide or saved as an image.
Not only can you customize this visual as often as needed, but you can also include a timeband to illustrate an accurate time sequence of your process steps. What’s even better, the add-in offers a rich gallery of customizable templates to choose from and directly populate with your own flowchart data.
Let’s see below the basic steps required to automatically make a swimlane flowchart with just a few clicks, using the PowerPoint add-in.
Start by installing the free trial of Office Timeline. This will add a separate tab to the PowerPoint ribbon.
1. Choose a swimlane template and populate it with your flowchart data.
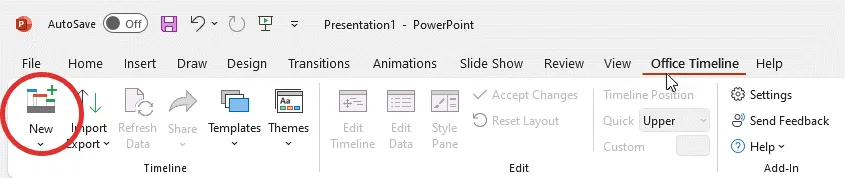
a) Go to the Office Timeline tab on the PowerPoint ribbon and click on New.
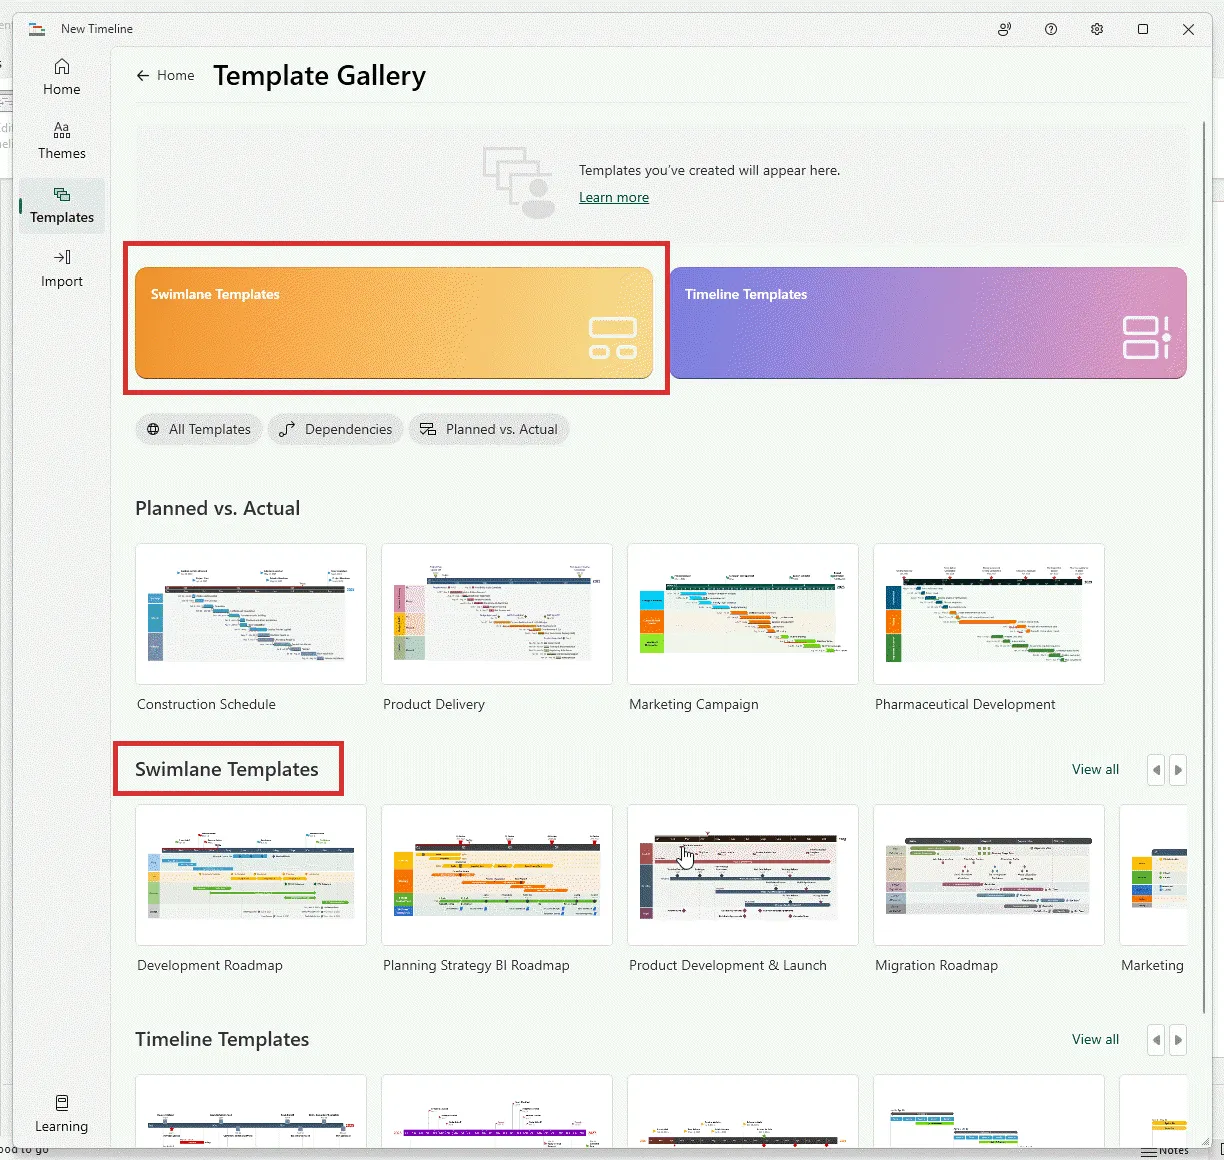
A template gallery will open, where you can scroll to the Swimlane Templates section to choose a preferred style.
Double-click on the chosen template and select Create timeline in the preview window to open the Edit Data wizard.
b) In the Edit Data wizard, enter your tasks, milestones, and their due dates either manually, or copy-paste them from another file. Next, you can start customizing your data entries by changing tasks shapes or colors, for instance.
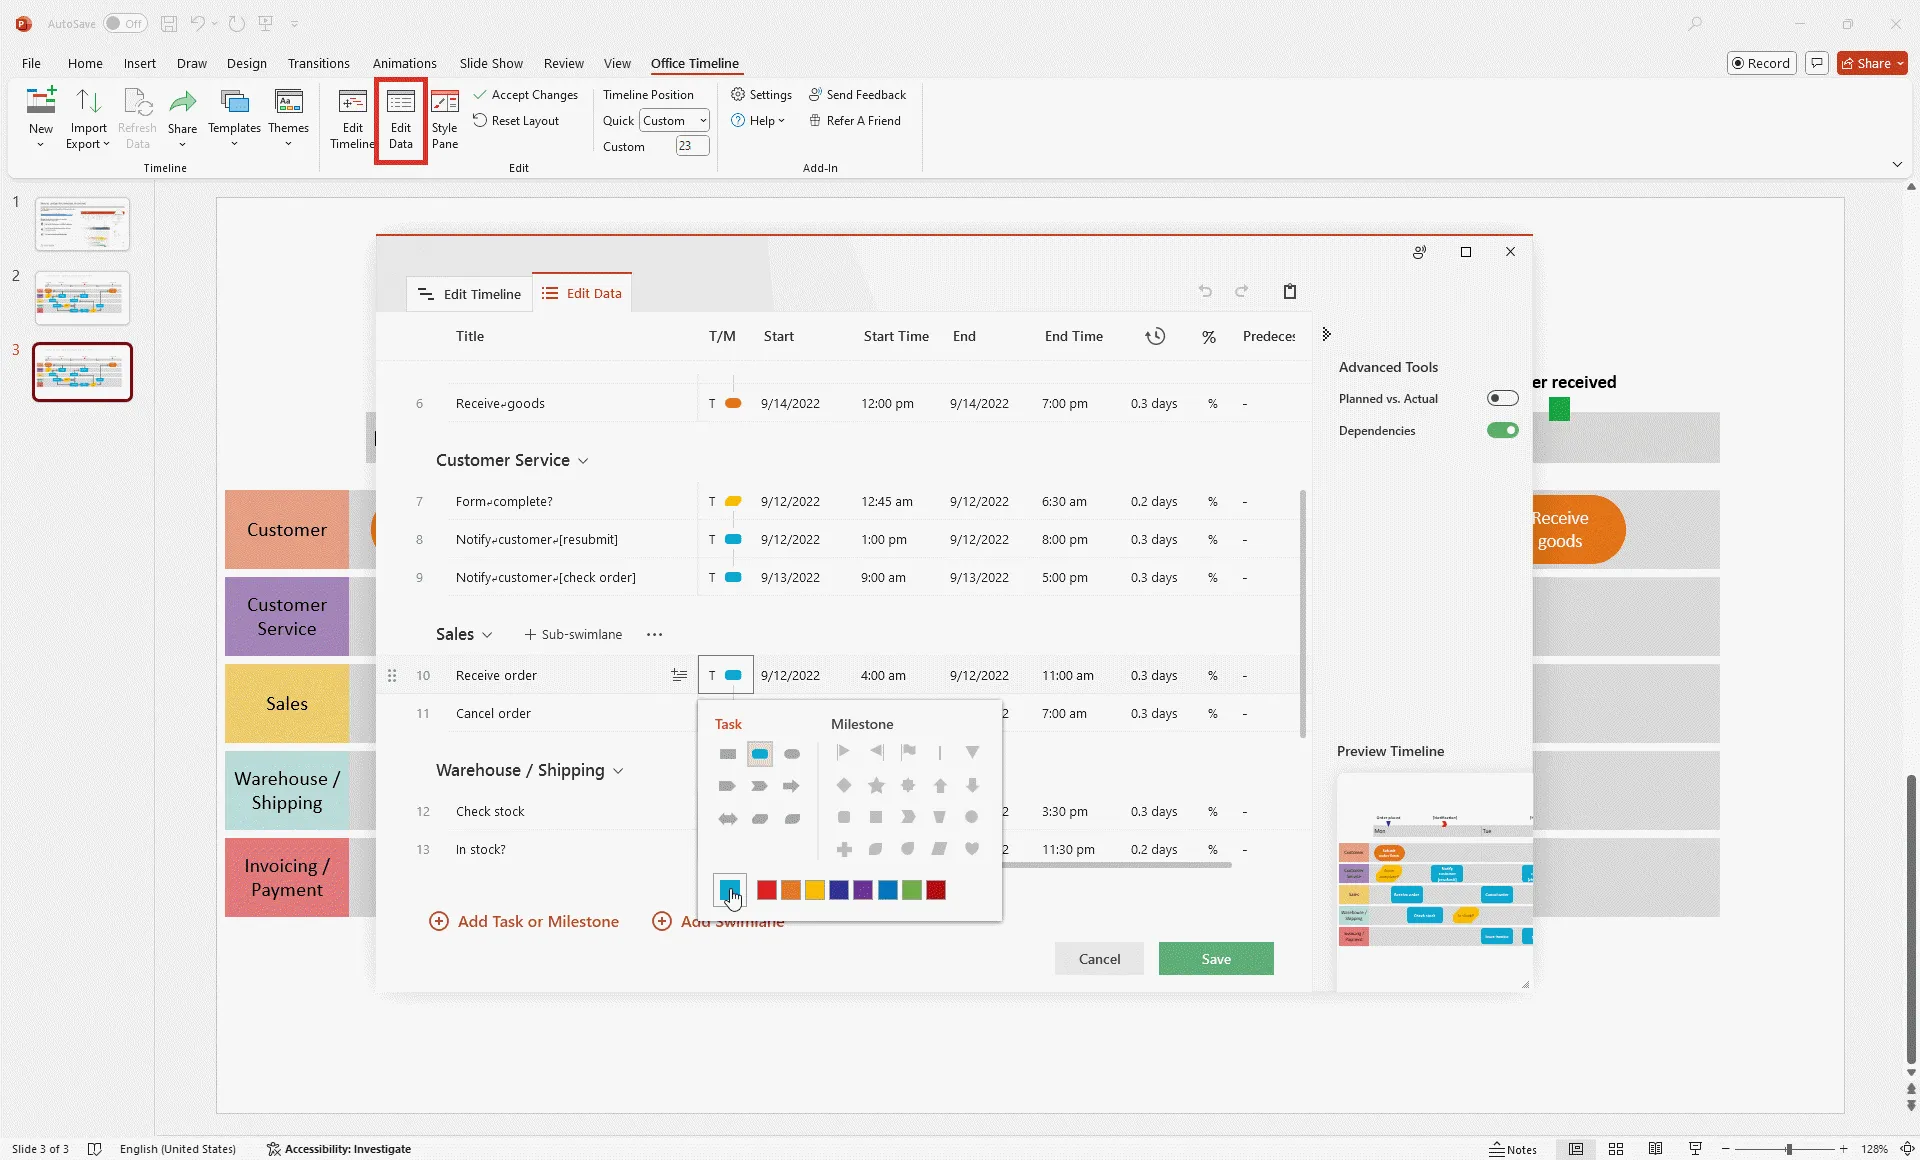
In our example, we have chosen the task formats per flowchart rules (i.e., a rectangle is “Process / Activity” and stands for a process step, an oval represents a “Terminal / Terminator” shape and is placed at the start and end of a process or program, etc.) to make our swimlane template look more like a cross-functional process map.
When ready, click the Save button. You’ll see a new swimlane diagram slide being instantly generated in PowerPoint.

As you can see at the top of the image above, the newly auto-generated swimlane diagram also features a timescale that helps you accurately define the time reference for each of your process steps. What’s more, you can add milestones to this horizontal band to clearly mark important stages along the overall process and convey extra details of the big picture.
2. Add connectors to illustrate the process flow.
Now that you have chronologically arranged the process steps within their corresponding owner-associated swimlanes, you’ll need to show the direction of the process flow. For this, add arrows to connect the flowchart shapes. Use the Insert > Shapes option on the PowerPoint ribbon. Select the arrow shape and draw an arrow, moving around the connecting points until they turn green to make sure they stick to the connected shapes.
If you need further instructions on how to use shapes and connectors in PowerPoint, find them in the article related to adding dependencies using the Office Timeline add-in.
Once you’ve built your swimlane diagram, you can easily restyle or update it using Office Timeline’s rich features. For instance, you can add new tasks or milestones, move them around, remove items, change colors or descriptions.
After some styling and customization, you can get a swimlane diagram that looks similar to this:

Download auto-generated PowerPoint swimlane diagram slide
Click the link below to download this PowerPoint swimlane diagram for free and easily use it as a template for your process-mapping needs.
Get this free swimlane diagram template
FAQs about making swimlane diagrams in Excel
Here are the answers to the most frequently asked questions on how to make a swimlane diagram in Microsoft Excel.
To make a swimlane diagram in Excel, follow the steps below:
- Create swimlanes. Start by setting up a two-column table (for swimlane title and swimlane body, respectively) and then highlight its rows with alternating colors, for better demarcation between swimlanes.
- Build a flowchart. For this, you need to:
- Insert shapes to represent project steps.
- Add connectors (arrows) between the swimlane-associated shapes to show the direction of the process flow.
- Customize your swimlane diagram. Change style and colors as you like and label your swimlane items by typing directly into the shape, after you double-clicked on it.
These steps can help you create a basic swimlane chart in Excel by hand. But if the process is taking up too much time and effort, you can try using an automated swimlane diagram tool like Office Timeline and transform your Excel data into a polished swimlane slide.
Unfortunately, there are no native, ready-to-use swimlane diagram templates available in Microsoft Excel. If you go to File > New and type “swimlane”, “cross functional” or just “flowchart” into the search box at the top, you’ll get a single result - Process Map for Cross-Functional Flowchart. This is a quite simple swimlane flowchart template created in Visio that can be used in Excel. However, for the template to suit the specifics of your data, you will most likely need to do considerable customization work such as adding/moving boxes, adjusting colors and shapes, and trying out various layouts.
To save time and get access to a more varied range of pre-formatted samples, browse the free swimlane diagram collection from Office Timeline and choose a preferred template that you can quickly customize and use for professional executive presentations.
Moreover, you can use Office Timeline’s powerful automated interface to quickly create even more swimlane diagram samples with a few clicks. Simply enter your information in the add-in’s intuitive data entry wizard, make a few styling choices and click Create. A professionally-designed visual will be instantly generated for you.