Microsoft PowerPoint enables users to create a basic timeline that they can manually adjust and restyle to fit their needs. The result is a simple graphic fit for presentations to clients or executives, but not quite flexible enough for those who need to show more accurate details or update the timeline regularly.
If you need to regularly create and update timeline slides for high-level presentations, a simple and fast solution would be to use a timeline maker for PowerPoint that automates the process. On this page, you will see both the manual and the automatic way to make a timeline in PowerPoint.
Which tutorial would you like to see?
How to manually make a timeline in PowerPoint
1. Create a basic timeline graphic.
If you prefer to manually build a PowerPoint timeline, you will need to use PowerPoint's SmartArt tools to create a basic visual and then adjust that graphic to make it look better for presentations. Here are the exact steps:
a) Create a new presentation or open an existing one and add a new blank slide.
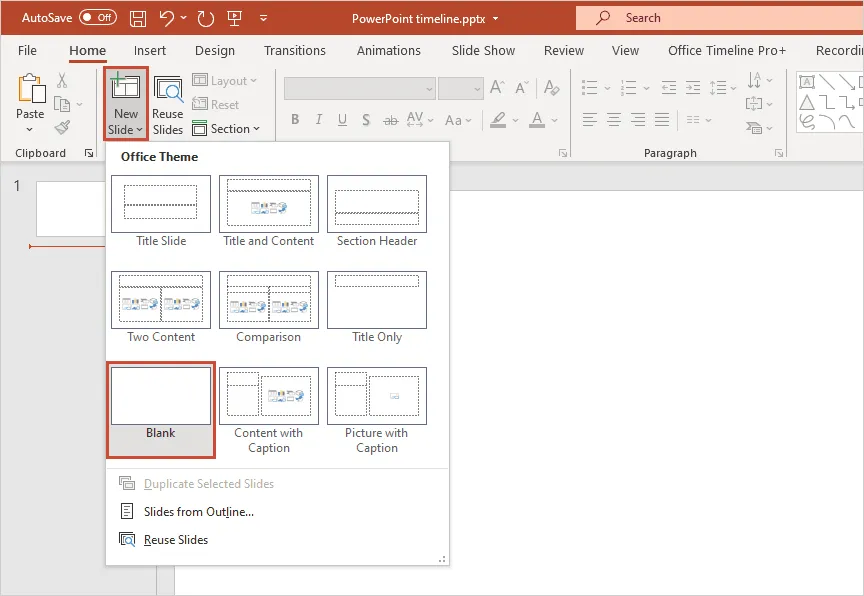
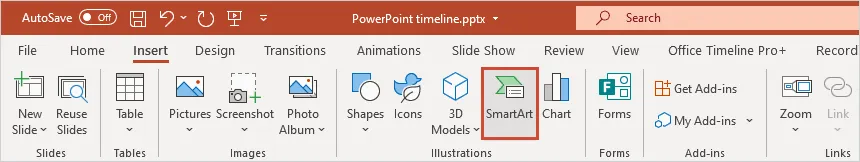
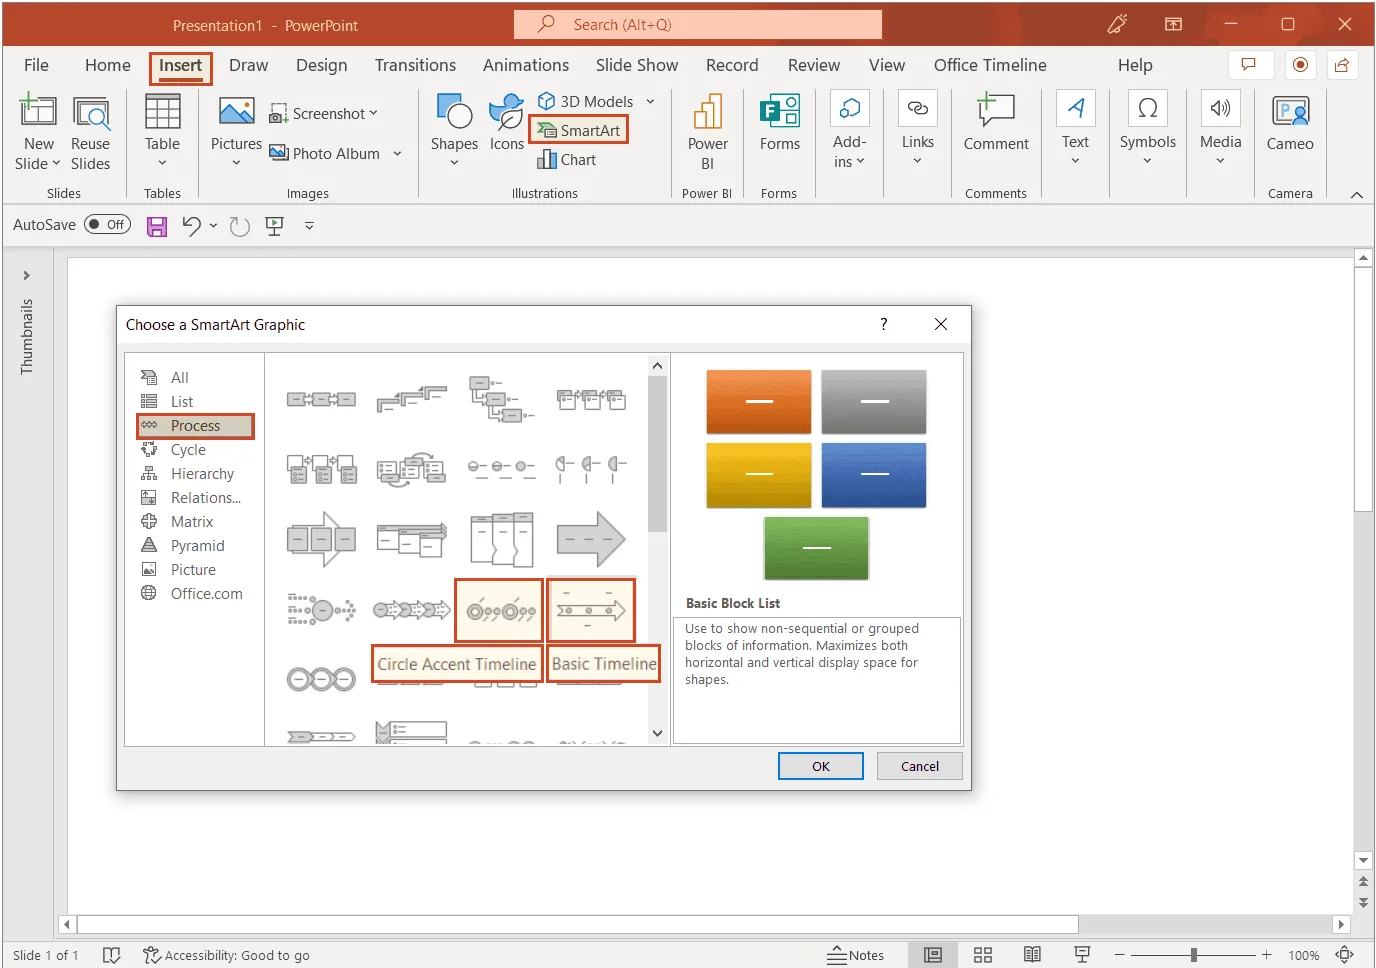
b) Go to the Insert tab on the PowerPoint ribbon and click on the SmartArt button in the Illustrations section.
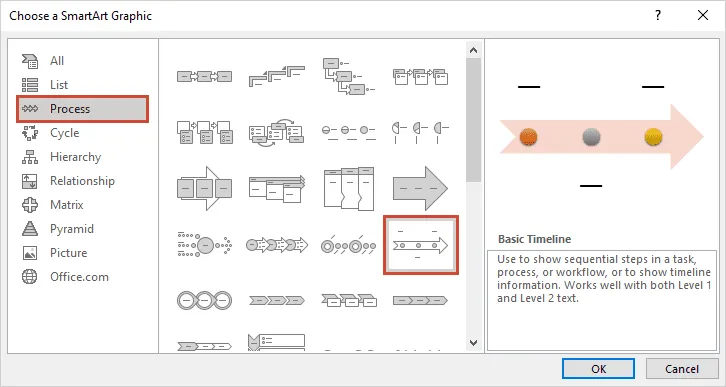
c) In the window that pops up, select the Process category, where you will find a variety of graphic options to choose from for your PowerPoint timeline. For a simple graphic that clearly shows the key events or milestones of a project, we’d recommend choosing the Basic Timeline.
You can change the style at any time from the SmartArt Tools Design tab on the ribbon if you want to try out different layouts for your graphic.
2. Add your data.
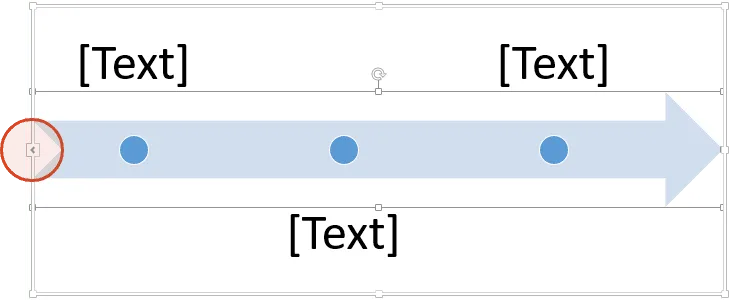
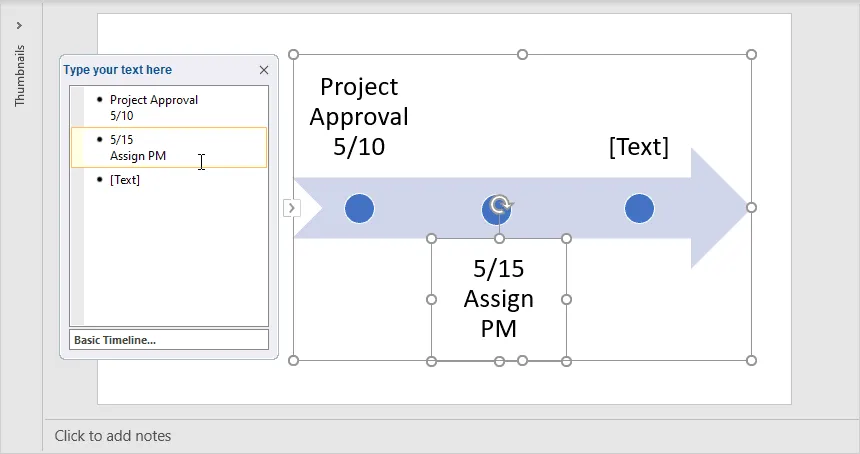
The default graphic generated by PowerPoint will have placeholder text and only 3 milestones. You can insert your own data directly on the graphic by typing inside the [Text] boxes on the slide, but adding new milestones or events besides the 3 default ones can become a little tricky this way. That’s why we’d recommend using the Text Pane instead, as it’s faster and it allows you to easily add extra milestones to your PowerPoint timeline. Here’s how it works:
a) If the Text Pane is not already visible, click on the small icon right on the left of your timeline arrow to open it.
b) Here, type in your milestone dates and descriptions, and PowerPoint will automatically update the graphic. Press Shift + Enter to insert a line break and show the date and description of a milestone one below the other.
Note: You’ll notice that PowerPoint places your milestones equidistant on the timeline, regardless of the relative distance between their dates. This is because the tool “reads” the dates you enter as plain text, so it can’t calculate the number of days between two milestones. You can manually drag milestones closer to or farther away from each other, but as you add more items on the timeline, the layout will get distorted. That’s why we’d recommend leaving them as they are.
c) To add more milestones to your PowerPoint timeline, simply press Enter after an existing item in the Text Pane and insert your data. You’ll notice that PowerPoint automatically shrinks the text size the more events you add to your timeline. To ensure your data remains easy to read, it would be safe to keep a maximum of 5 to 7 milestones.
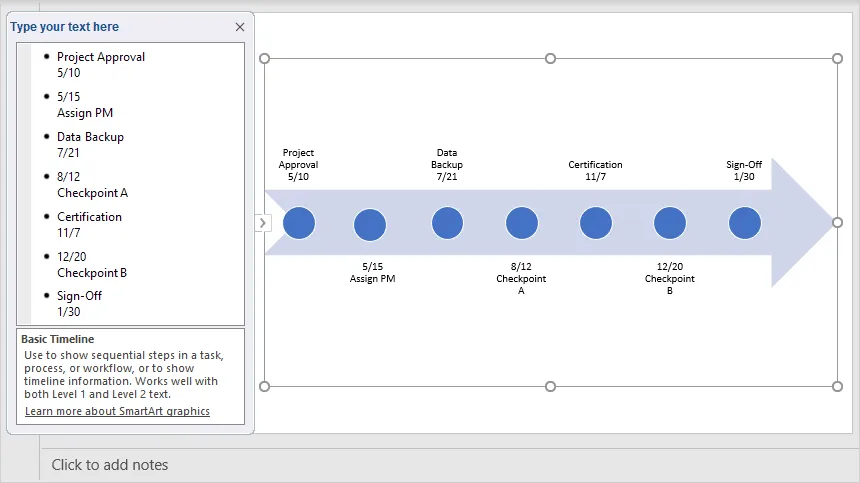
When building your PowerPoint timeline, you may be tempted to manually increase the size of the text for improved legibility. We would suggest avoiding that because it tends to ruin the whole layout. Instead, you can expand the size of the graphic box as we did above, and PowerPoint will automatically make the milestone descriptions larger too.
3. Customize your timeline.
Now you can apply some styling choices if you want to make your PowerPoint timeline look more unique.
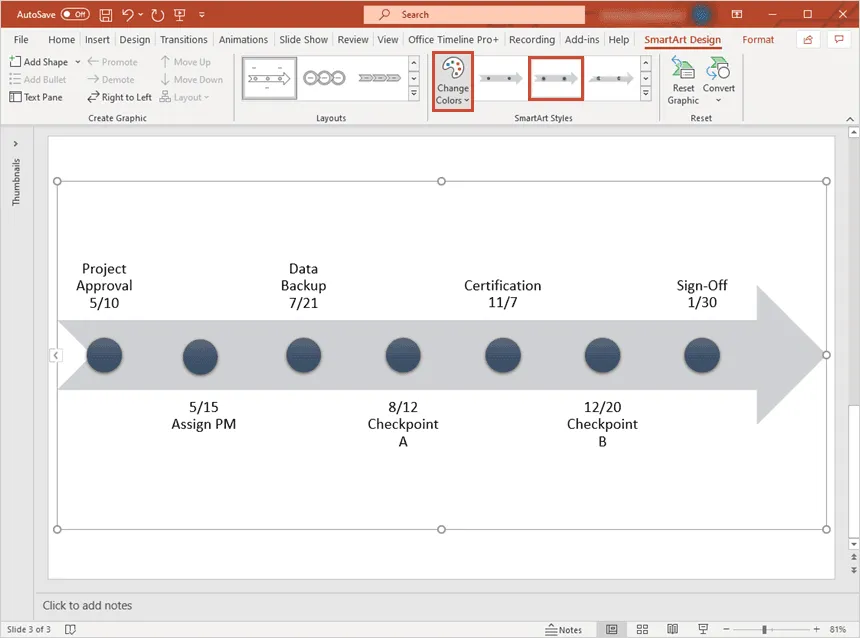
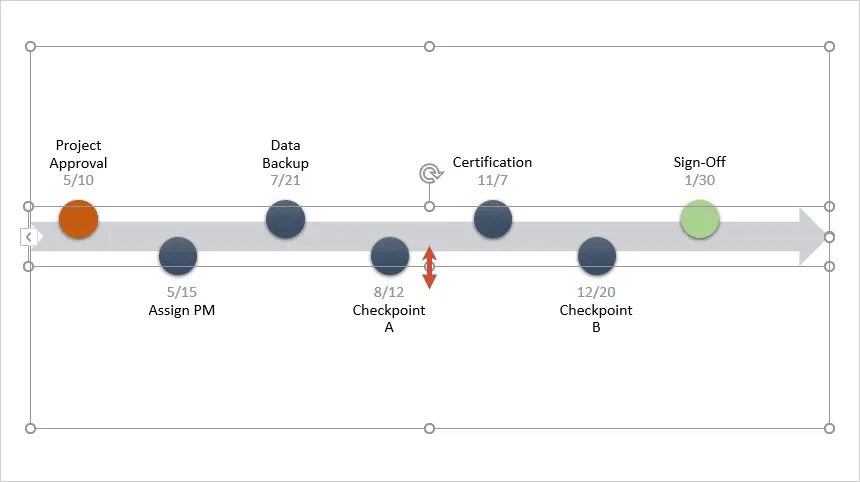
a) To customize the overall look of your timeline, you can change the SmartArt Styles and color palettes from the SmartArt Design tab on the ribbon. In our example, we chose a darker color scheme from the Change Colors dropdown and selected the Intense Effect option from the Styles menu to make the milestone circles stand out a bit better.
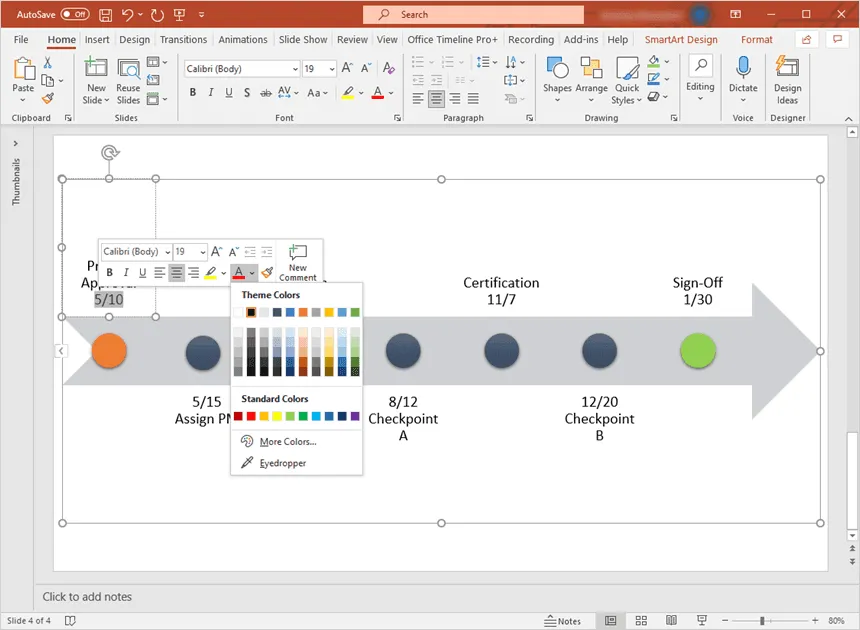
b) While the SmartArt functions apply to the whole graphic, you can also customize individual items to make a more unique PowerPoint timeline. To do this quickly, right-click on any item and use the formatting options that pop up to restyle it. For instance, you can use Shape Fill to make specific milestones stand out or change the dates’ Font Color to differentiate them better from the milestone descriptions.
c) Now, to make the milestones easier to follow, you can use drag & drop to slightly narrow the arrow shape and move the circles closer to their corresponding descriptions. It may take a while to find the ideal positioning, but it will help guide your audience’s eye when looking at your timeline in PowerPoint.
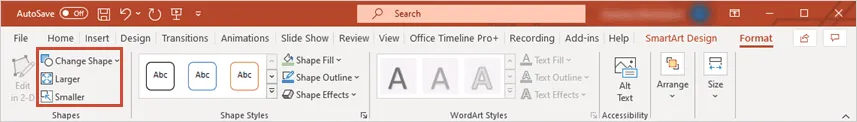
d) Finally, you can also play with the milestones’ sizes and shapes to get a more unique visual or draw attention to key data. To do so, select the objects you wish to customize and, using the options in the Format tab, you can resize them quickly or switch to other shapes.
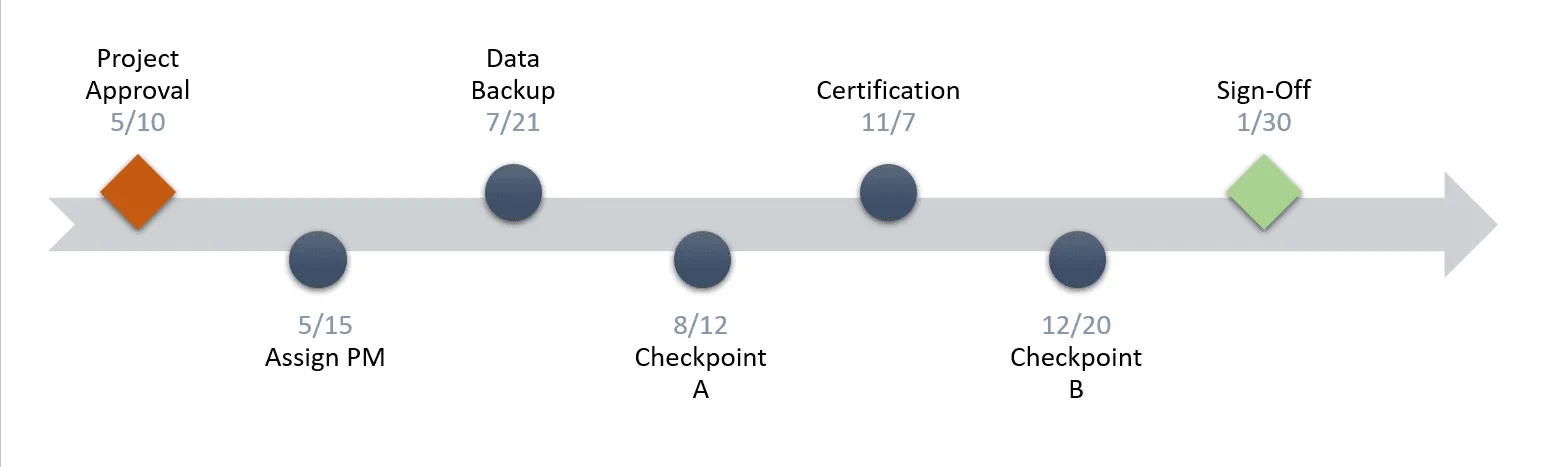
After testing more shapes and sizes using the Format tab, our timeline now looks like this:
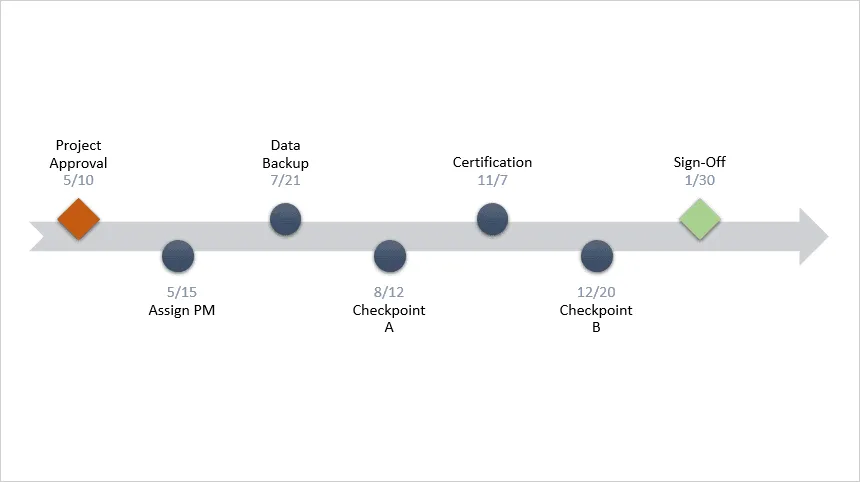
That’s it – these were the steps to manually making a timeline in PowerPoint.
Download manual timeline slide
If you’d like to use the timeline created in this guide as a template to help you move faster, you can download the slide below, free of charge.
Get this free timeline template
How to make a timeline in PowerPoint automatically
Manually creating and managing a timeline in PowerPoint is not only time-consuming but can also get quite frustrating if you want to make custom changes or updates to the visual.
In the steps below, we will show you how to quickly build, customize and update your graphic using Office Timeline, a lightweight PowerPoint timeline maker add-in that automates the whole process. To begin, you will need to install Office Timeline, which will add a new tab to the PowerPoint ribbon.
1. Open PowerPoint and insert your data into the Office Timeline wizard.
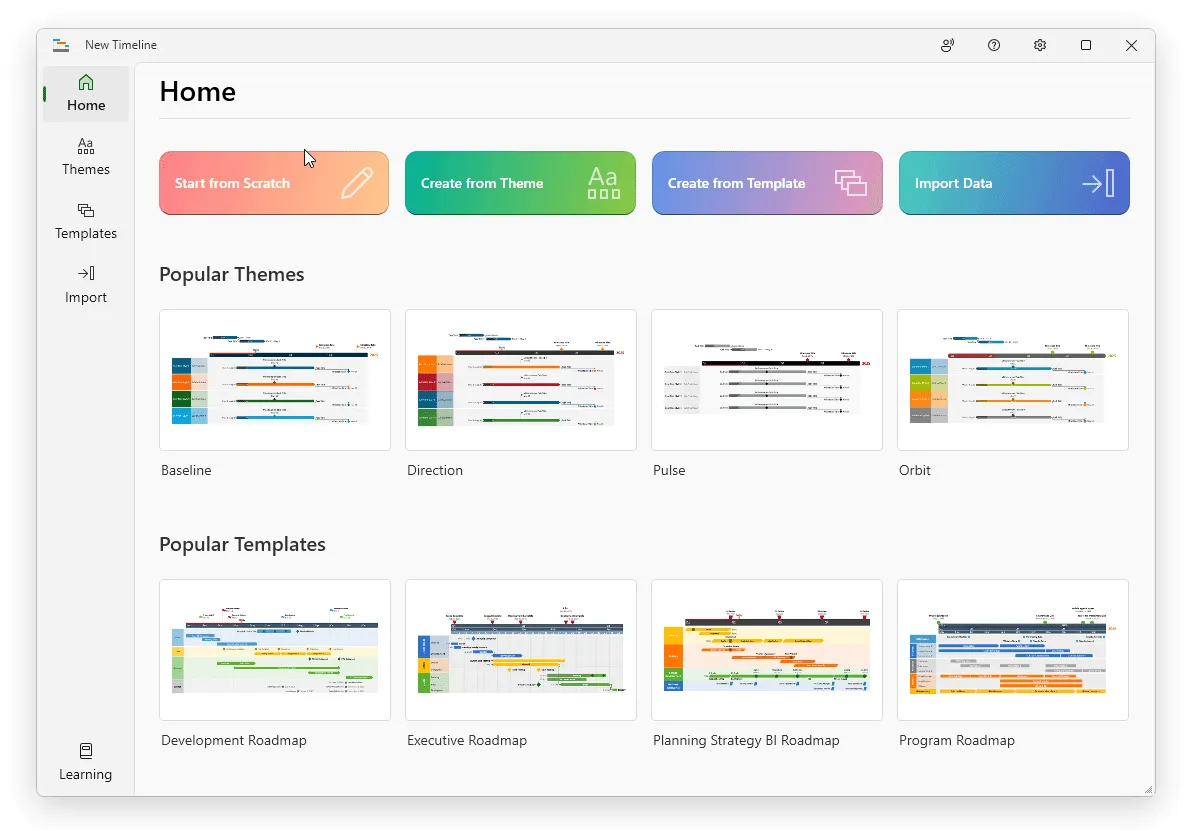
a) Inside PowerPoint, go to the Office Timeline tab, and then click on the New icon.
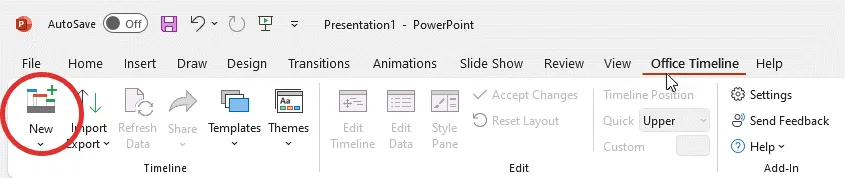
This will open a gallery that provides a variety of styles and templates you can choose from for making a timeline in PowerPoint.
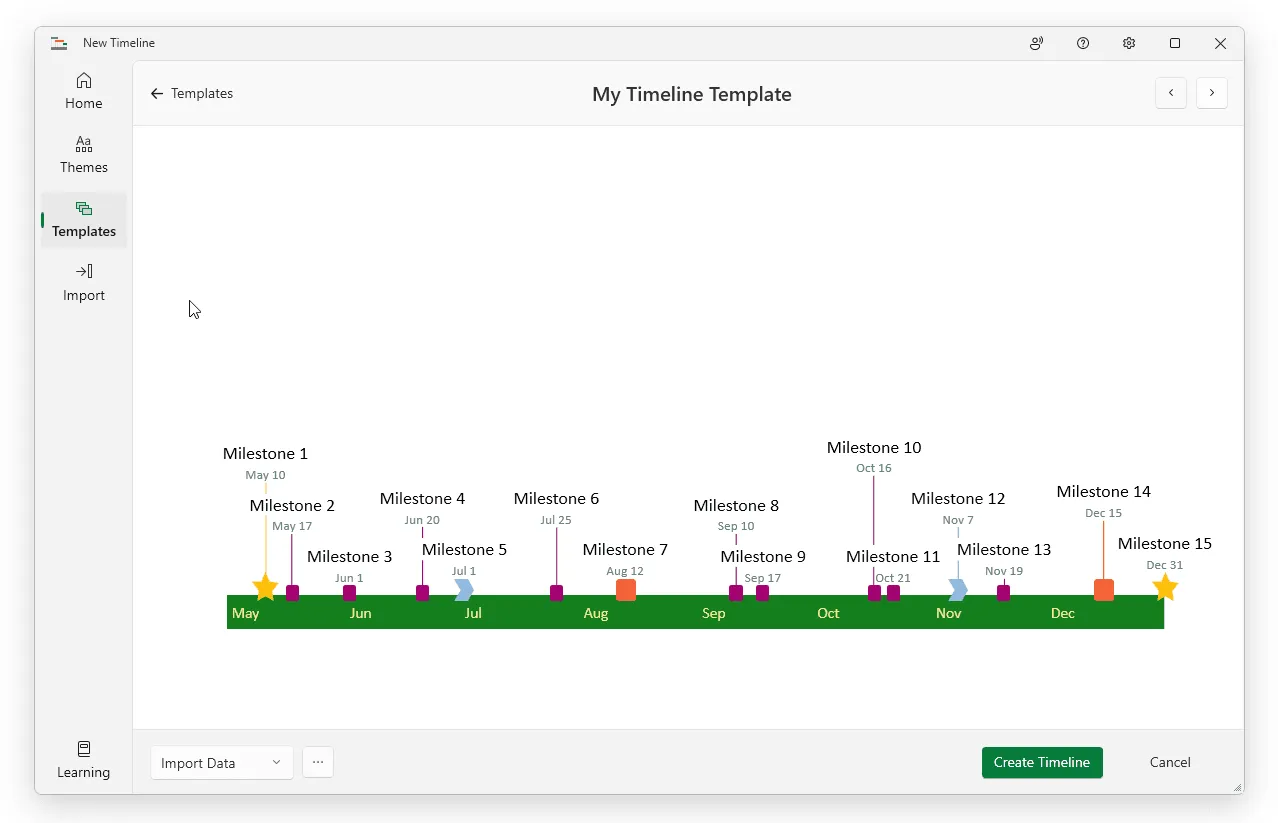
b) To select your preferred template or style from the gallery, double-click it and then click Create timeline in the preview window to open the Edit Data wizard. In this example, we will be using a custom PowerPoint timeline template we made earlier, which is available for download at the end of this tutorial.
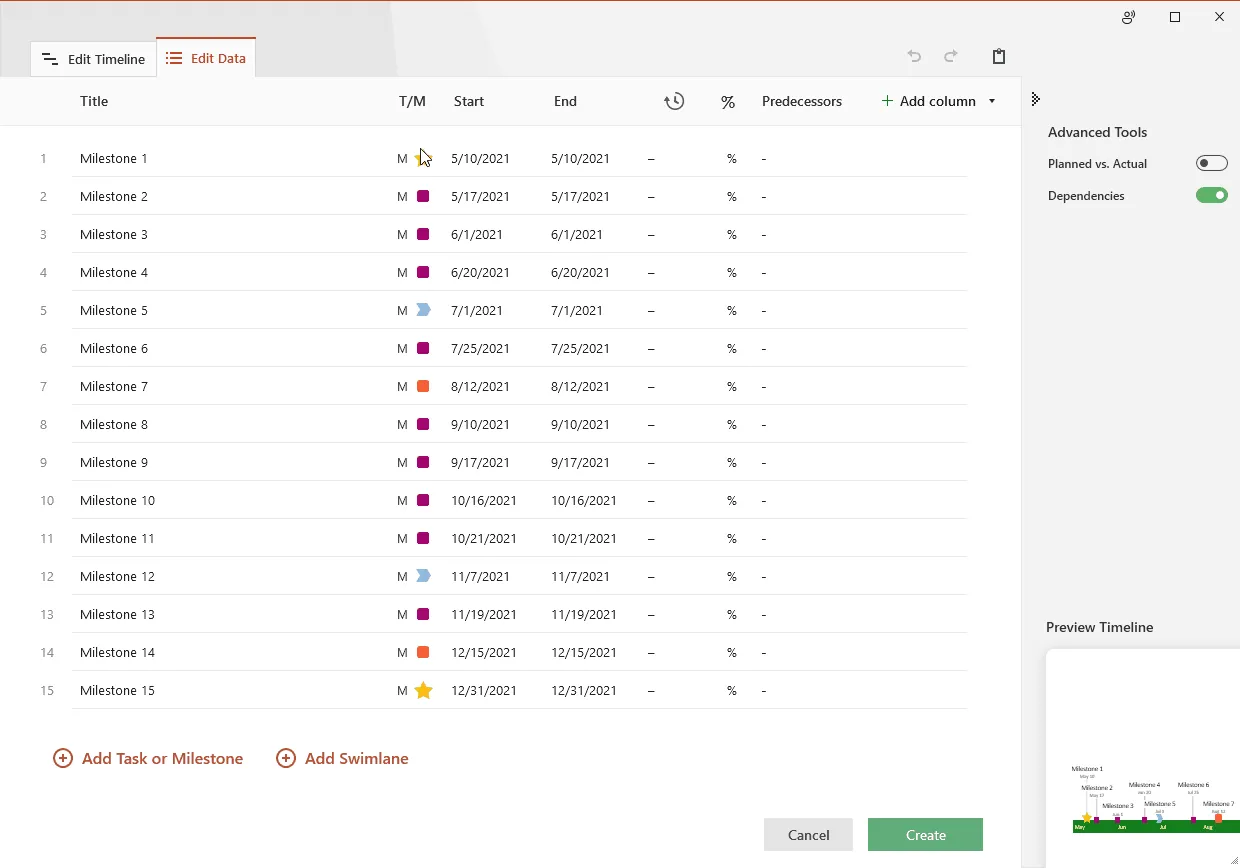
c) Now enter your milestones and set their dates, or copy & paste an existing schedule from Excel to save time. You can also make a few quick styling choices here, such as changing the color or shape of each item. Once ready, click the green Create button.
2. Instantly, you will have a new timeline slide in PowerPoint.
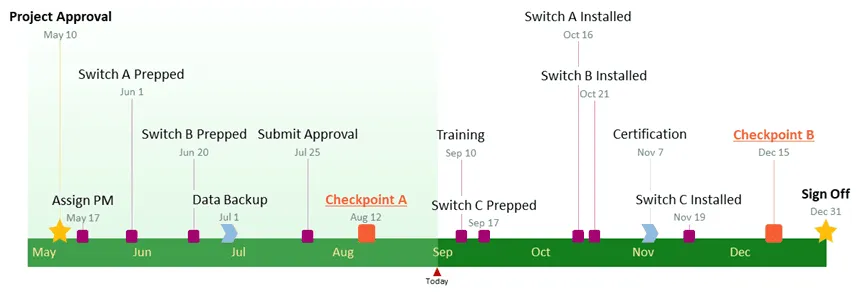
a) Depending on the style or template you’ve selected, you will get a PowerPoint timeline that looks similar to this:
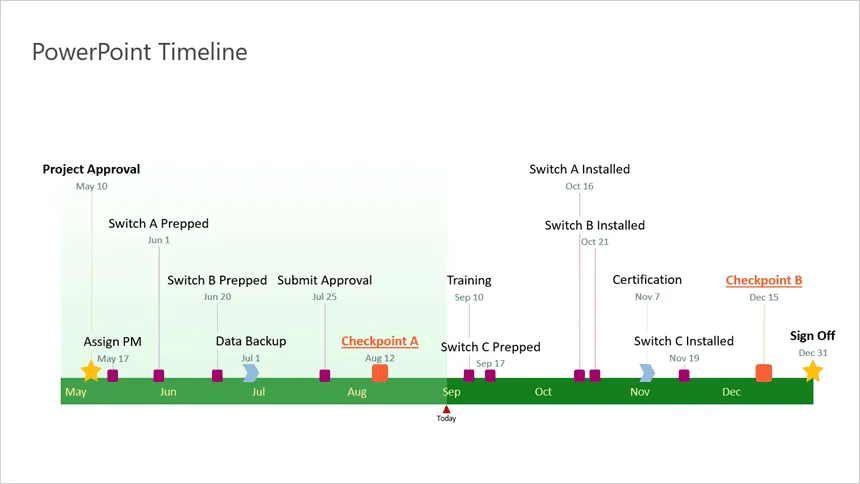
b) Once created, the timeline can be easily styled further or updated automatically using Office Timeline. For example, you can instantly change colors, shapes, and positions, switch the timescale from months to quarters, add tasks or swimlanes for a more complex visual, or adjust dates on the fly as your plans change.
Download auto-generated timeline slide
If you’d like to use the timeline created in this guide as a template to help you move faster, you can download the file below, free of charge.
Get this free timeline template
See how to make a PowerPoint timeline in under 1 minute:
Play Video
Alternatively, you can create beautiful PowerPoint timelines that you can quickly share straight from your browser with Office Timeline’s online timeline maker.
FAQ about making timelines in PowerPoint
Here are three ways that you can insert a timeline in PowerPoint:
Create a timeline directly in PowerPoint. To do this, go to Insert > Illustrations > SmartArt. In the Choose a SmartArt Graphic dialog that opens, select Process on the left, and insert one of the suggested timeline graphics in the list (Circle Accent Timeline or Basic Timeline), then customize it to your liking. Although this does create a basic timeline, the end result may not look great.
- Copy-paste your timeline or insert it as an image. Use a drawing tool to create your timeline from scratch. Then, you can either copy-paste it directly into your PowerPoint slide or save it as an image and insert it later where needed. Building a timeline from scratch might be a tedious and time-consuming process because you’ll need to draw every item manually. And you’ll need some drawing skills as well.
- Use an automated PowerPoint timeline maker. This is the easiest way to insert a timeline in PowerPoint: minimum effort with maximum results. Our suggestion is Office Timeline, a tool that automates the timeline creation process, and can save you a lot of time and effort. With just a few clicks, you can have your timeline ready, and you can easily update it later directly on your slide, if changes are needed.
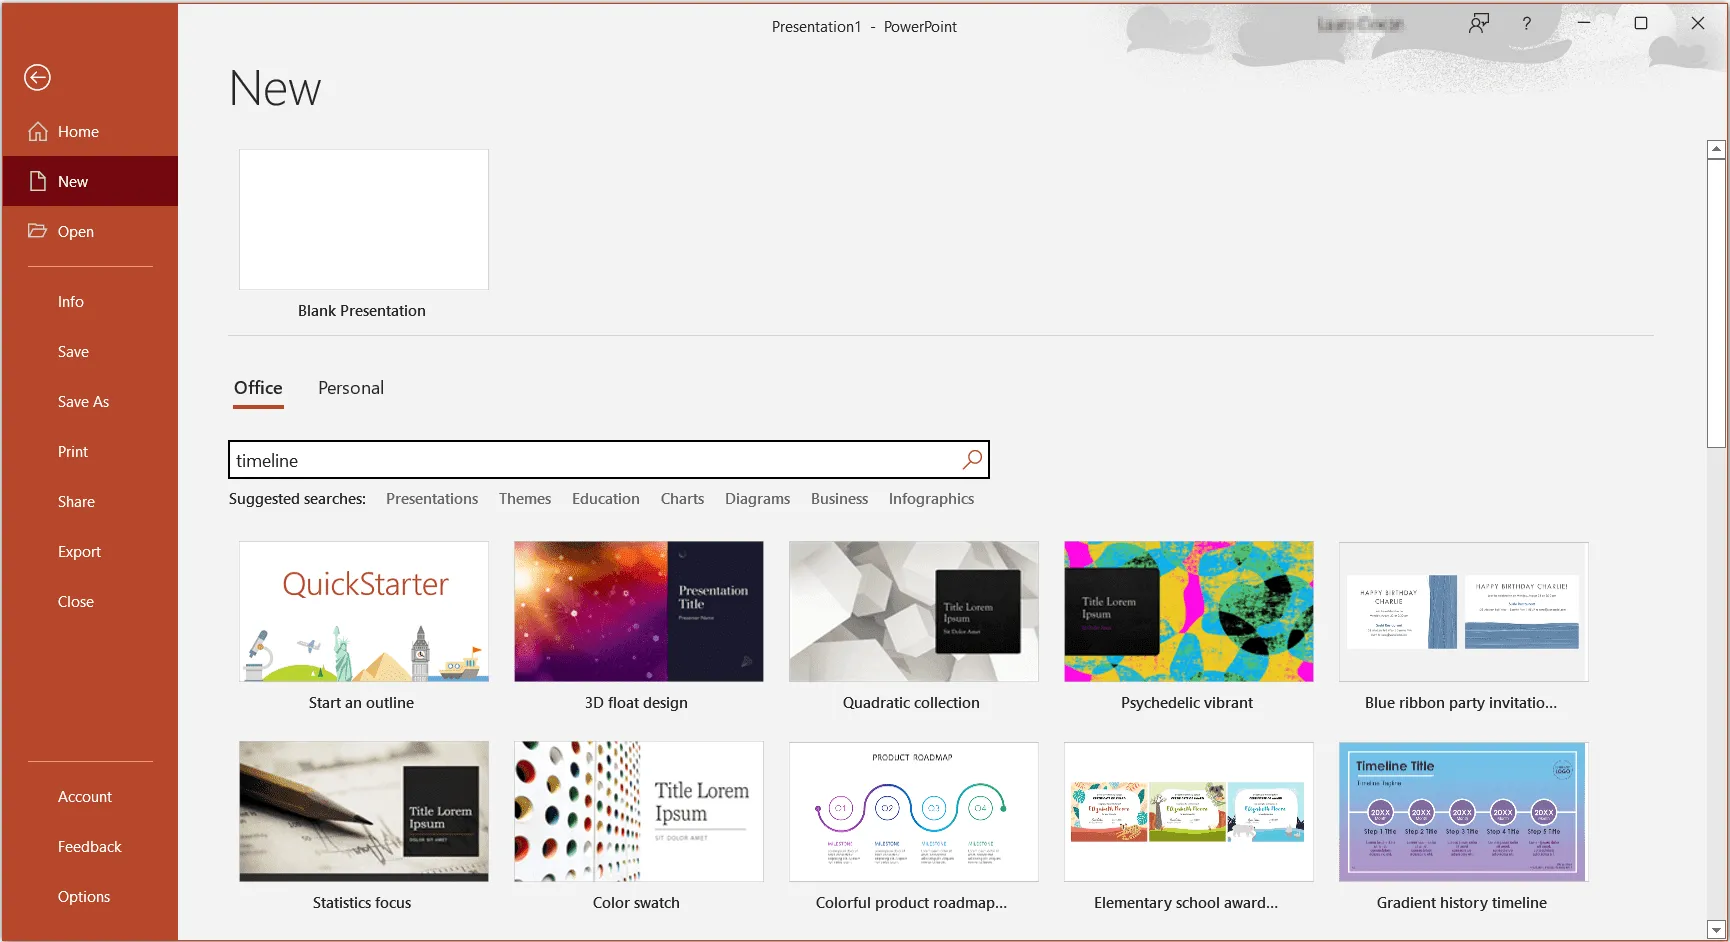
Yes, there are several timeline templates in Microsoft PowerPoint. You can find them by accessing File > New and typing “timeline” in the search box.
Microsoft PowerPoint’s native timelines are basic templates that users can customize for rather simple projects.
If you need more inspiration to create professional PowerPoint timelines for complex projects, or just want to save time with customization, browse through our free template collection, that includes dozens of stylish, easily editable designs.
There are two simple ways to create a PowerPoint timeline using the data from Excel:
- Build a timeline in Excel, then insert it into your PowerPoint presentation.
- Create a timeline directly in PowerPoint from Excel data.
Here are some more details on each method.
1. Build a timeline in Excel, then insert it into your PowerPoint presentation.
To insert your Excel timeline into PowerPoint, select your Excel timeline, copy it (CTRL + C), then position your cursor in the destination PowerPoint slide to paste it (CTRL + V). Or you can save your Excel timeline as an image (right-click on the image and select Save as Picture…), and then insert it in your PowerPoint slide (Insert > Pictures > Insert Picture From > This Device…). This method freezes the original formatting of your timeline, you will not be able to edit it later.
To find out how to build a timeline in Excel, check out our step-by-step tutorial on how to make a timeline in Microsoft Excel.
2. Generate a timeline directly in PowerPoint using Excel data.
With the Office Timeline add-in for PowerPoint, you can automatically generate your timeline from Excel with minimum effort. This tool reduces the time needed to build a timeline from hours to just minutes, and the effort to just a few clicks.
The built-in diverse template collection gives you a wide range of options to choose from, you’ll just need to input your own data and you’re all set.
With the Office Timeline add-in, you have two options to generate a timeline in PowerPoint from Excel data:
a) Copy-paste Excel data in Office Timeline. To save time and effort, you can quickly copy and paste your project data from Excel straight into the add-in. Find out how to do this in our detailed support article Copy and paste from Excel into the add-in.
b) Import & sync your Excel data into Office Timeline. Whenever your Excel data changes, you can easily refresh your timeline to reflect the updates in your source worksheet. See the detailed steps on how to import Excel data into Office Timeline in our support article Import your Excel data into Office Timeline.
Yes, there are a few timeline creating options in PowerPoint:
A. Basic timelines for simple projects – using PowerPoint’s resources:
- You can build a basic timeline starting from a template in Microsoft PowerPoint (Go to File > New and type “timeline” in the search box).
- Build your own timeline from scratch using the Insert > Illustrations > SmartArt. Then, in the dialog box that pops up, select Process, and insert one of the suggested timeline graphics. Find step-by-step instructions in our tutorial How to make a timeline in Microsoft PowerPoint.
B. Complex timeline for professionals – using the Office Timeline add-in:
- Automatically generate a complex timeline in minutes by selecting one of the tens of templates and typing or copying or importing your data into the data wizard.
To find out how to build a timeline in Excel, check out our step-by-step tutorial on how to make a timeline in Microsoft Excel.
You can make a timeline in PowerPoint completely free, using either the presentation platform’s native templates or the lightweight add-in for PowerPoint from Office Timeline.
The Office Timeline add-in is a powerful, easy-to-use timeline maker that works with all PowerPoint versions. After installing, the Office Timeline Add-in features a data entry wizard, so you can generate unique timelines in PowerPoint in just minutes.
Office Timeline Free Edition is an easy-to-use PowerPoint add-in that helps you automatically generate beautiful timelines, Gantt charts and Swimlane slides with up to 10 milestones and tasks.
For complex projects and professional functionalities, there is also a more advanced edition that comes with a 14-day free trial for new users.
The best way to show a project timeline depends on the objectives that you want to highlight in your presentation and on your audience’s expectations.
For example:
- For team check-ins, you can show a project timeline in any productivity tool that your team uses the most, with formats that range from visuals in Microsoft Project to basic timelines in Excel. For detailed instructions on how to produce any of these various layouts, check out the tutorials we’ve put together for you in the section “How to make timelines with your usual office tools”. You might find that the most convenient way to include a timeline in a presentation is to create it directly in PowerPoint, so that it can be easily integrated in your PowerPoint presentation.
- For client communications or executive presentations, you’ll need to show your project timeline as a high-level, crisp overview that displays data in an easy-to-follow manner even for less tech-savvy audiences.
The simplest solution in each case is to use an automated, dedicated timeline maker like Office Timeline’s add-in for PowerPoint. It saves you a lot of time and effort by quickly generating stylish visuals directly in PowerPoint with just a few clicks. To better organize your data and present it in a clearer and more visually appealing way, you can choose to display multiple timescales on your graphic and group your Milestones, Teams, and Tasks into swimlanes.
The best way to present a timeline in PowerPoint is making sure your timeline is as clear and comprehensive as possible. For this, you need to find the optimal method to include your data into a visual, so that it’s easy for you to present and for your audience to understand.
Here’s a checklist you’ll need to make the best of your timeline:
- Set the main steps of your plan and set clear time reference points.
- Include the series of events and activities that you want to display on your graphic.
- Include dates and time intervals to mark events’ occurrence.
- Choose and arrange along the timeline the most important milestones that mark key points or that can impact the course of events.
- Place any priority risks or issues along the timeline.
- Clearly mark the start date and end date on your timeline.
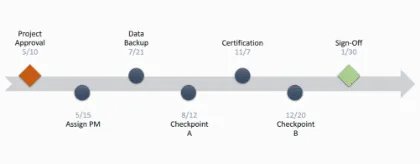
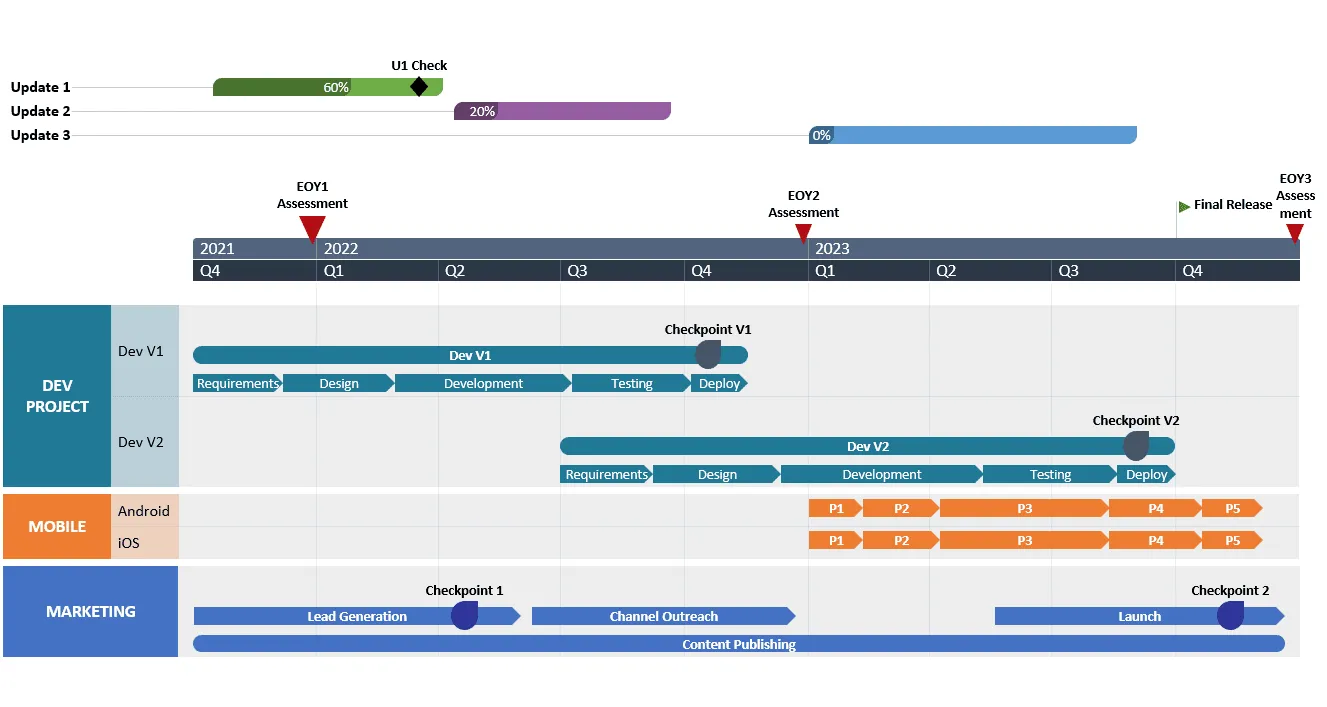
Then, you need to find the timeline format that best fits your needs. If it’s a simple project, you can create a basic timeline using the native functionalities of PowerPoint. Your timeline could look like this:
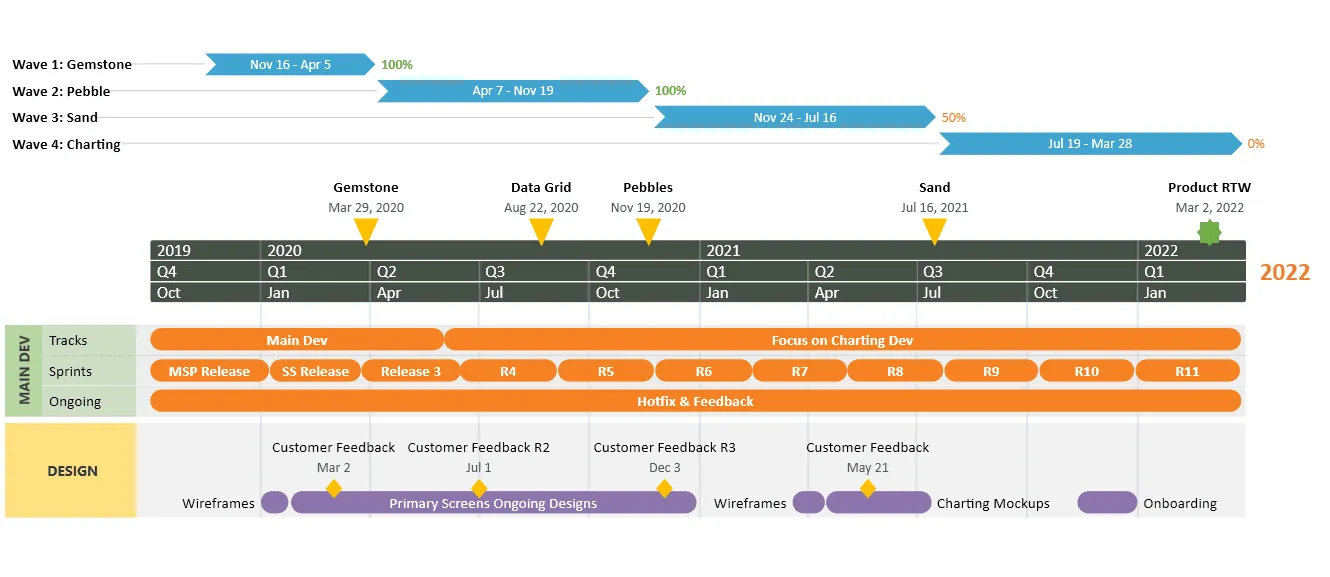
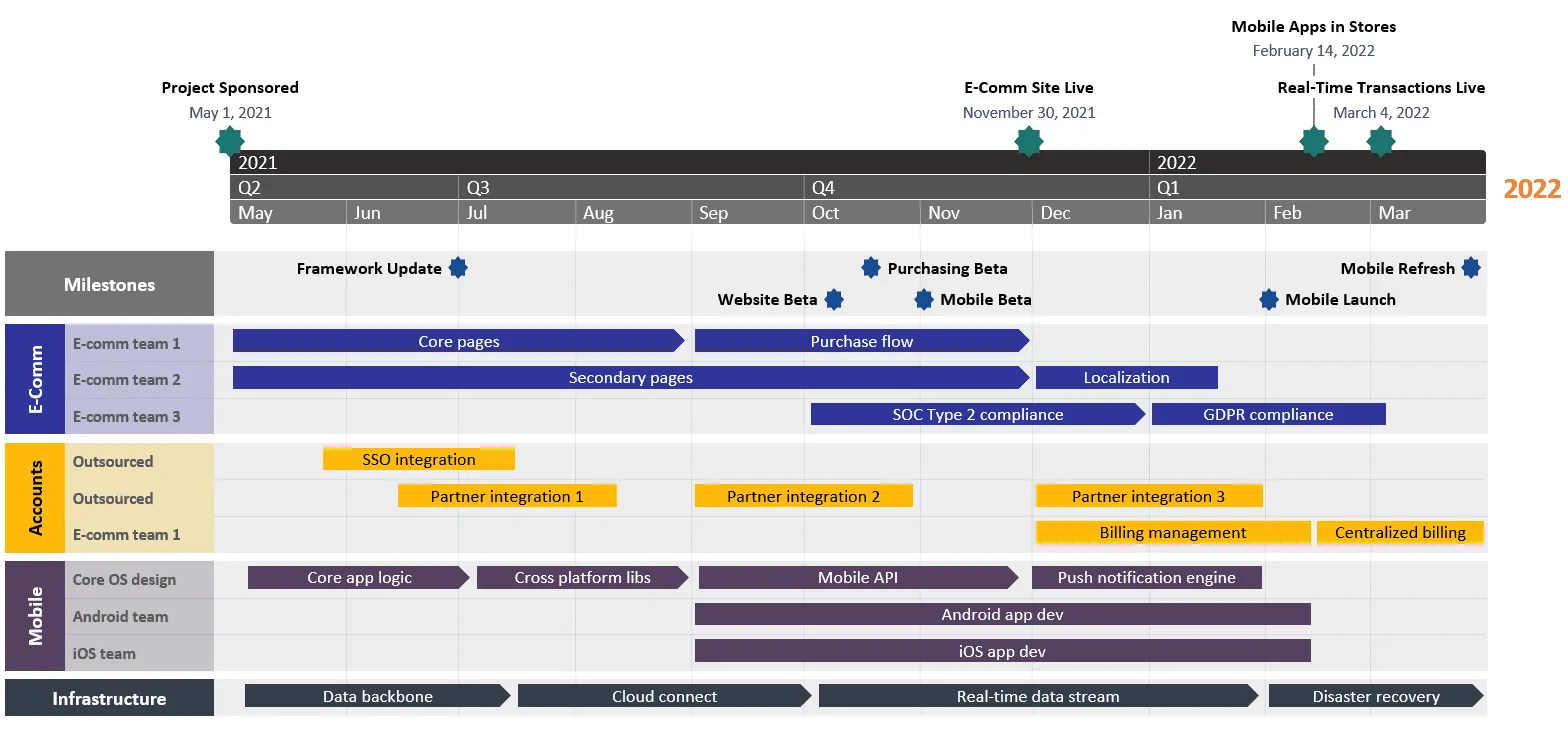
If your project is more complex, you will need to create a visual that summarizes data but also includes all relevant details in a cohesive way using a professional tool such as the Office Timeline add-in. This timeline maker generates professional timelines in minutes after you install it and include your information in its intuitive Data Entry wizard. Your resulting timeline could look like this: