Microsoft Project can automatically create a timeline out of your project’s data, but the resulting visual is often too crowded or complex to follow. On this page, we will show you two options for turning MS Project data into a clean, easy-to-understand timeline fit for presentations to high-level audiences.
The first tutorial uses MS Project’s grouping and formatting options to make an overview timeline, while the other shows you how to instantly import your MS Project data into PowerPoint and turn it into a beautiful visual slide.
Which tutorial would you like to see?
How to make a clear timeline in MS Project
When managing a complex or large project, a clean summary timeline that presents only the key milestones or deliverables of a project may be the best way to share information with non-technical audiences. Here’s how to create and format a simple timeline directly in MS Project.
1. Activate the Timeline View in MS Project.
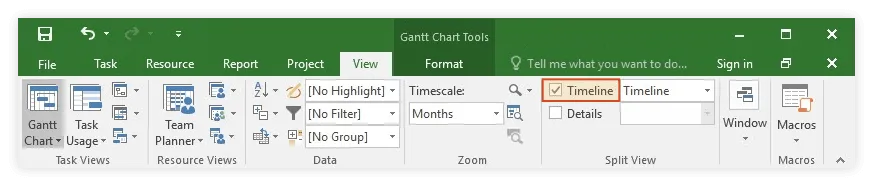
a) Open your .mpp project and go to the View tab on the MS Project ribbon.
b) From here, tick the Timeline checkbox you can see in the Split View group.
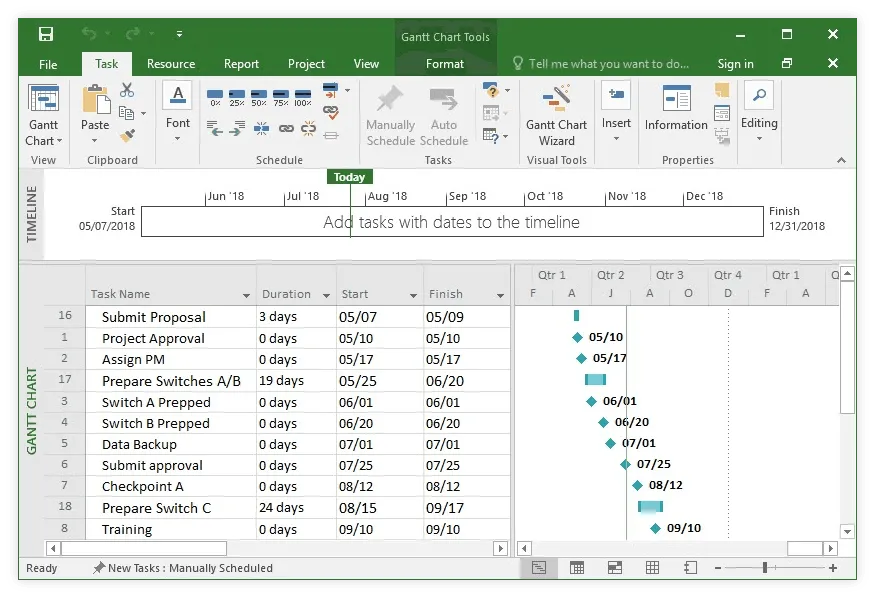
c) Microsoft Project will add a blank timeline on top of your Gantt Chart View.
2. Group your milestones together.
To filter out unnecessary data and easily add only the key deliverables or events to your timeline, you can use Project’s Group function. Here’s how it works:
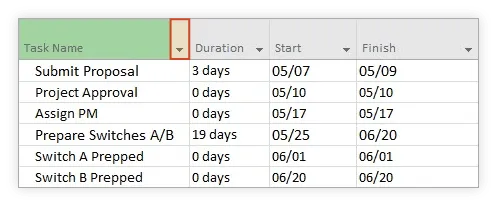
a) Click on the small down arrow on the Task Name header in your project table.
b) From the menu that pops up, go to Group by and select Milestones.
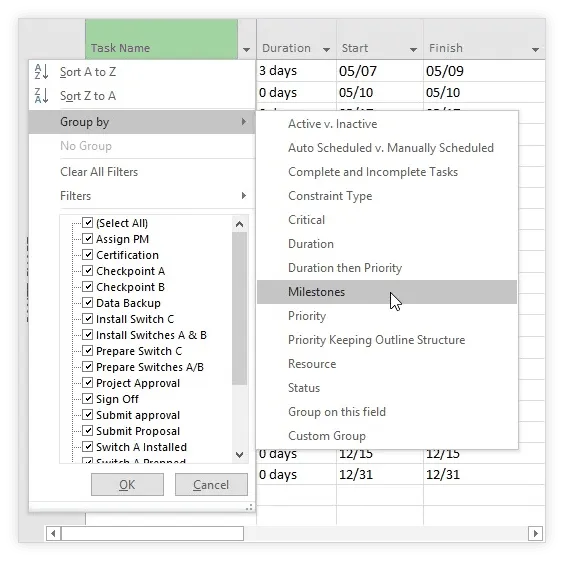
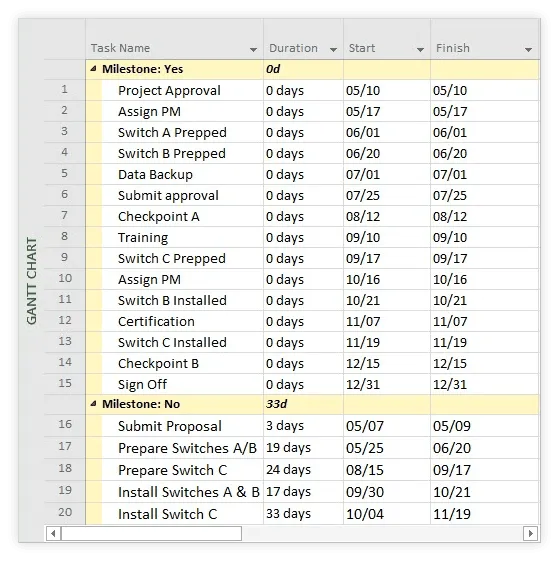
c) Microsoft Project will automatically separate your milestones from the tasks and move them all high up in the sheet so you can identify them instantly.
3. Add your milestones to the timeline.
a) Now that your milestones are all grouped together nicely, you can quickly select them all using Shift + Click or pick only a few key ones by holding Ctrl while selecting their corresponding cells. For this example, we’ll select all but two milestones from our Project spreadsheet.
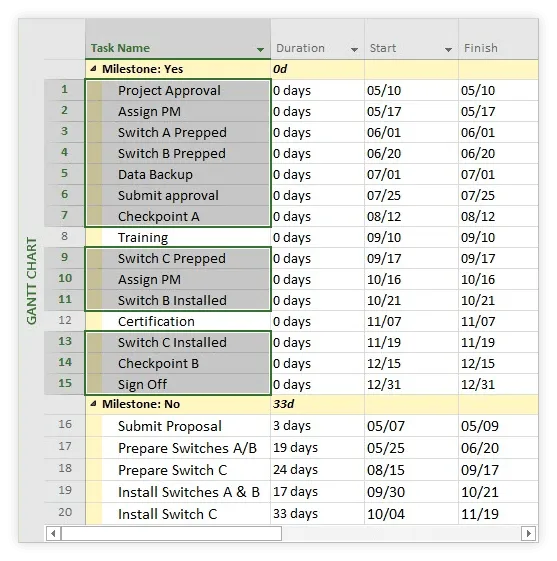
Note: Make sure not to accidentally select the summary row (“Milestones: Yes”) as it cannot be added to the timeline and, if it’s included in your selection, it will prevent you from adding the rest of your data too.
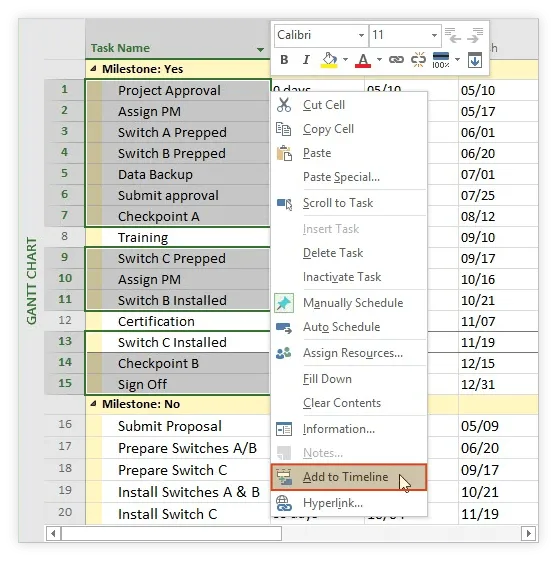
b) Once you’ve selected your milestones, right-click anywhere inside the selection and then choose Add to Timeline from the pop-up menu.
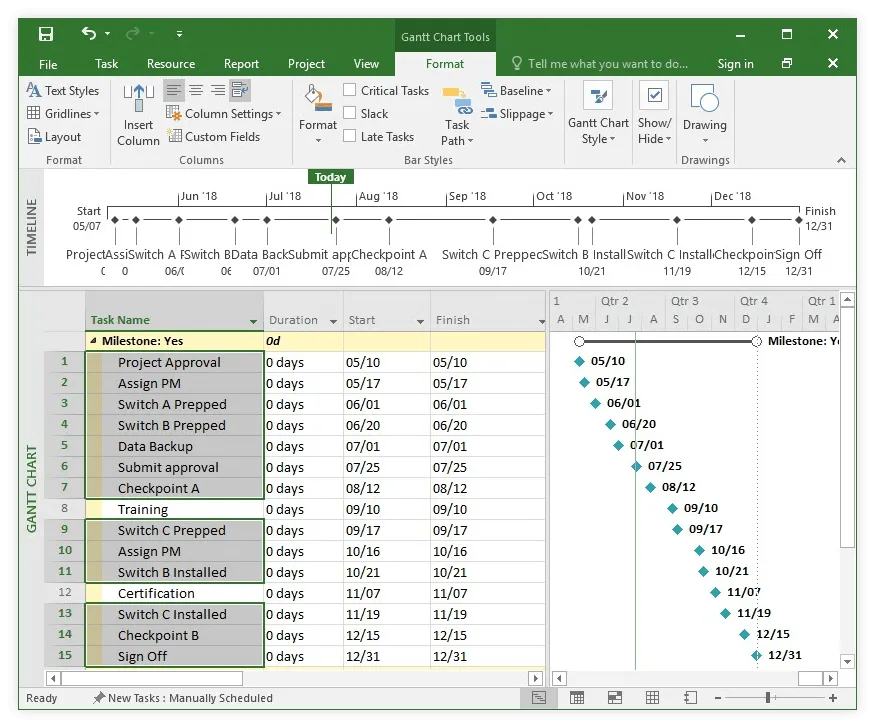
c) Microsoft Project will instantly add the selected data to your timeline.
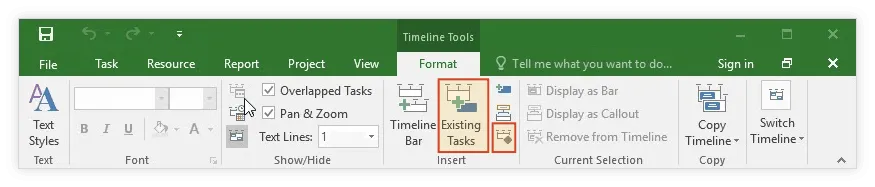
d) Now, if you wish to add extra milestones to the graphic, you can do it at any time either from the project table following the steps described earlier, or by using the Timeline Tools. For the latter, click anywhere inside the Timeline View and go to the Timeline Tools Format tab. Here, from the Insert group, you can use the Existing Tasks button to add milestones you already have in your spreadsheet or click on the small Diamond icon to create a new milestone.
e) You may also want to remove items from the graphic if your timeline gets too crowded or if your plans change. To do so, select the milestone you wish to take out and, in the Timeline Tools Format tab, click on Remove from Timeline.
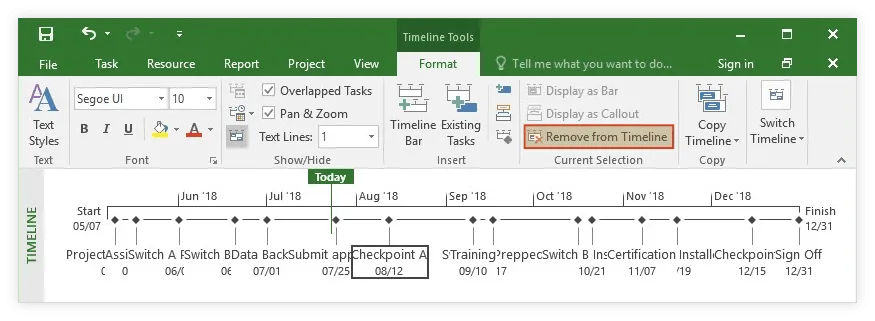
Don’t worry, milestones removed from the graphic will not be deleted from your data file – they’ll still be available in the Gantt Chart View, so you can quickly add them back to the timeline later if you need to.
4. Customize your timeline.
You’ve probably already noticed that the default timeline generated by MS Project is not exactly easy to read. Here’s how you can customize it to make it more presentable.
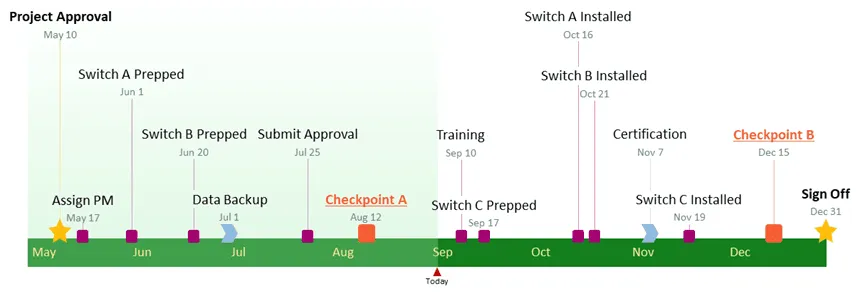
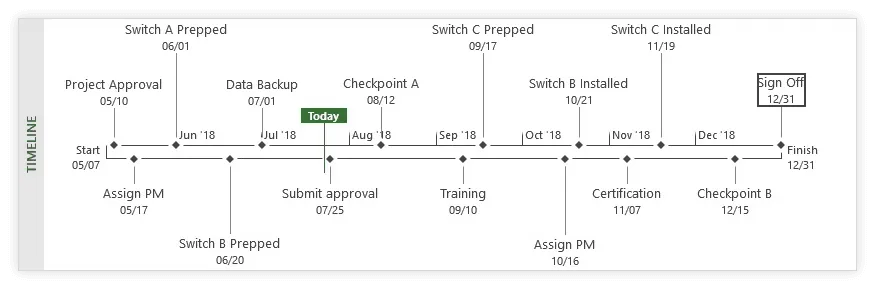
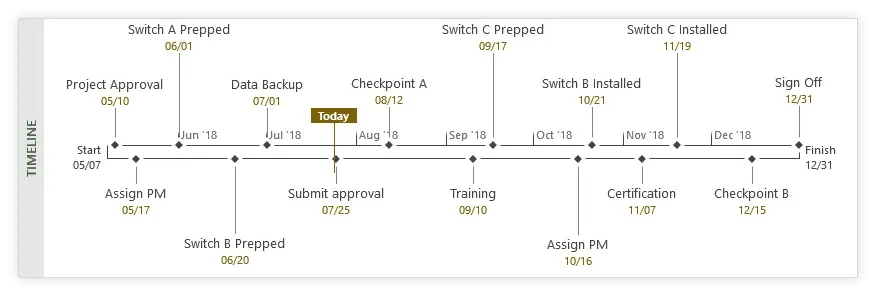
a) If you have overlapping milestone labels like we did, you can reposition them higher or lower on the timeline to make room for all texts. From your graphic, simply select the label you wish to move and drag it to the desired position. We’ve found that alternating milestones above and below the time scale helps optimize space and creates a clean, uncluttered layout.
b) Now, to make the timeline more eye-pleasing, you can customize all texts on the graphic. To do so, click on the Text Styles button from the Timeline Tools Format tab.
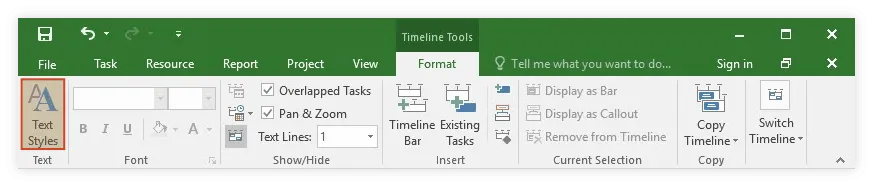
A dialog box will pop up, allowing you to easily change text fonts, colors, styles, and sizes. You can choose to apply the same formatting to all items on the graphic, or to customize only particular groups, such as Milestone Dates, Timescale text, or the Today Label.
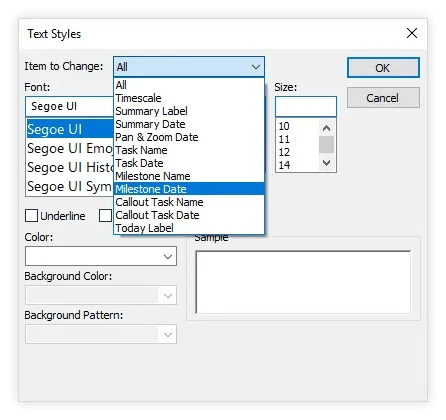
On our timeline, we chose to change all Milestone Dates and the Today Label to a dark Gold.
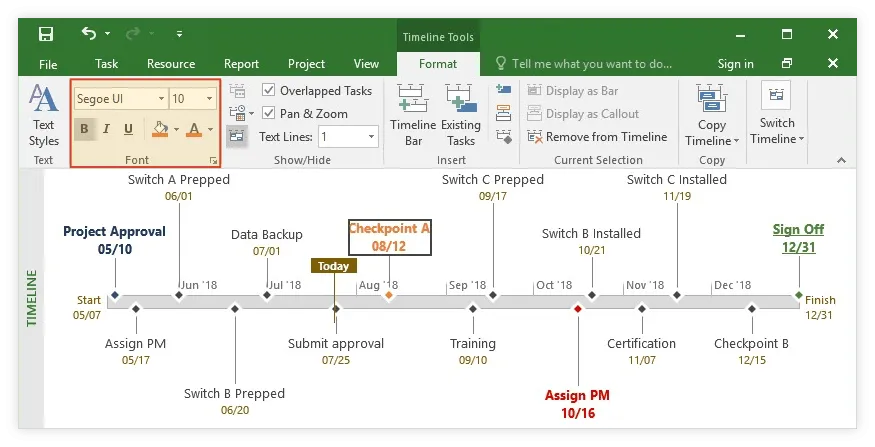
c) Microsoft Project also lets you customize individual items on the timeline, which can help you diversify your graphic or draw attention to important data. Simply select the desired item and change the formatting using the buttons that appear in the Font group of the Timeline Tools Format tab. For instance, you can recolor a text using the Font Color button and change the color of the timeline bar or that of a milestone diamond by clicking the small Paint Bucket icon.
5. Share your timeline.
Once you’re done customizing, you can use the Copy Timeline button on the Format tab to insert your graphic into an email message or a PowerPoint slide.
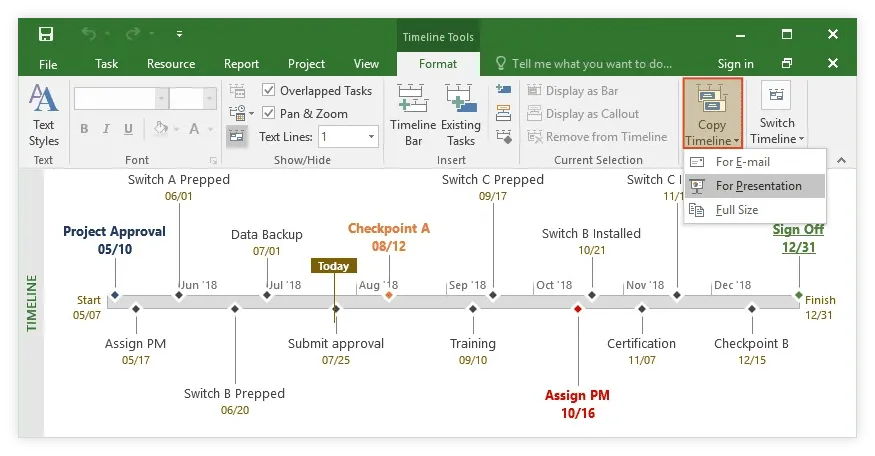
Quick tip: You’ll notice that the items on the timeline will be pasted as individual, editable elements by default. While this does provide opportunities for further editing, it also means that the objects and overall layout can get distorted if you try to resize the graphic after pasting it into another document. If the graphic is too wide to fit a slide or email message properly, you can avoid any distortions by resizing the MS Project window before clicking Copy Timeline.
Download the pre-built Microsoft Project timeline file
If you’d like to use the timeline created in this guide as a template to help you move faster, you can download the file below, free of charge.
Get this free timeline template
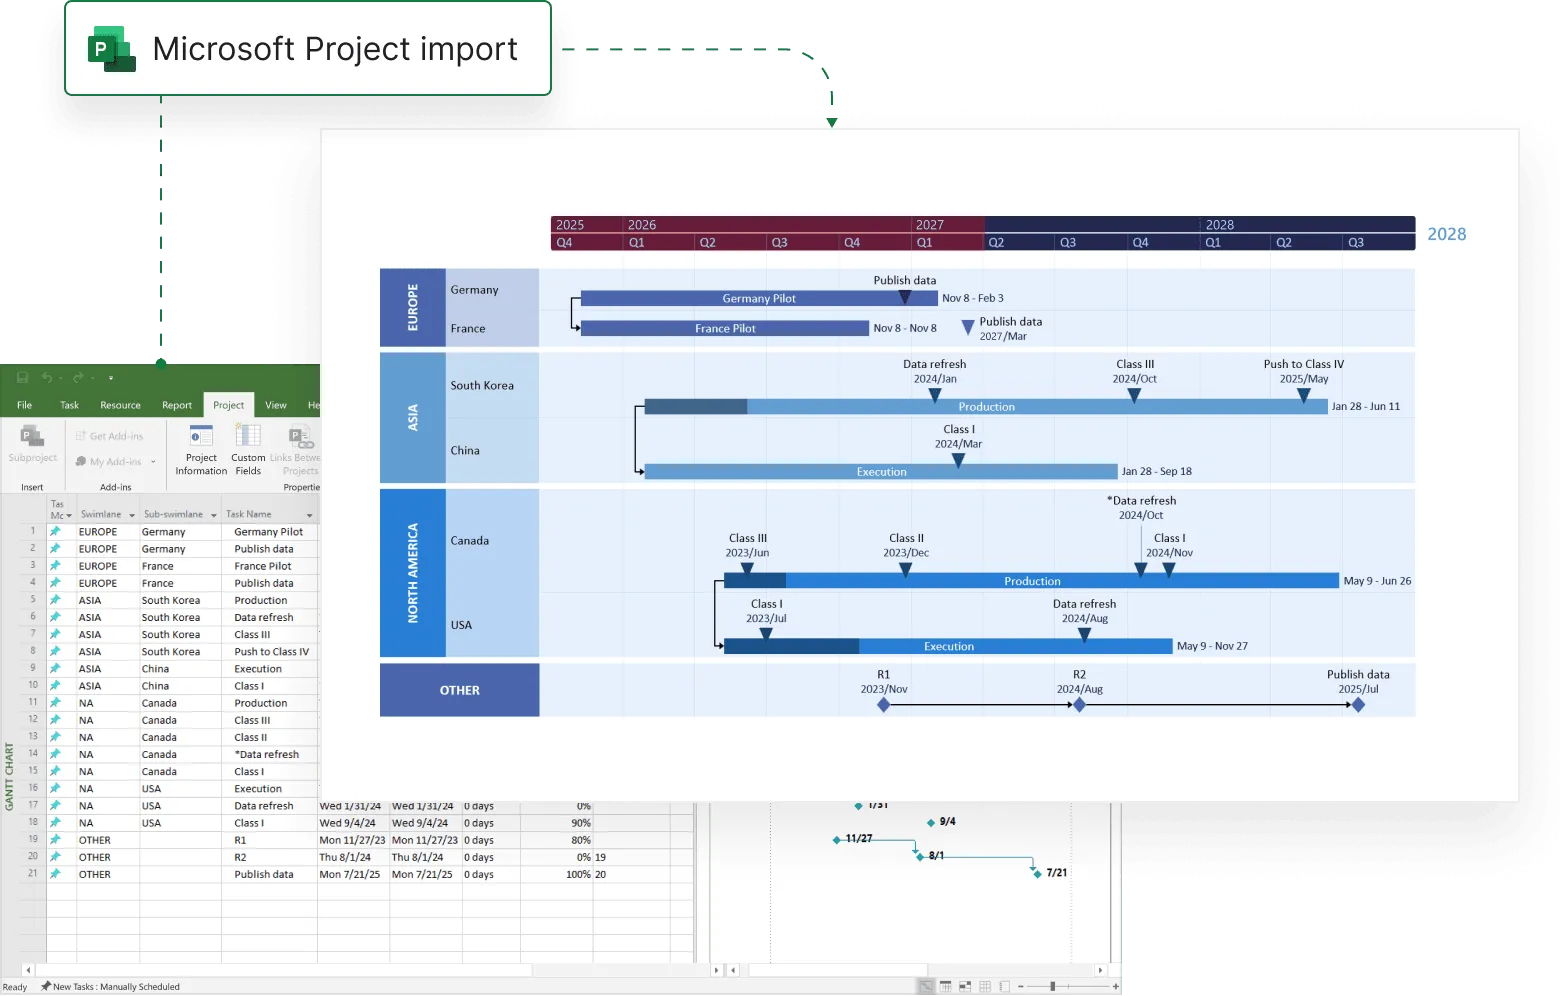
Instantly turn Project data into a PowerPoint timeline
Although it is possible to make a timeline in MS Project, PowerPoint is a better choice for creating visuals that will be used in high-level communications. Below we will demonstrate how to instantly turn raw MS Project data into a stylish timeline slide using a PowerPoint add-in called Office Timeline. Once created, the visual can be easily customized and updated automatically when plans change.
Before getting started, you need to install Office Timeline, which will add a new tab to the PowerPoint ribbon.
Import your Microsoft Project data into PowerPoint.
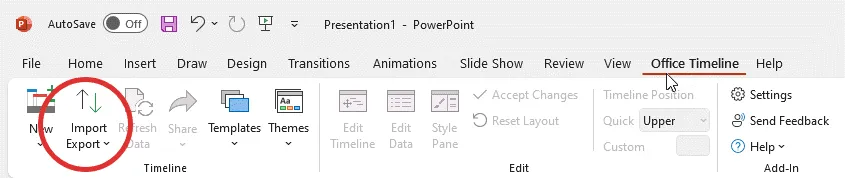
a) Inside PowerPoint, click the Import button on the Office Timeline tab.
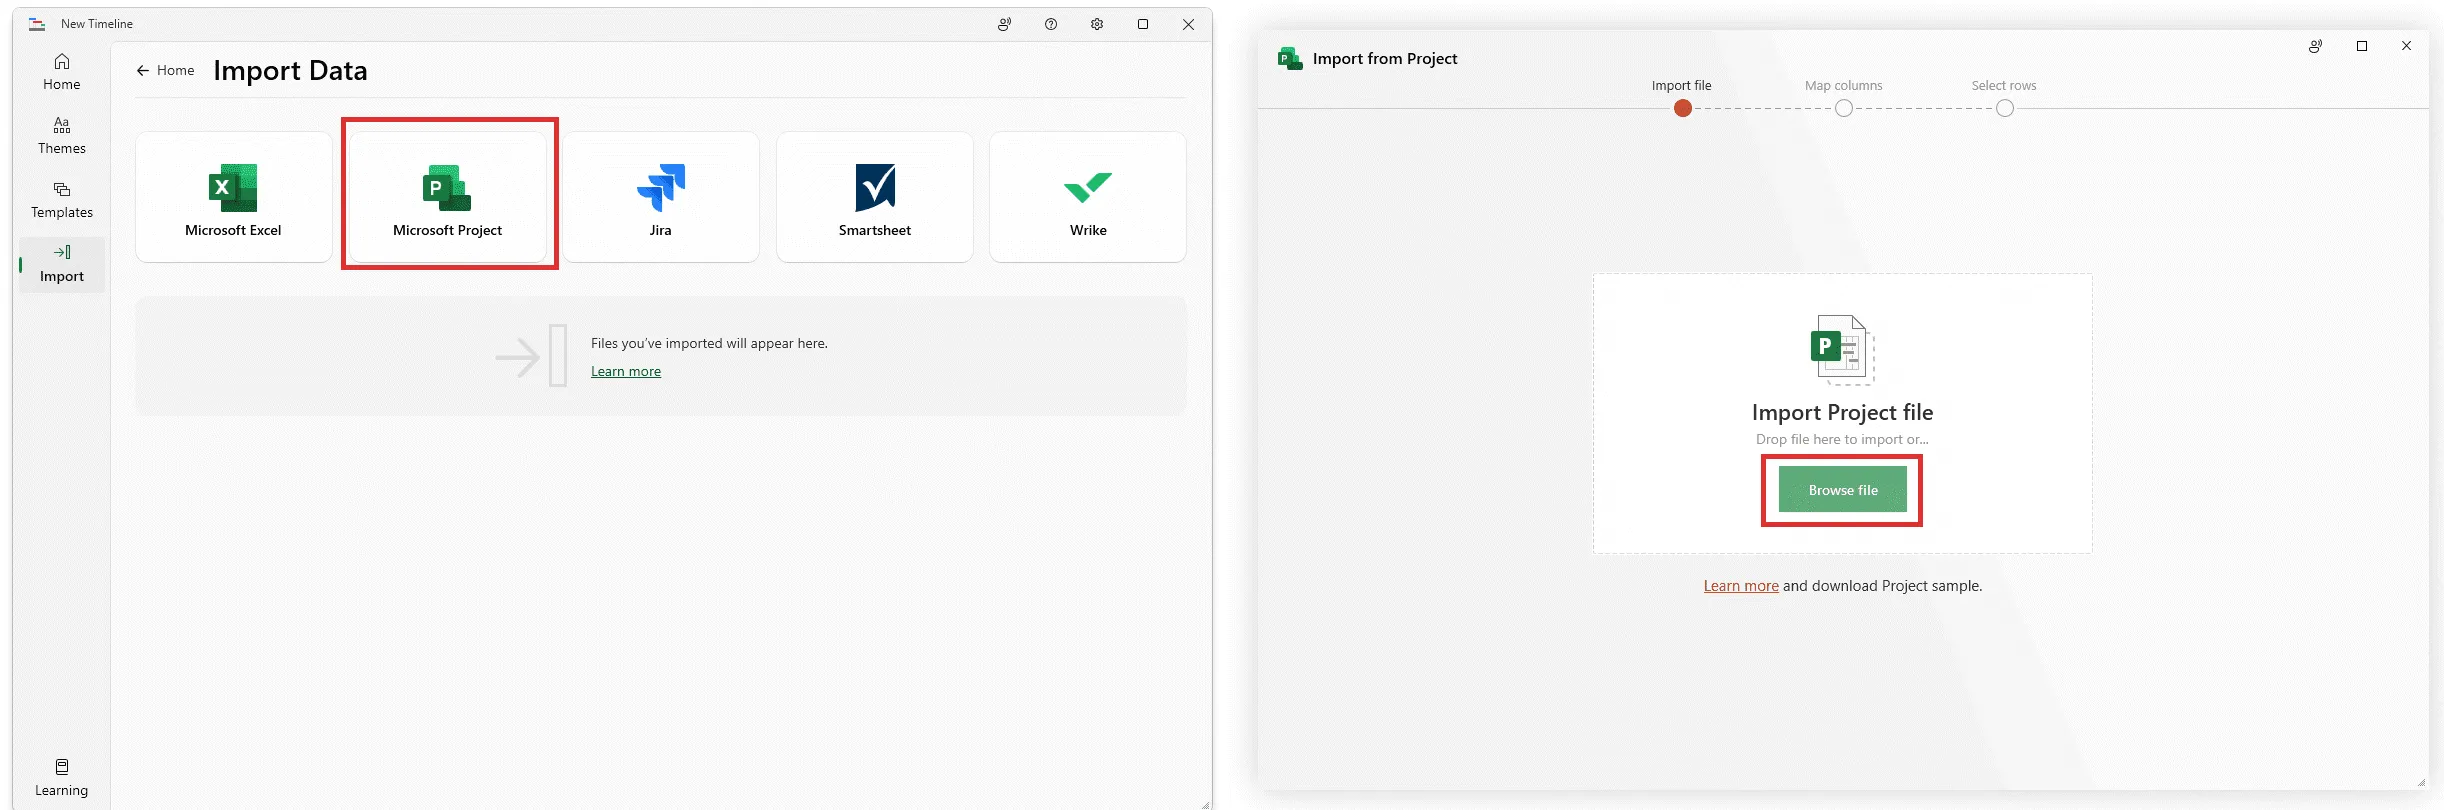
b) In the Import Data wizard, select “Microsoft Project” from the options available and then pick the .mpp file you want to load into PowerPoint.
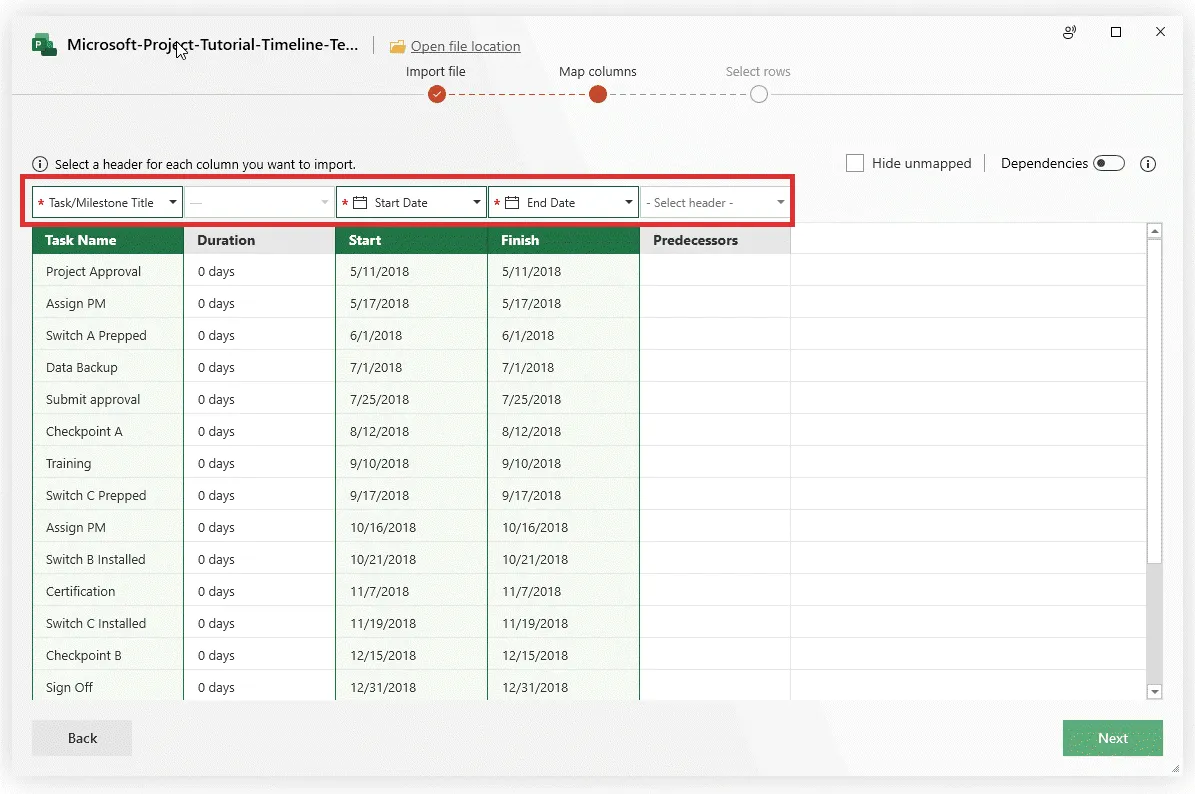
c) Once you’ve loaded the file, Office Timeline will automatically map the Title, Start Date and End date columns. If you'd like to use other columns than the ones mapped by default or remove them, simply click the dropdown menu above them. When you’re done mapping, click Next.
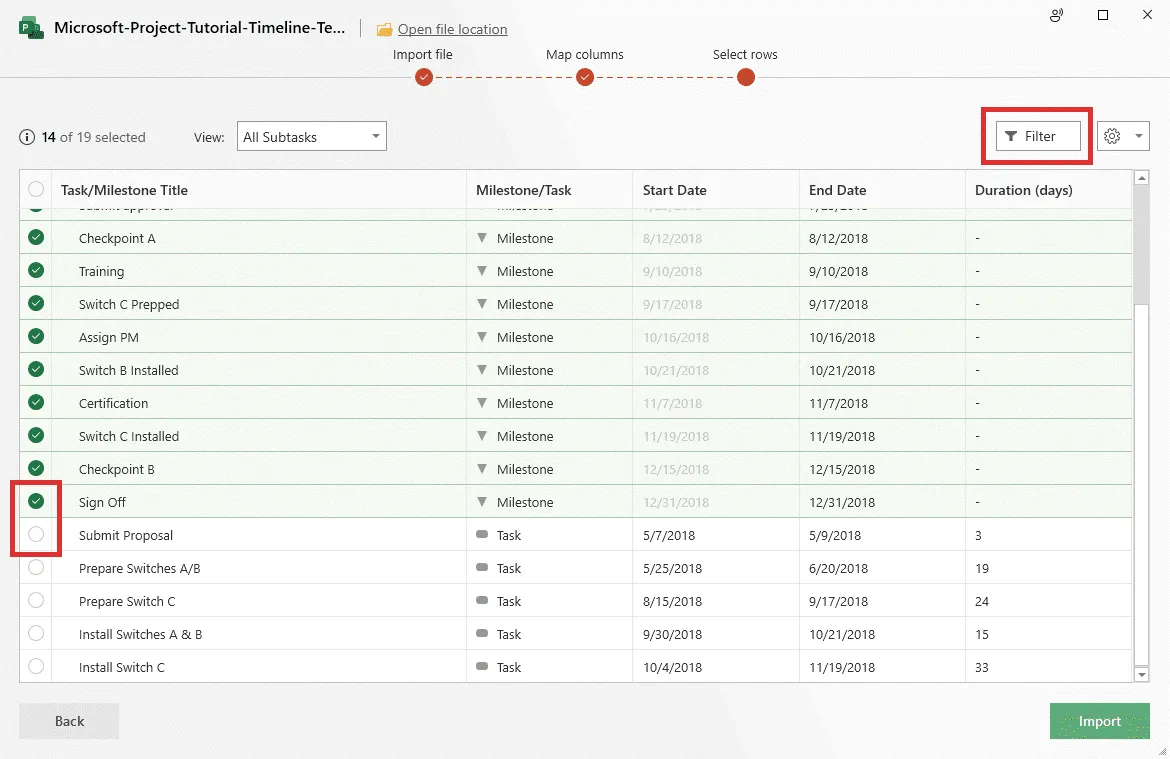
d) Now, you can choose exactly what MS Project records you want to import into PowerPoint. Use the checkboxes on the left to select or deselect individual rows, or the built-in filters above the list to include or remove whole categories. Once ready, click Import.
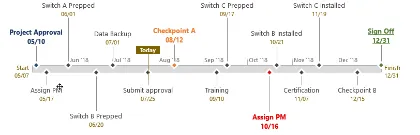
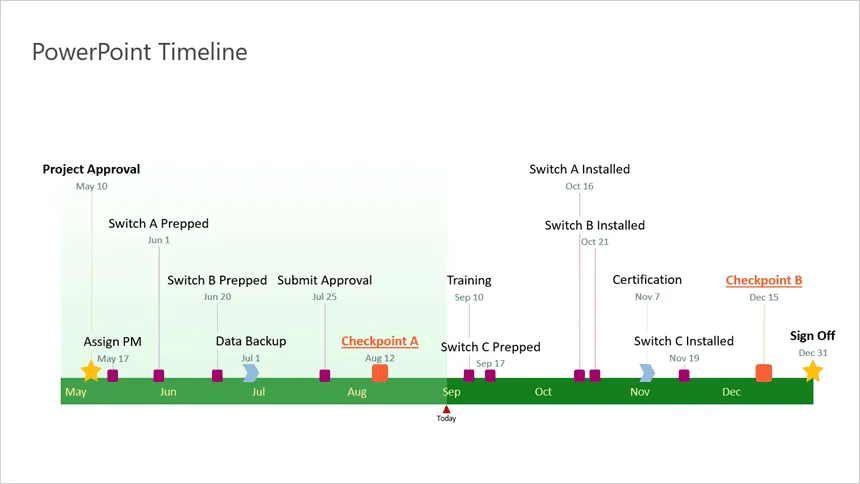
e) Office Timeline will instantly generate a native PowerPoint timeline from your chosen MS Project data, which you can fully customize with just a few clicks. For instance, you can quickly select a whole different layout for your timeline, change milestone colors, shapes, and positions, or add tasks at any time to create a Gantt chart.
After making a few styling choices, our timeline looked like the one below - and it took less than a minute to make.
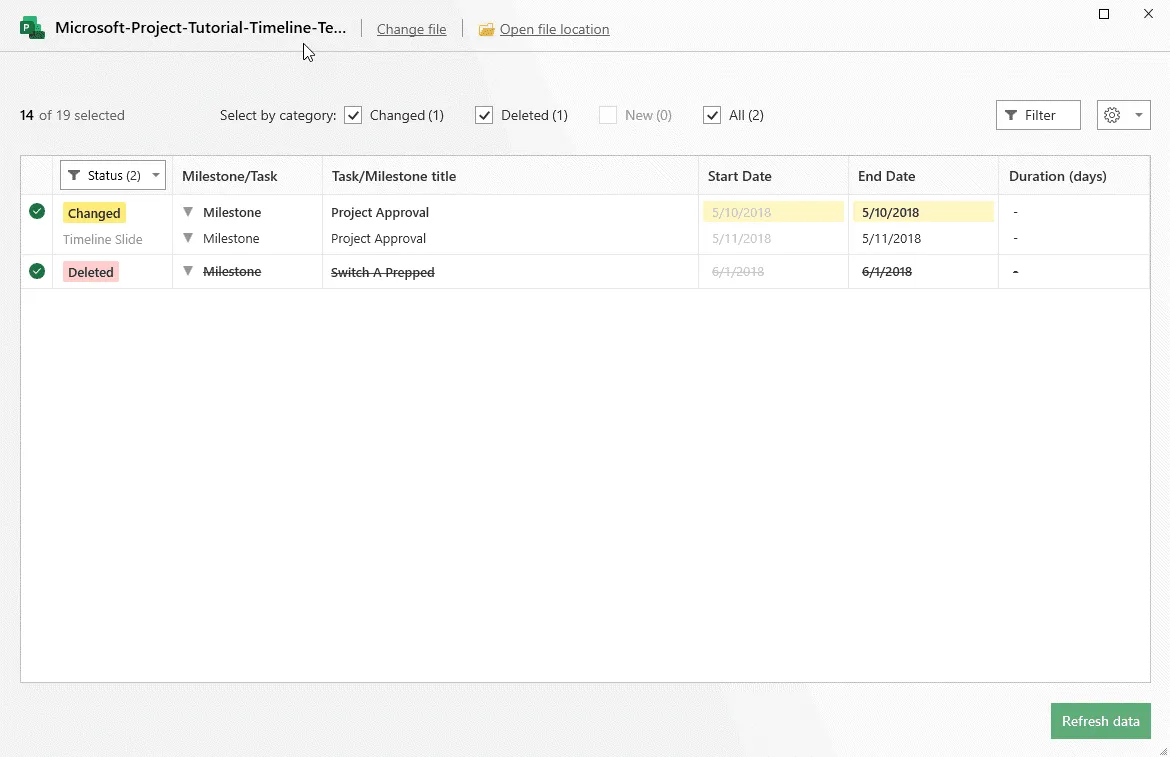
f) Your timeline slide can be updated in real time whenever your Microsoft Project file changes. After making adjustments to your Project plan, simply click the Refresh data button on the Office Timeline ribbon in PowerPoint, and the add-in will automatically identify any changes in your .mpp data. Select the ones you want to keep and click Refresh data to instantly update your PowerPoint timeline.
Download PowerPoint timeline template file
If you’d like to use the timeline created in this guide as a template to help you move faster, you can download the file below, free of charge.
Get this free timeline template
See how to make a PowerPoint timeline from MS Project in under 3 minutes
Play Video
FAQs about making timelines in Microsoft Project
The Timeline view of a Microsoft Project file shows your tasks as blocks of time allocated over the project’s lifecycle. This view appears at the top of the Gantt chart view of a new Project file, and it is useful for visualizing the activities that need to be accomplished in a timeline format.
To have the Timeline view displayed in your MS Project file above the Gantt chart view, go to the View tab, and then tick the Timeline checkbox that appears in the Split View button group.
Alternatively, to show only the Timeline view of a project file, you need to do the following:
- Click into the tasks in the Gantt chart view.
- Go to the Task Views button group on the View tab of the MS Project ribbon.
- Select Timeline from the Other Views’ dropdown button.
With MS Project 2016, users can display as many timelines as necessary in a single Timeline view. To add a new timeline to your already created Timeline view, follow the steps below:
- Click on the Format tab and select Timeline Bar to insert a new bar to your existing Timeline view.
- Add items to your new timeline bar by dragging and dropping existing tasks from the initial Timeline view onto the Add tasks with dates to the timeline area.
- To format the new bar to look like a timeline, go to Gantt chart view, right-click, and then choose Timeline from the window that appears next. This will ensure a clean, neat workspace.
- Return to the Format tab and click on Timeline Bar to repeat the steps above as many times as necessary.
If you are using Microsoft Project 2013 or older, you need to create multiple Timeline views to display different sets of tasks in your own project. Here is how to do that:
- Open a new MS Project file.
- Click any View list menu on the Task ribbon and select the More Views item.
- Click the New button from the More Views dialog box that appears. This will open a new dialog box called Define New View.
- At this point, select the Single View option and click the OK button.
- Enter a name for the new view using the Name field of the View Definition dialog box that subsequently shows up.
- Click the Screen pick list and choose Timeline from it.
- Click on the OK button to close the View Definition box, then on the Close button to close the More Views window as well.
To apply the newly created Timeline view, you need to do the following:
- Apply the Gantt chart view, it not already applied.
- Select the View tab to display the View ribbon.
- Tick the Timeline checkbox from the Split View section of the ribbon.
- Click the Timeline dropdown menu on the right side of the checkbox and select your new Timeline view.
Using this technique, you can apply as many Timeline views as you need.