The logic vs. strategy framework: why your project plan needs two distinct layers

Learn why successful project plans separate data logic from strategic communication. A two-layer framework for efficient planning and clear stakeholder updates.
Articles about:
Articles and guides on how to improve visual project management in Excel.
Sort by
Learn why successful project plans separate data logic from strategic communication. A two-layer framework for efficient planning and clear stakeholder updates.
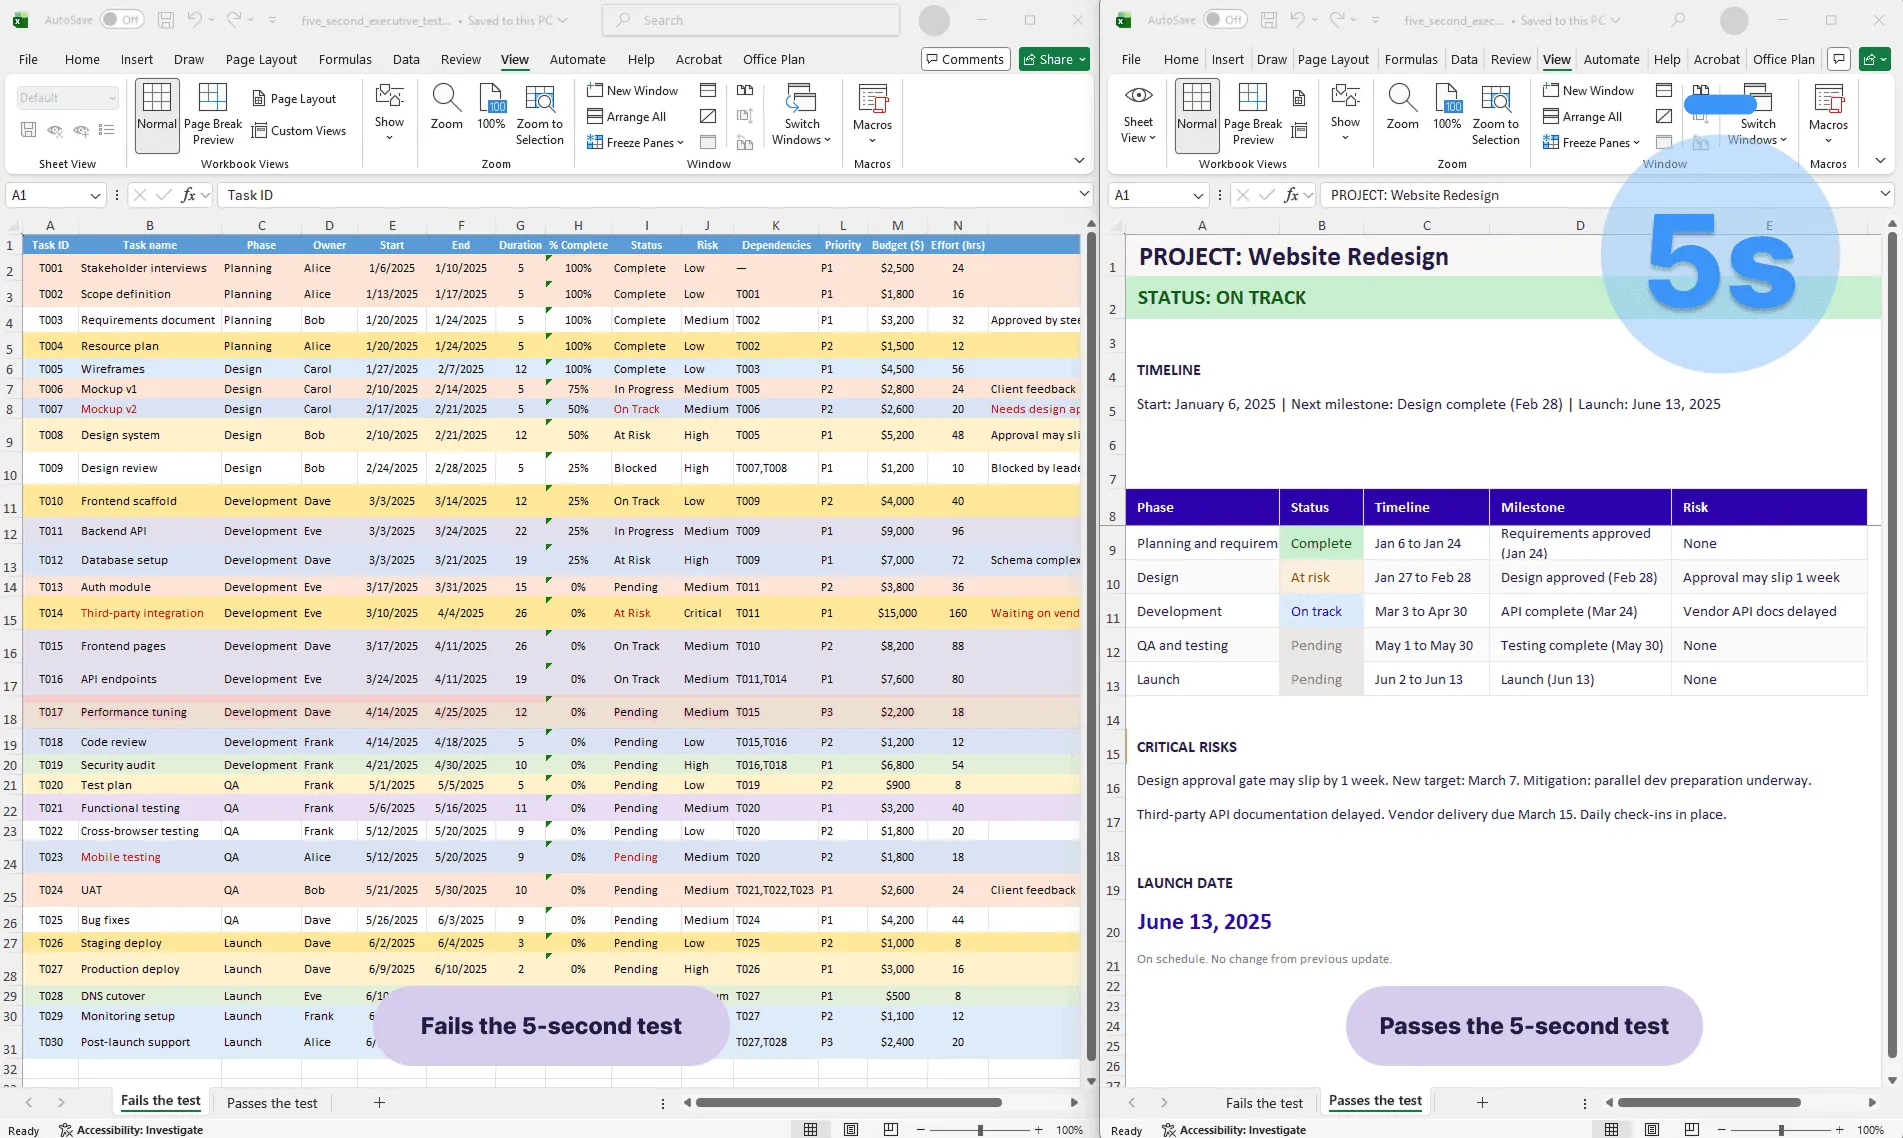
Learn the 5-second executive test for roadmaps and timelines. Create project visuals that communicate status, timeline, and risks instantly.
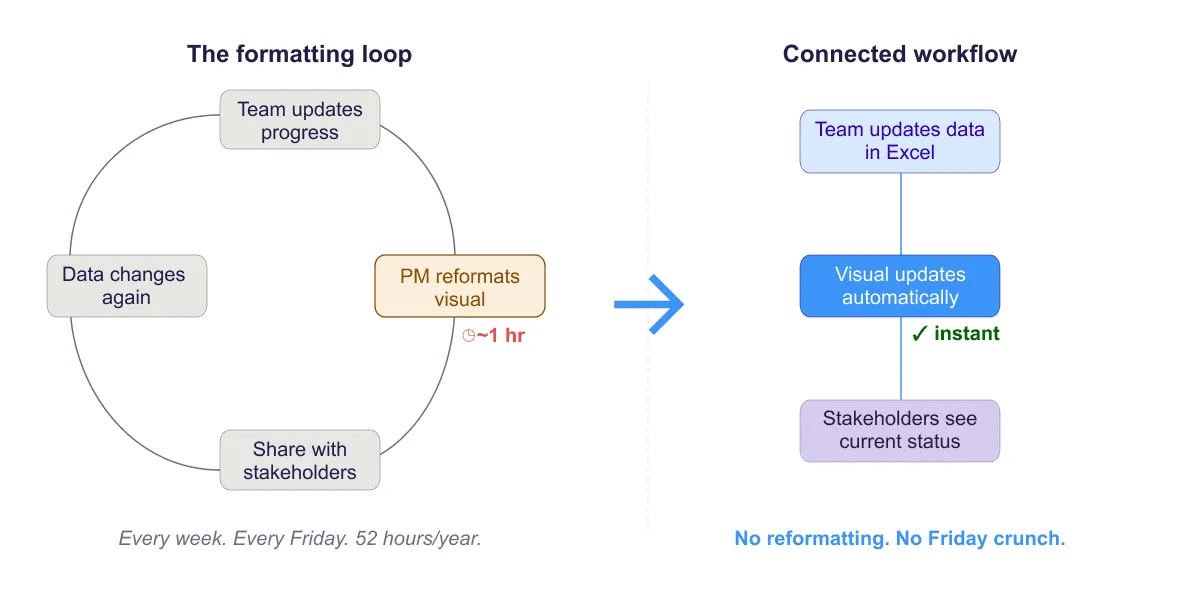
Break the Friday afternoon Excel formatting loop. Strategies to automate status reporting and eliminate repetitive manual visual updates.
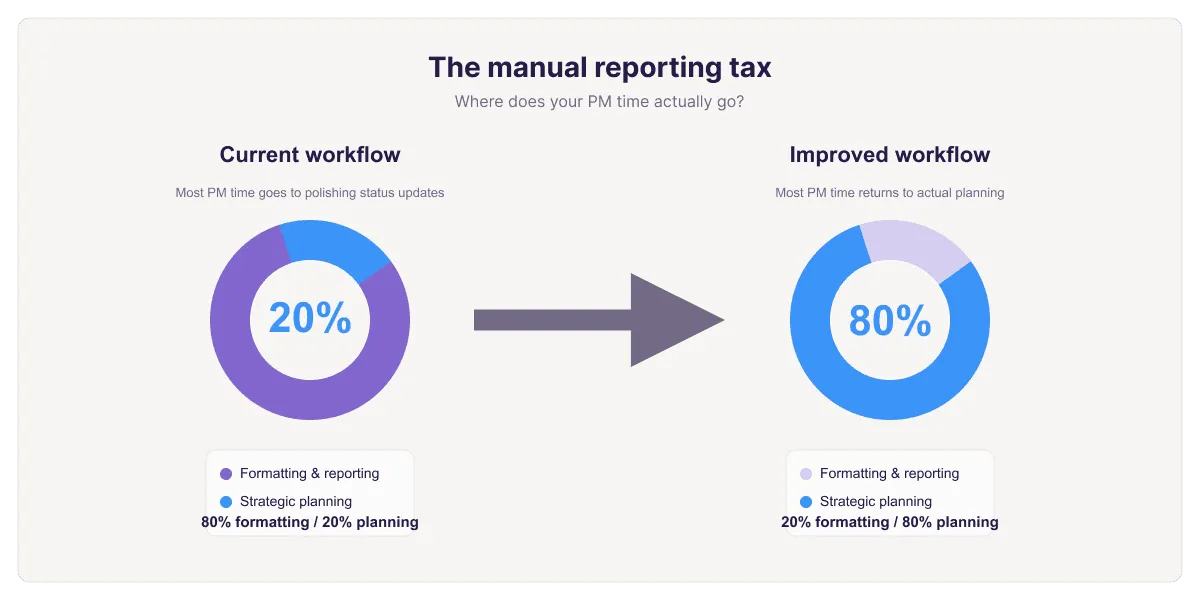
Explore why project managers spend 80% of their time on manual reporting and formatting. Learn the true cost and strategies to reclaim planning time.
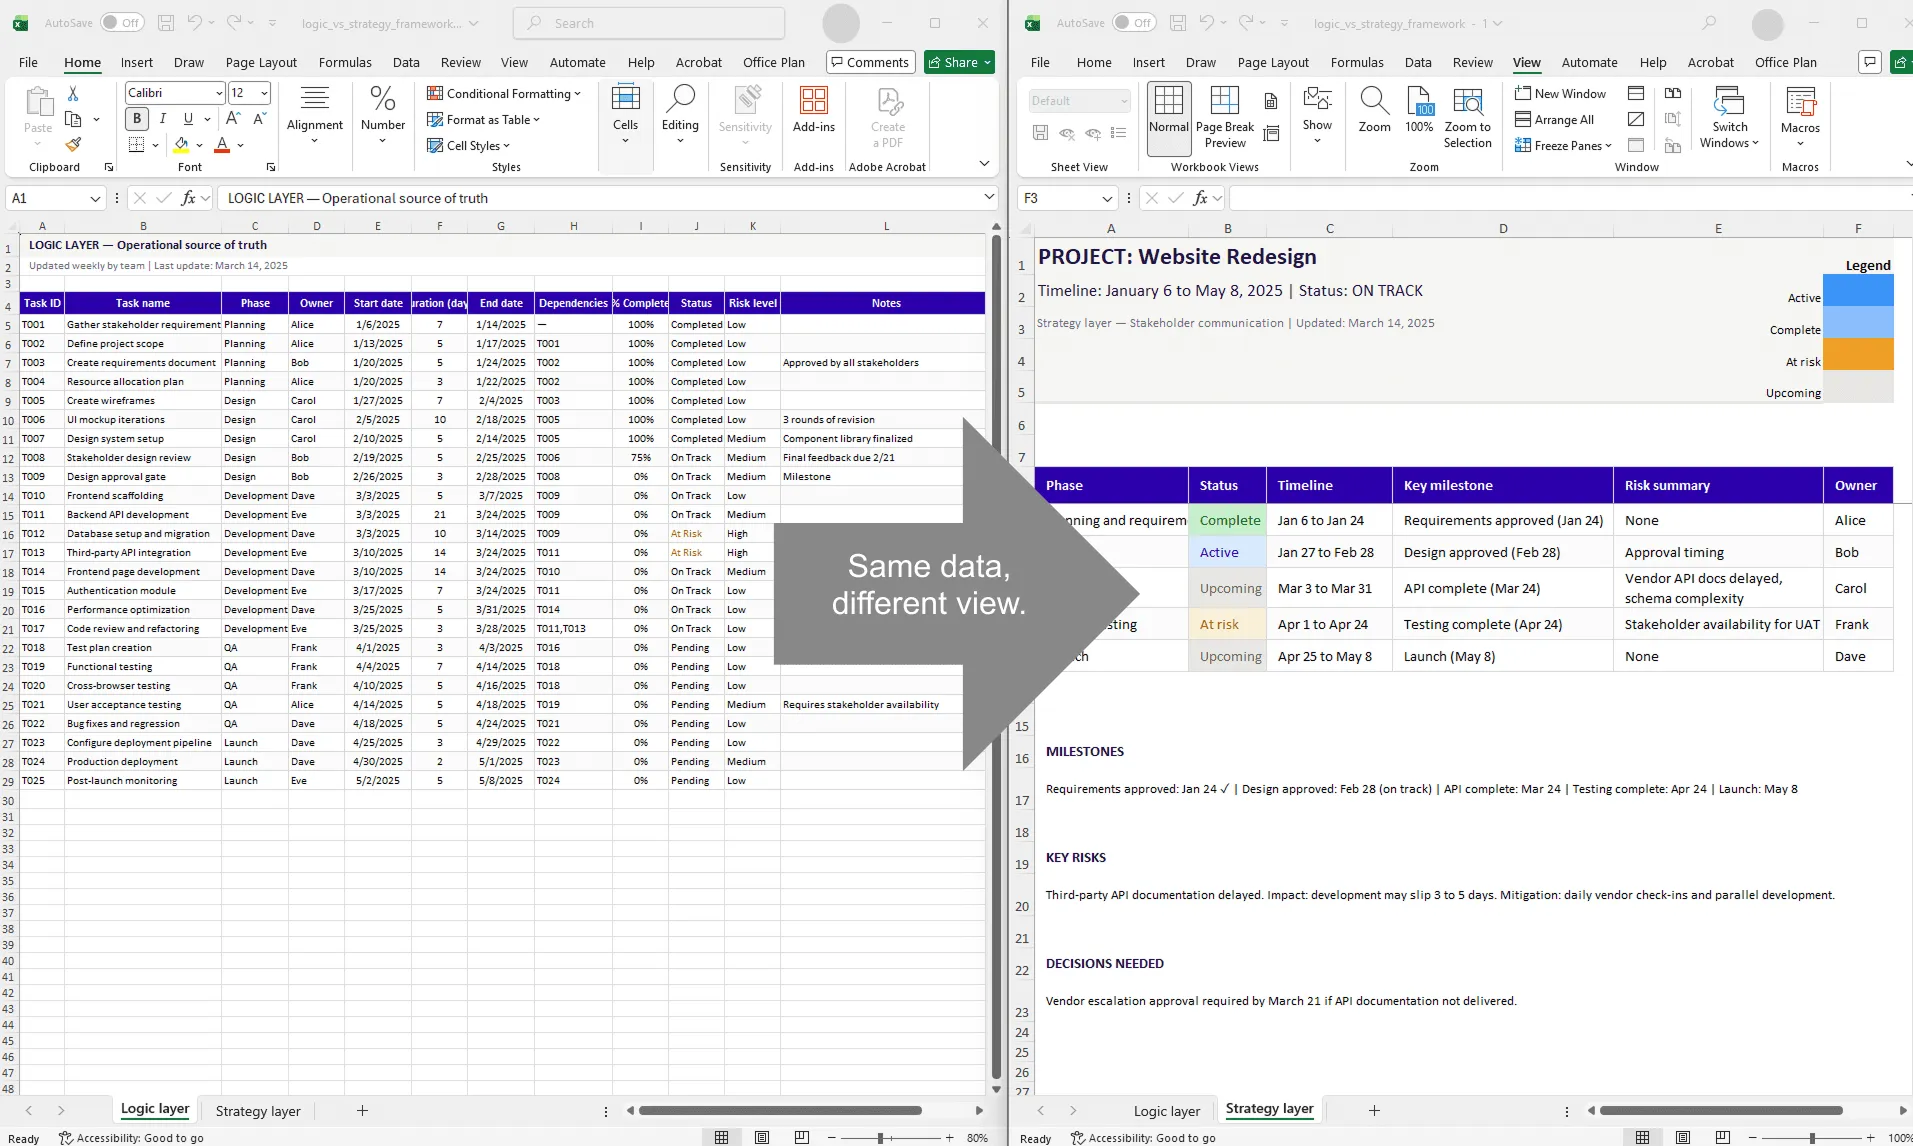
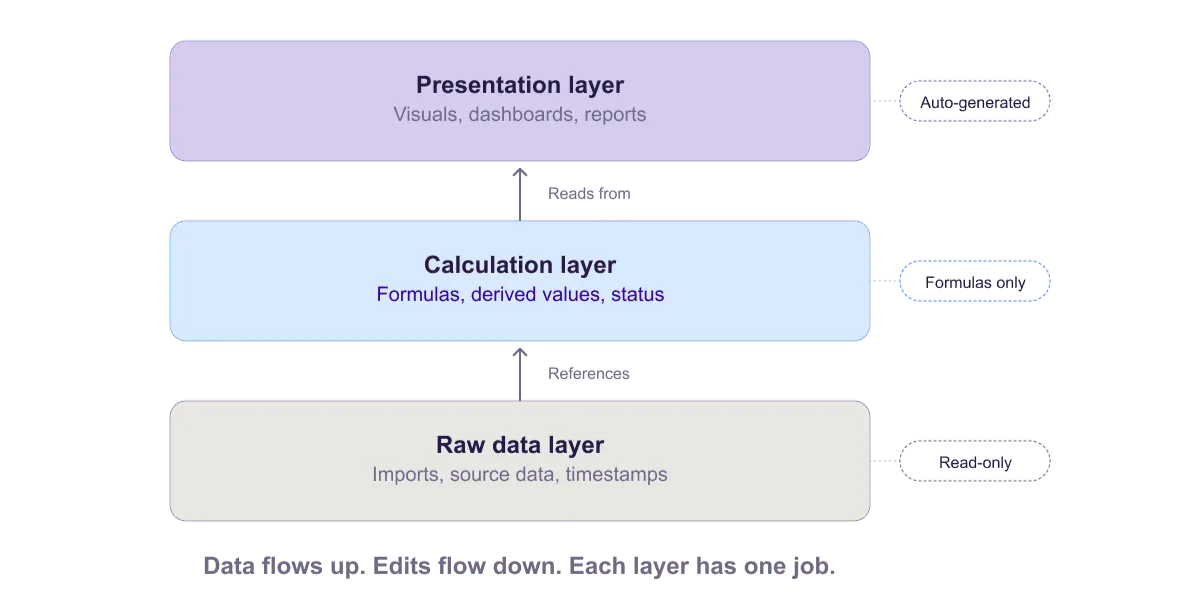
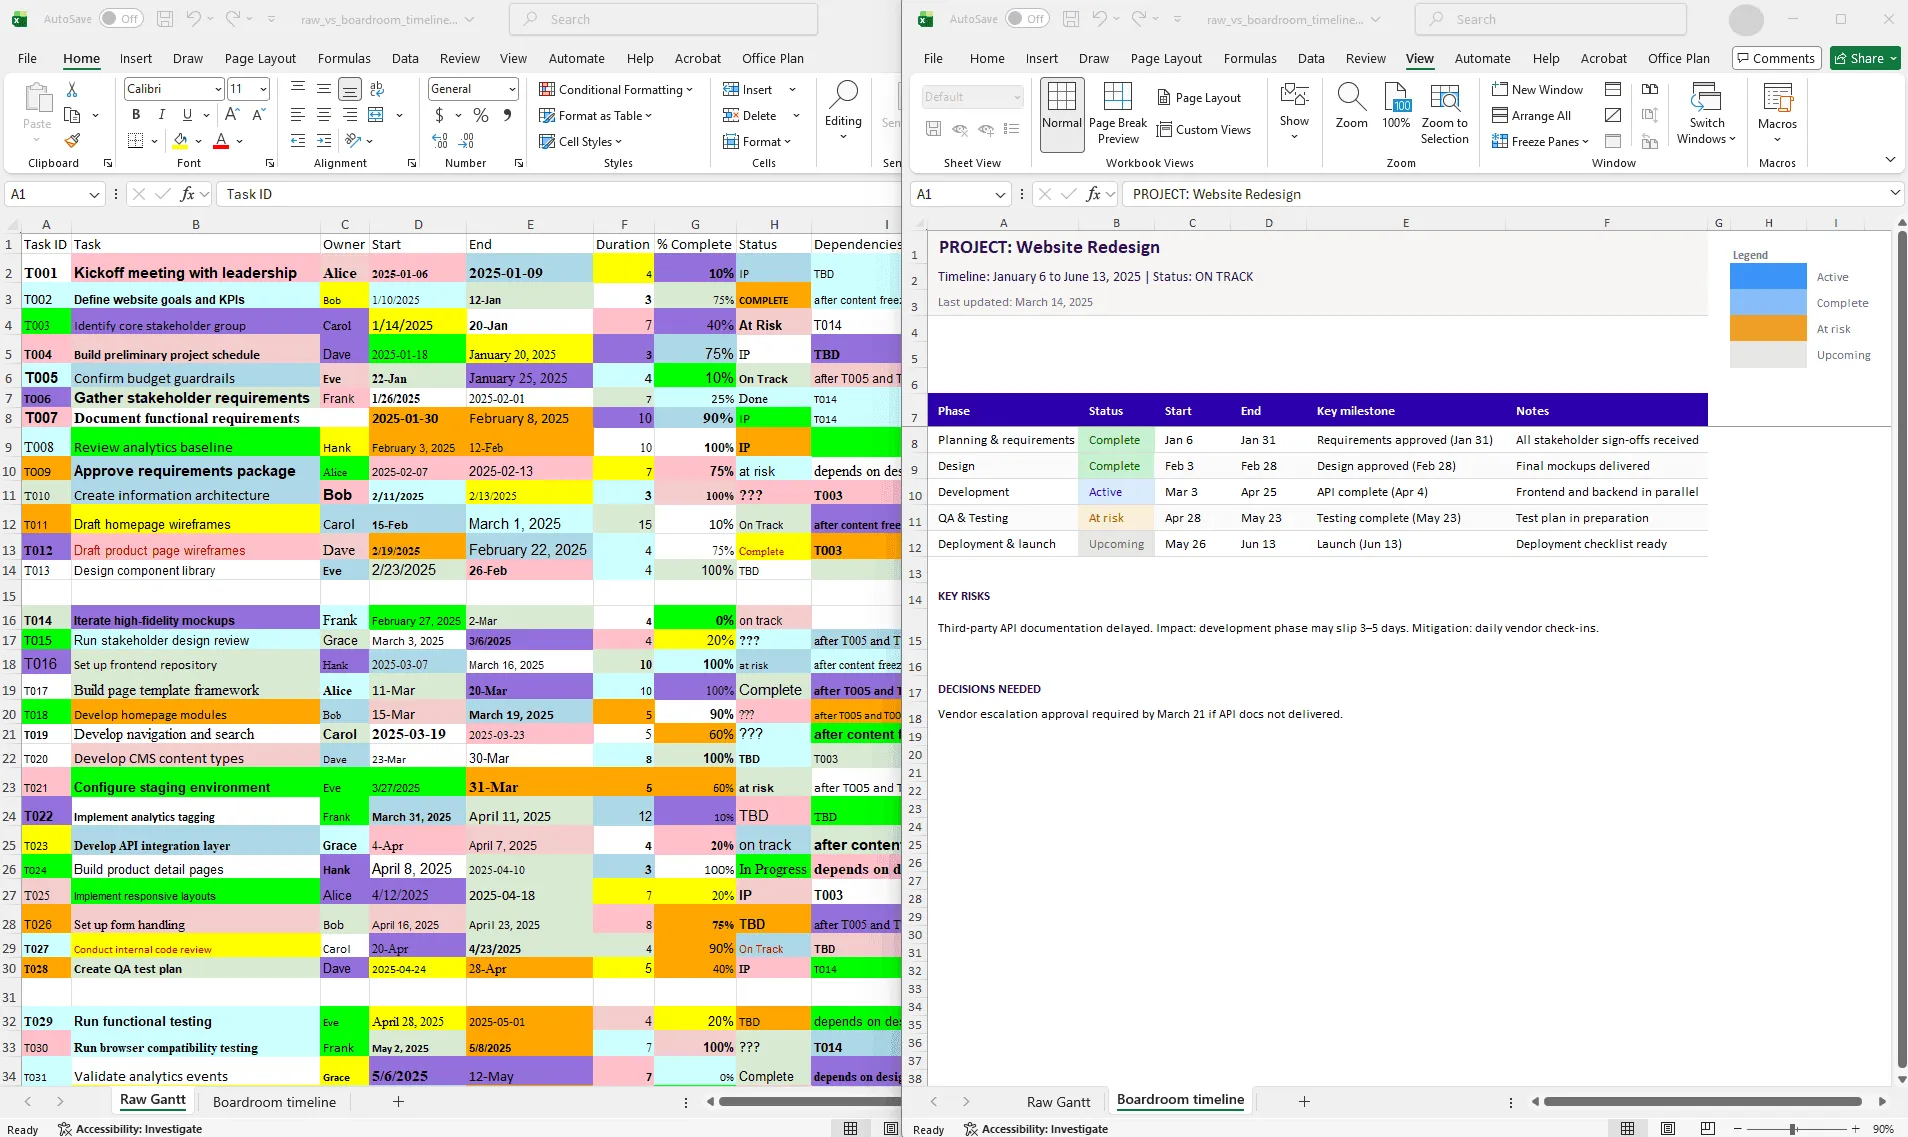
Learn the 3-layer rule for data integrity in Excel project plans. Keep raw data untouched, use calculation layers, and present in a separate layer.
Learn why visual polish matters for project credibility. Discover how to transform raw Excel data into professional timeline visuals that signal control and competence.
Learn to build an Excel project tracker with essential columns, automatic formulas, and dashboard summaries that keep projects on track.
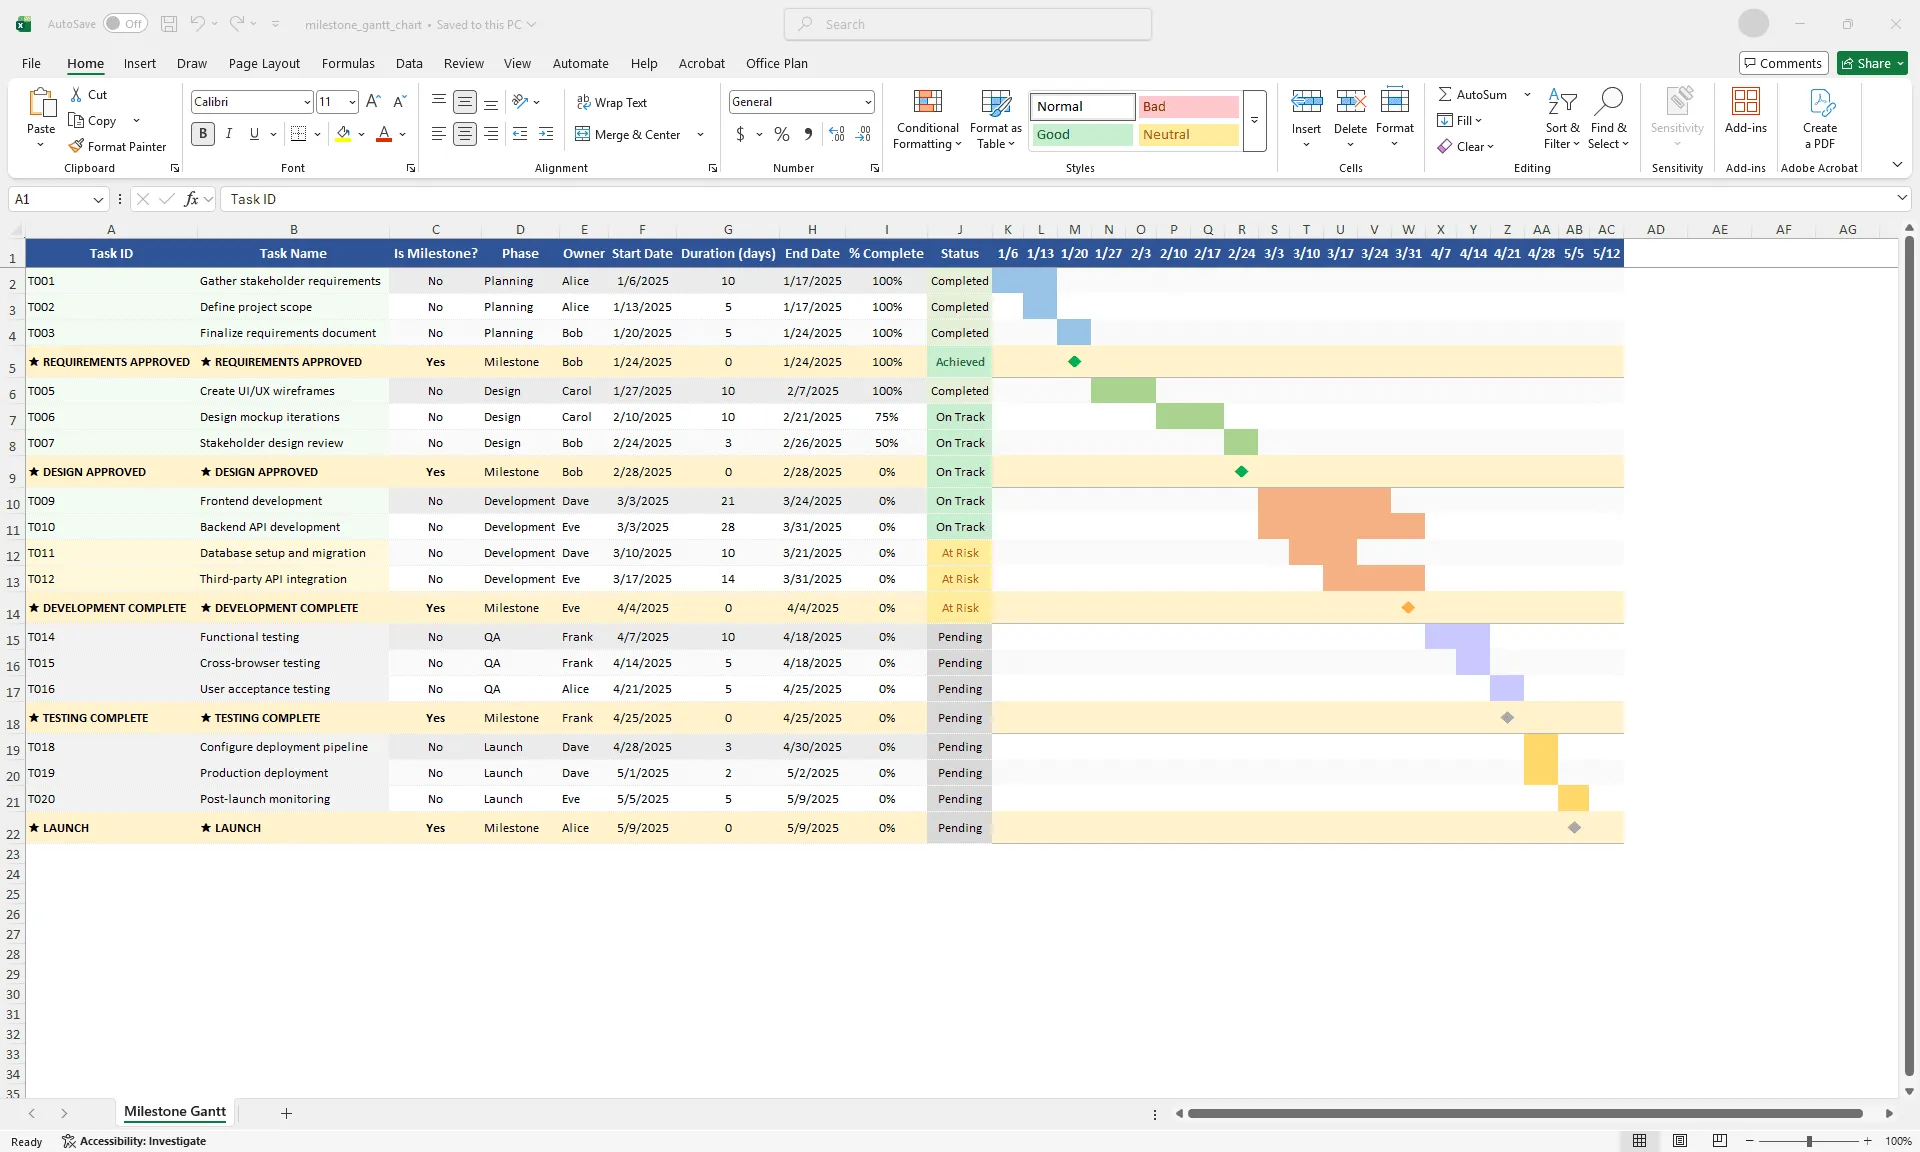
Learn how to highlight and track important project milestones in Excel Gantt charts. Use color-coding and visual indicators to communicate key deliverable dates.
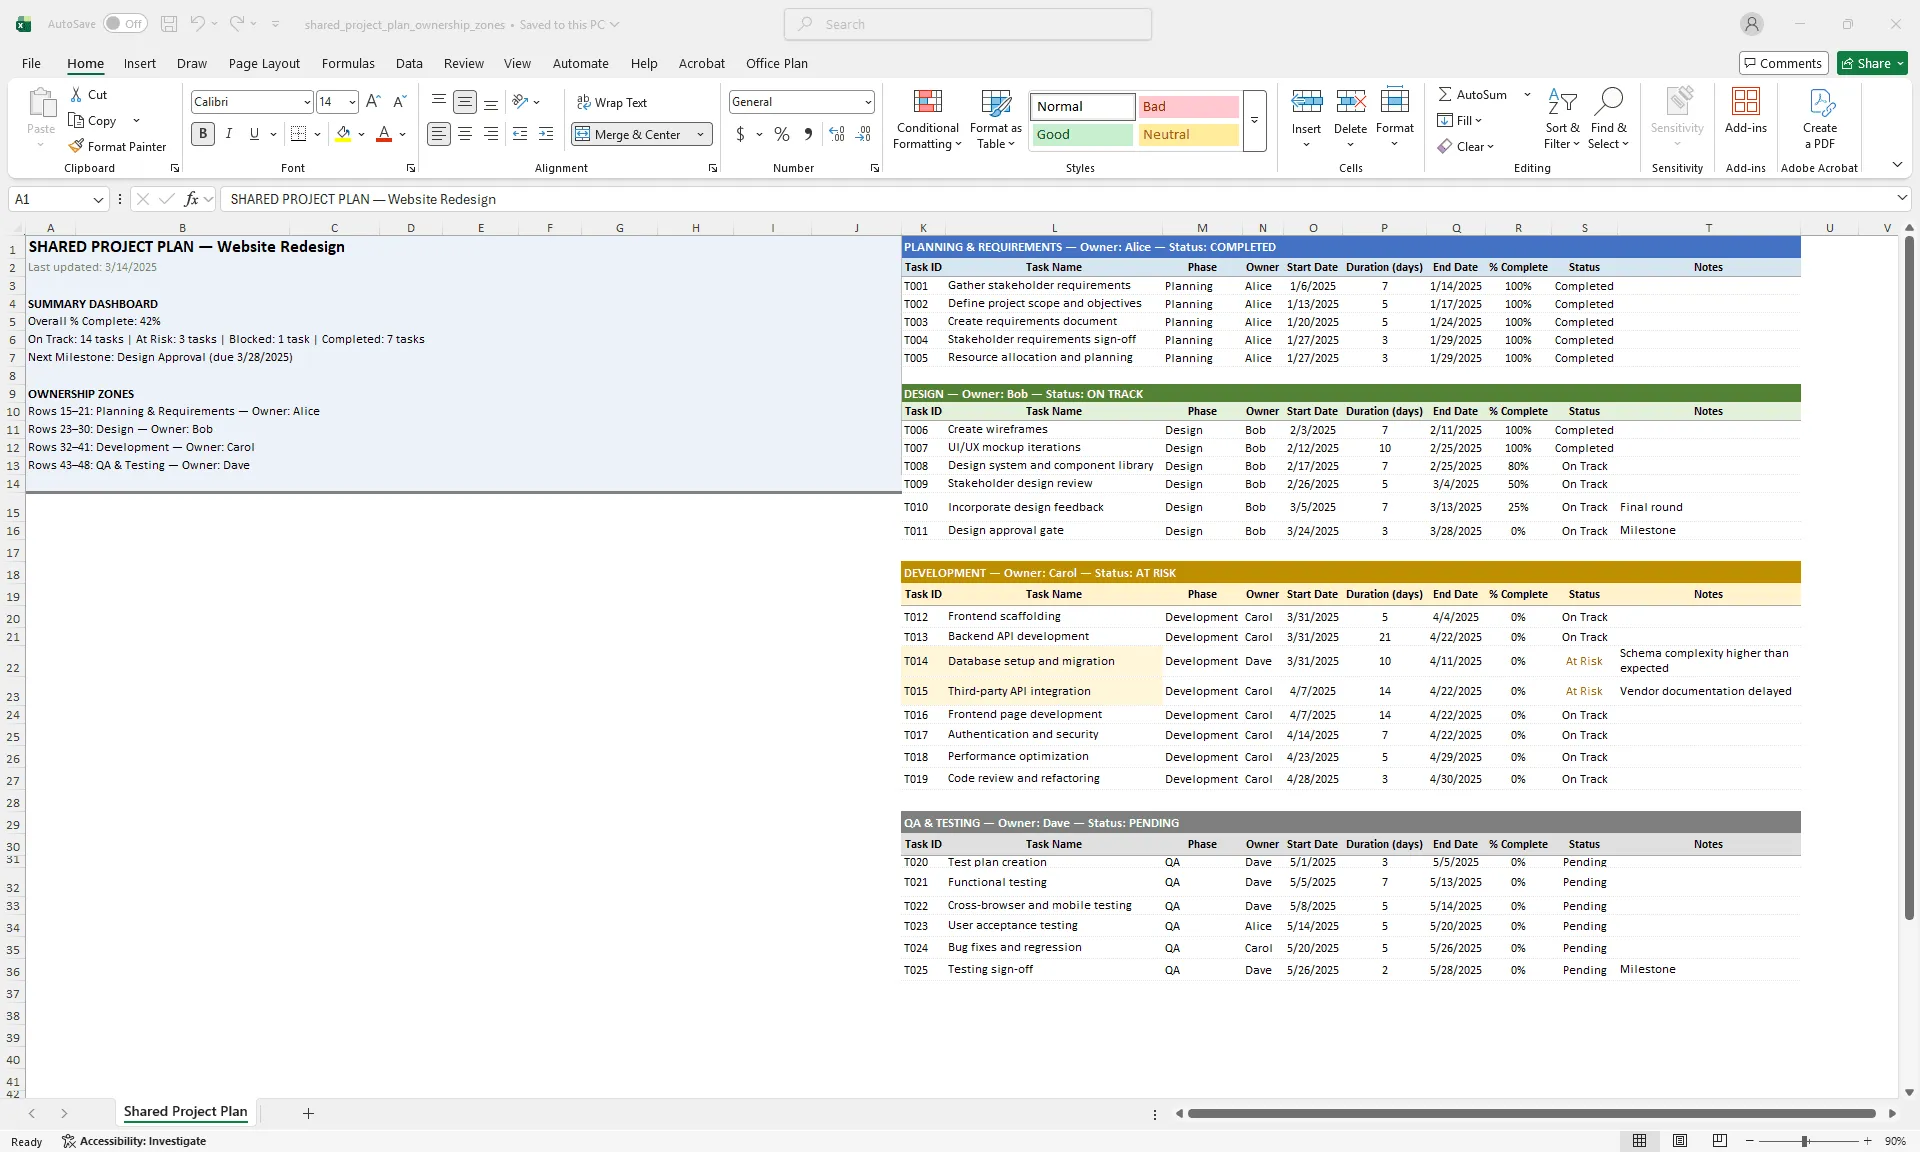
Learn best practices for managing a shared Excel project plan across multiple team members. Avoid conflicts, protect data, and maintain version control.
Get all the tips, tricks and inspiration you need to create professional looking timelines, straight to your inbox.

Create impressive project visuals that showcase your work to clients and managers.