The manual reporting tax: why PMOs spend 80% of their time formatting and 20% planning
Explore why project managers spend 80% of their time on manual reporting and formatting. Learn the true cost and strategies to reclaim planning time.

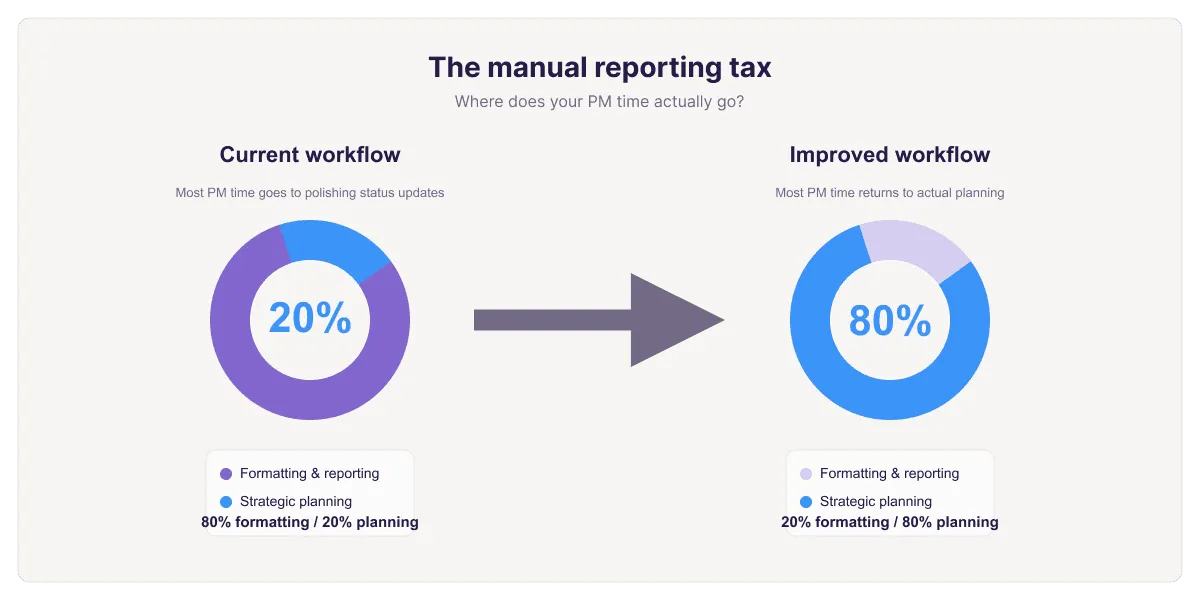
"Side-by-side comparison showing PM time allocation: current workflow with 80% spent on formatting and 20% on planning versus improved workflow with 80% on planning and 20% on formatting.
Quick answer
The "Manual Reporting Tax" is the phenomenon where project managers spend 80% of their time on mechanical reporting tasks (formatting, updating, consolidating data) and only 20% on actual project leadership (risk management, stakeholder communication, strategic planning). The root cause is spreadsheet-based project tracking that separates data from visuals, forcing PMs into repetitive formatting work instead of strategic thinking.
Introduction
You became a project manager to lead teams, manage risks, and drive projects to success. Instead, you're spending 15 hours per week formatting spreadsheets.
Wednesday afternoon, you're consolidating status updates from five team leads into one master project plan. Friday morning, you're adjusting Gantt bars to reflect new percent complete values. Friday afternoon, you're rebuilding the visual because someone changed the status definitions. Monday morning, you're doing it all again.
This is the Manual Reporting Tax. It's the cumulative cost of maintaining project plans in tools that demand manual work for every status update, every data change, every visual refresh.
The trap is insidious because it looks legitimate. You're "reporting" on the project, which sounds like PM work. But it's not. It's mechanical busywork that prevents you from doing actual project leadership.
This guide examines the true scope of the reporting tax, quantifies its cost, and explores how to reclaim your planning time.
Defining the manual reporting tax
The Manual Reporting Tax is the percentage of PM time consumed by mechanical reporting tasks: work that doesn't require judgment, leadership, or strategic thinking, but that your tools require you to do anyway.
Tasks included in the reporting tax:
- Copying data from timesheets into the master plan
- Updating percent complete fields based on verbal status updates
- Adjusting Gantt bar colors to reflect current status
- Recalculating rolled-up metrics (phase percent complete, days to milestone)
- Reformatting charts when data or definitions change
- Merging updates from multiple team leads into one plan
- Rebuilding visuals every time the underlying data shifts
- Maintaining multiple disconnected versions (internal plan, executive summary, team dashboard)
Tasks NOT included (actual PM work):
- Analyzing risks and mitigation strategies
- Making trade-off decisions (scope vs. timeline vs. resources)
- Communicating with stakeholders about status and risks
- Problem-solving blockers and dependencies
- Planning resource allocation
- Facilitating team synchronization
The distinction is clear: one is mechanical, the other requires judgment. The reporting tax steals time from the work that actually moves projects forward.
How much time PMs actually spend on reporting
Industry research (PMI, Capterra, various PM surveys) consistently shows:
- Average PM spends 13–16 hours per week on status reporting
- Of that, 10–12 hours is mechanical formatting and data consolidation
- Only 3–4 hours is actual analytical and communication work
On a 40-hour work week, that's 25–40% of total time lost to the reporting tax. For PMOs managing multiple projects, it's higher, often 50–60%.
Extrapolated:
- Per year: 520–624 hours of mechanical reporting work per PM
- In dollars: If a PM costs $80K/year (roughly $40/hour loaded), that's $21K–$25K in annual reporting overhead per PM
- For a 10-person PMO: $210K–$250K in pure reporting tax
This isn't a rounding error. This is expensive talent doing work that could be automated.
The opportunity cost of the reporting tax
The direct cost is significant. The opportunity cost is deeper.
Risk management doesn't happen. A competent PM can identify and mitigate risks before they become crises. But if the PM is reformatting charts Friday afternoon, they're not analyzing whether design phase risks are being addressed. Risks become crises. Projects slip. Escalations increase.
Stakeholder communication becomes reactive. Instead of identifying concerns early and addressing them proactively, the PM is consolidating data from five sources. By the time the report is ready, the window for proactive communication has closed.
Resource optimization gets skipped. A PM with time to think can identify bottlenecks, rebalance workloads, and optimize team allocation. Without that thinking time, teams become overallocated, burnout increases, and quality suffers quietly.
Strategic planning becomes reactive. If a project has 3 months remaining and the PM has bandwidth to think, they can design the final phase strategically. If they're stuck in the reporting tax, final phase planning is compressed and suboptimal.
The reporting tax doesn't just waste time. It erodes the visibility and strategic clarity that projects depend on.
Why traditional Excel workflows perpetuate the tax
The reporting tax isn't inevitable. It's structural. The tools most PMs use were never designed for automated reporting. They assume manual work at every step.
Data and visuals are disconnected. In Excel, data (percent complete: 75%) and visuals (Gantt bar at 75% length) are separate things. When data changes, the visual doesn't follow. You have to manually update it. This alone is hours per week.
No integration with other systems. Team members track time in one system, update status in another, log risks in a third. Excel doesn't connect to these systems. You manually copy and paste data from multiple sources. For a 20-task project pulling from 3 sources, that's hours of copy-paste work per week.
No built-in rollups or summarization. To calculate phase percent complete, you manually aggregate task data. To create an executive summary, you manually copy key data into a new sheet. To merge updates from multiple team leads, you manually consolidate rows. All formula-heavy busywork.
Chart updates are manual. When you create a Gantt chart in Excel, it's a snapshot of the data at that moment. When data changes, the chart doesn't update. You regenerate it. For weekly updates, this means hours of chart recreation work.
Weak permission controls. Excel doesn't let you say "this person can edit Tasks 1–5 but not formulas or structural changes." So either everyone has edit access (and breaks things), or the PM controls all editing (and becomes a bottleneck). Either way, the PM ends up doing manual consolidation.
These aren't bugs. They're limitations of a tool designed for individual analysis being stretched to do collaborative project management.
Three strategies to reclaim planning time
If you're caught in the reporting tax, here's how to escape:
Strategy 1: ruthlessly automate data consolidation
Stop manually copying data from multiple sources. Use tools or scripts to auto-consolidate:
Power Query (within Excel): Set up automated imports from your timesheet system, task tracker, and other sources. Consolidate with one click. Eliminates hours of manual copy-paste per week.
Workflow automation (Zapier, Power Automate): When someone logs time in System A, automatically update System B. Eliminates manual data transfer between systems entirely.
Custom scripts (for technical teams): Python or similar to automatically consolidate data from multiple sources. Run weekly, outputs a consolidated project plan.
Strategy 2: connect your data to your visuals
The biggest time sink in the reporting tax is maintaining visuals that are disconnected from data. Every time the data changes, you rebuild the visual. Every week, that's hours lost.
The solution: keep your project data in Excel and use a tool that generates the visual layer directly from that data.
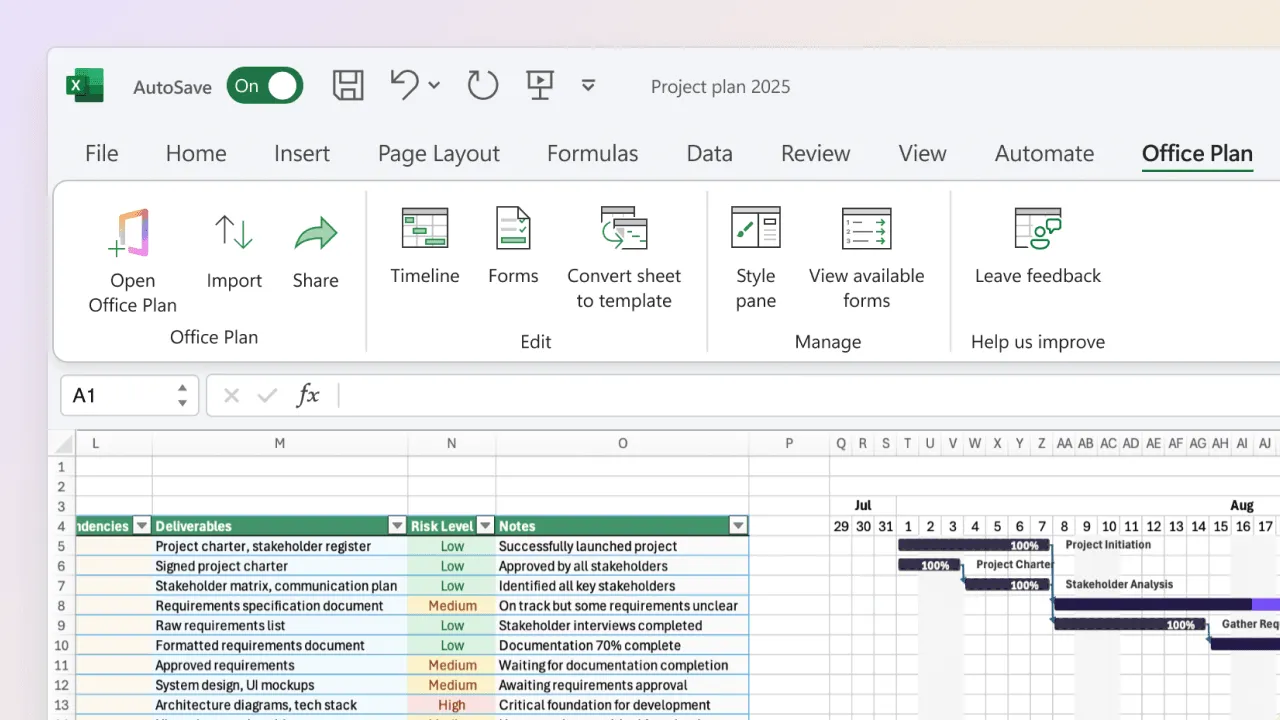
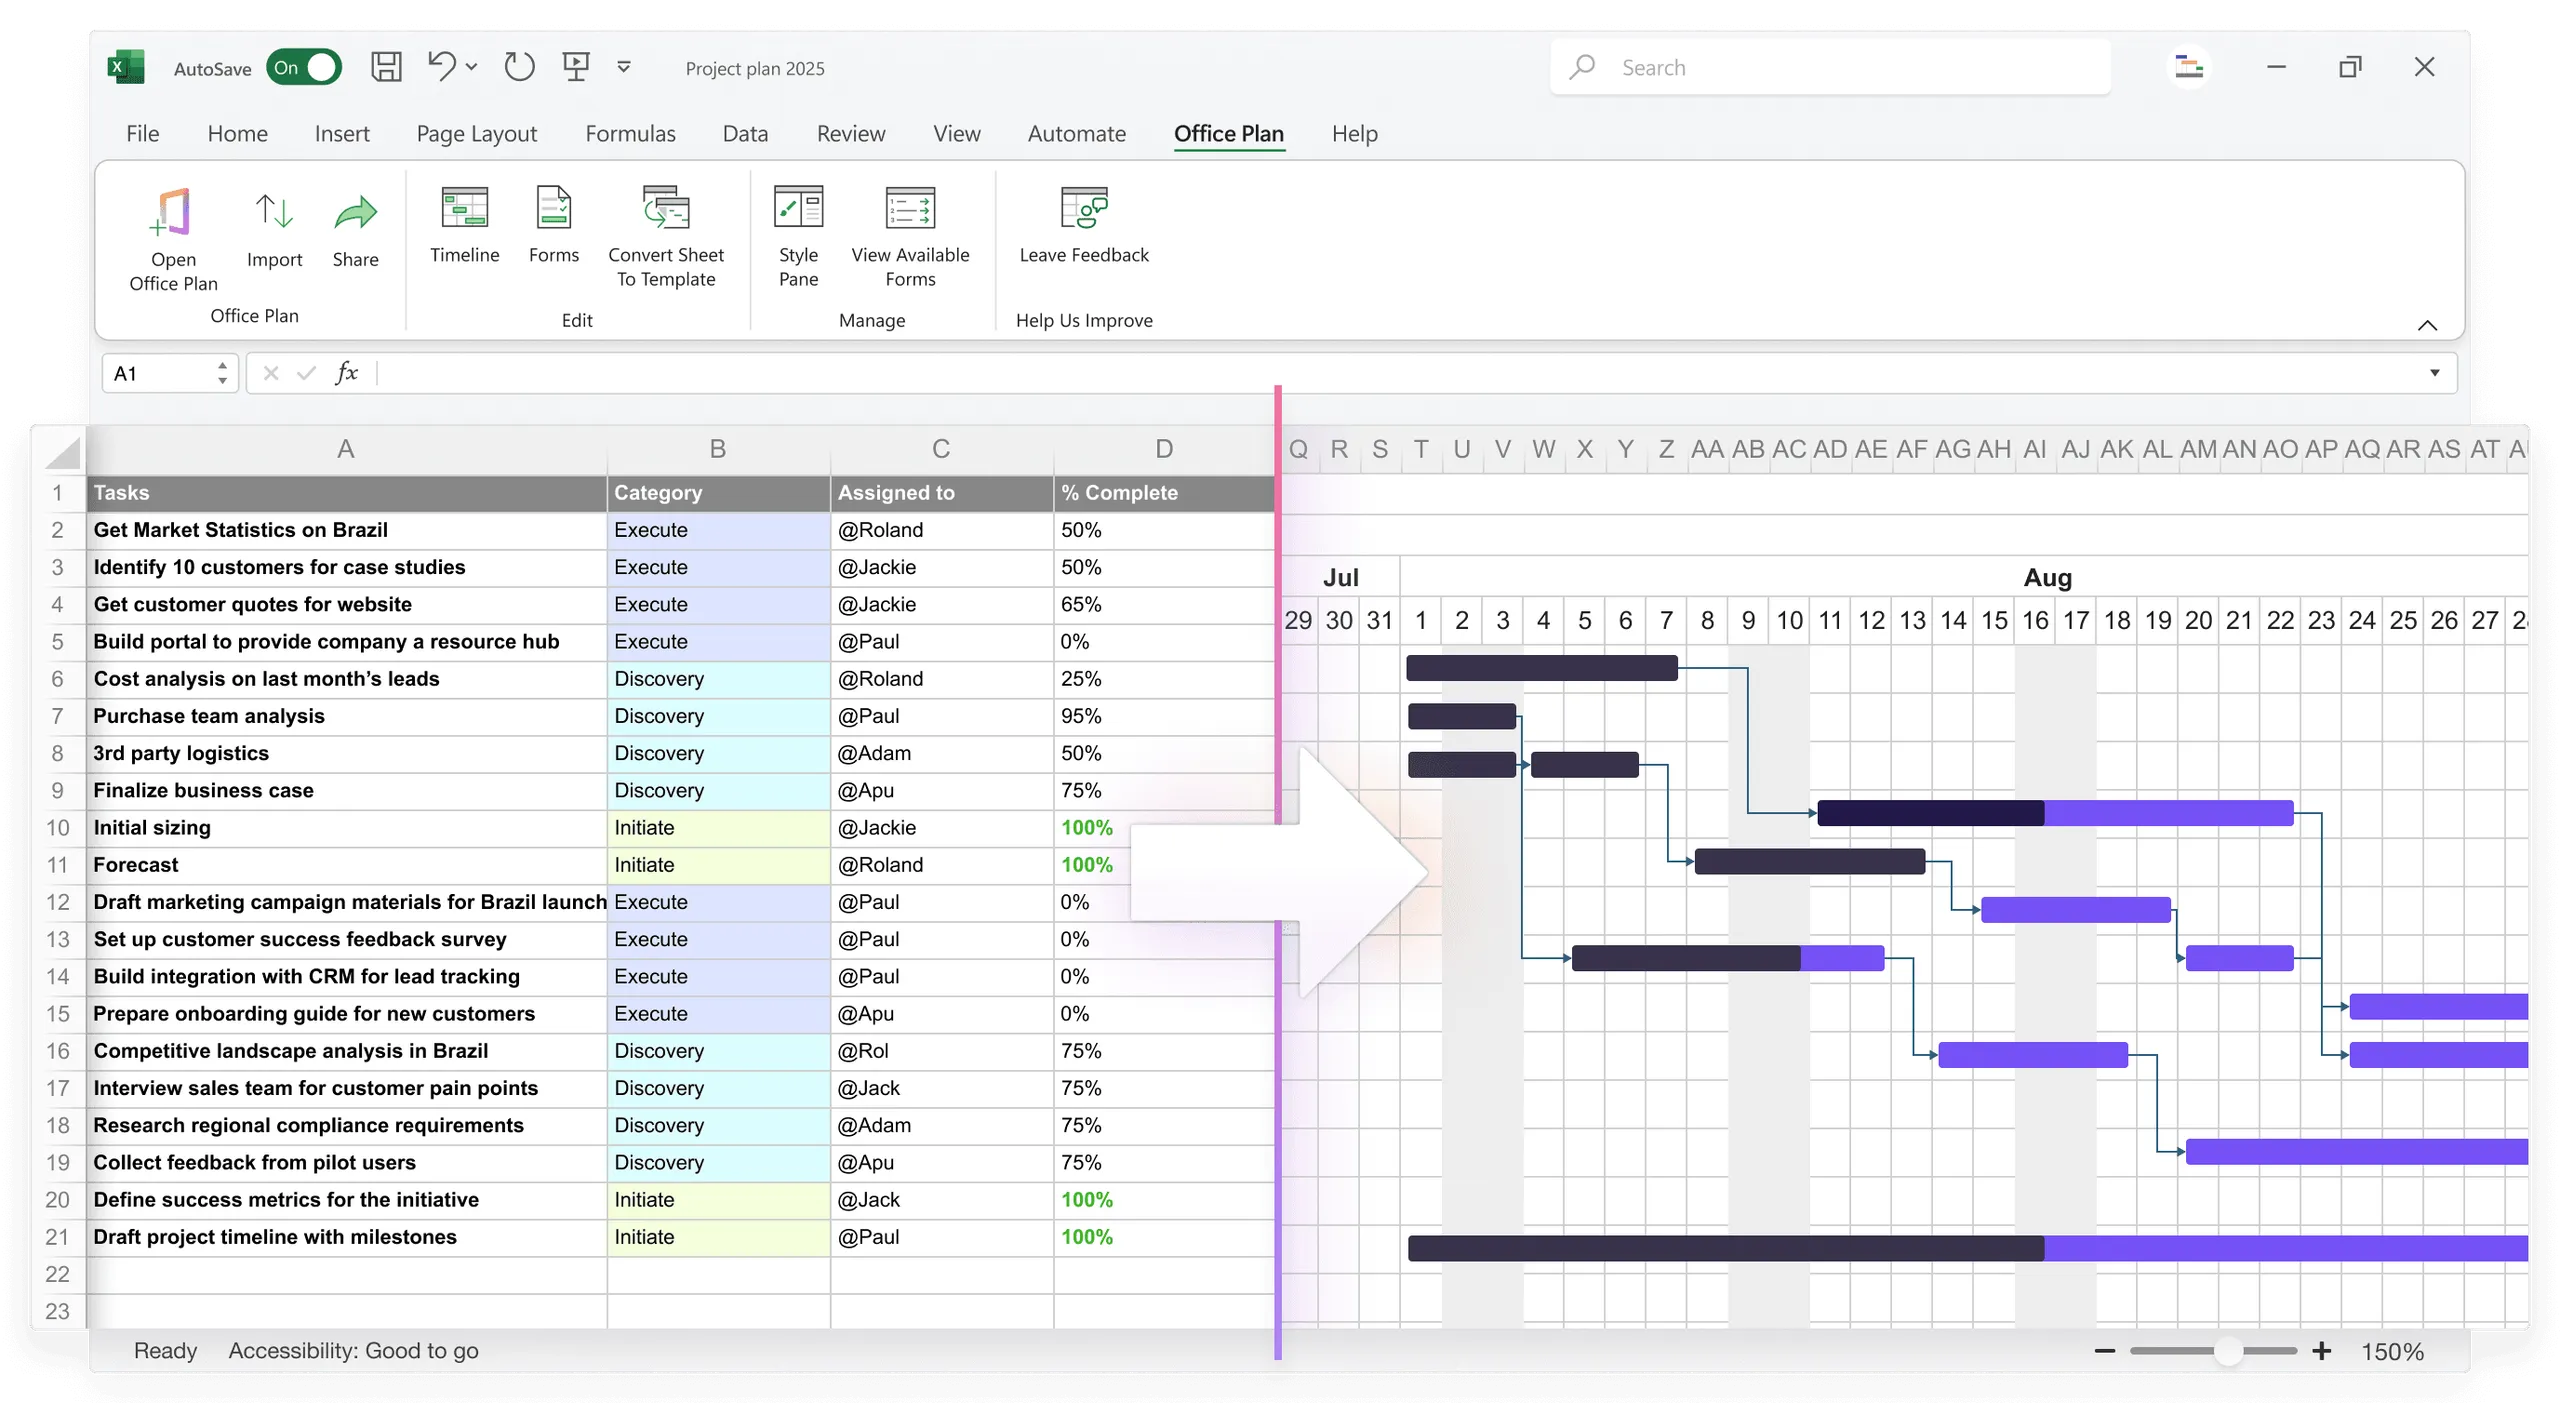
Office Plan does exactly this. It's an Excel add-in that reads your project data (tasks, dates, percent complete, milestones, status) and generates a professional Gantt chart or timeline right inside your spreadsheet. When the data changes, the visual updates. No rebuilding, no reformatting, no maintaining a separate presentation file.
This eliminates one of the largest components of the reporting tax: the weekly cycle of regenerating visuals from updated data. Your operational plan and your stakeholder-facing visual live in the same place, drawing from the same source of truth.
Strategy 3: move to tools built for automation
If Excel is the constraint across the board, consider tools designed for automated project reporting:
- Microsoft Project (with automated reporting)
- Asana (visual timeline, auto-updating)
- Monday.com (automation and visual outputs)
- Smartsheet (with Power Automate integration)
The key trait: tools designed to eliminate the manual consolidation and formatting work. For small teams (5–10 people) that want to stay in Excel, Strategy 2 (connecting data to visuals with an add-in) often provides the best balance of familiarity and time savings.
What a better reporting workflow looks like
Here's the difference in practice:
Current (Excel-based, manual):
- Monday: Team members update status in Slack, email, various systems
- Tuesday through Thursday: PM consolidates, reformats, recalculates (6–8 hours)
- Friday: Rebuild visuals, adjust colors, review (3 hours)
- Total manual work: 9–11 hours. Strategic time: 1–2 hours.
Improved (connected data and visuals):
- Monday: Team members update status in the shared Excel project plan
- Tuesday morning: PM reviews auto-updated dashboard and visual (15 minutes)
- Tuesday through Friday: PM does actual PM work: risk analysis, stakeholder communication, problem-solving (20+ hours)
- Friday: Visual is already current from the week's data updates (0 minutes)
- Total manual work: under 1 hour. Strategic time: 20+ hours.
This isn't hypothetical. Teams that connect their data to their visuals and automate consolidation report spending 5–8 hours per week on reporting (down from 15), freeing up 7–10 hours for strategic PM work.
What happens when you reclaim planning time
The results are measurable:
Better risk management. Risks are identified early and mitigated proactively instead of becoming crises that require escalation.
Stronger stakeholder relationships. PMs communicate regularly and thoughtfully instead of scrambling with last-minute status updates.
Improved team morale. Teams see the PM engaging strategically instead of being buried in spreadsheets. It signals that planning is taken seriously.
Better project outcomes. More time on strategic thinking leads to better decisions, fewer surprises, and on-time delivery.
Higher PM satisfaction. PMs report significantly higher job satisfaction when they're doing leadership work instead of mechanical work.
Frequently asked questions
Partially. A well-structured Excel setup (with formulas, templates, and automation) can reduce the tax by 30–40%. But it can't eliminate it entirely. The core issue is the disconnect between data and visuals, which requires a tool that connects them.
Yes, some is. But not 80%. Industry best practice is 10–20% reporting overhead, 80% strategic work. If you're spending 80% on reporting, something's wrong with your tools or processes.
It depends on project complexity and team size. For small teams (5–10 people) that already work in Excel, an add-in like Office Plan can eliminate the visual formatting tax while keeping the familiar workflow. For larger teams or multiple projects, dedicated PM tools (Monday, Asana, Smartsheet) are worth the investment.
You can reduce it by 30–40% with better Excel practices, templates, and formula automation. Adding an Excel add-in like Office Plan can reduce it further by eliminating the visual rebuild cycle. Full elimination across data consolidation, reporting, and collaboration typically requires a dedicated PM tool.
Quantify the cost: 80% of PM time × PM salary × number of PMs = annual reporting overhead. Compare that to the tool cost. Most tools pay for themselves within 6–12 months in reclaimed time alone, not counting improved project outcomes.
Most modern PM tools have gentler learning curves than Excel. Asana, Monday, Smartsheet: 2–4 weeks to competency. Microsoft Project: 4–8 weeks. An Excel add-in like Office Plan has virtually no learning curve because it works inside the tool your team already knows.
Key takeaways
- The Manual Reporting Tax is the 80% of PM time spent on mechanical formatting, consolidation, and visual rebuilding, leaving only 20% for actual project leadership.
- Average PMs spend 13–16 hours per week on reporting. Of that, 10–12 hours is purely mechanical. This costs $21K–$25K per PM annually in direct overhead.
- The opportunity cost is deeper: risks go unmanaged, stakeholder communication becomes reactive, and strategic planning gets compressed.
- The root cause is structural. Excel separates data from visuals, requiring manual work every time either one changes.
- Three strategies to reclaim time: automate data consolidation, connect your data to your visuals (tools like Office Plan eliminate the weekly visual rebuild), and move to tools built for automation.
- The payoff is significant. Teams that eliminate the reporting tax free up 7–10 hours per week per PM for actual strategic project leadership.
- Better outcomes follow: proactive risk management, stronger stakeholder communication, higher team morale, and improved on-time delivery.
Project management tips and tricks
Stop spending Friday afternoon on formatting
The Manual Reporting Tax costs your PMO thousands of hours per year. Most of that time goes to one thing: rebuilding visuals from data that's already in Excel. Office Plan eliminates that cycle. It connects your project data to a professional visual layer right inside Excel. When data changes, the visual stays current. No rebuilding. No reformatting. No separate file to maintain. Reclaim your planning time for the work that actually moves projects forward.