The logic vs. strategy framework: why your project plan needs two distinct layers
Learn why successful project plans separate data logic from strategic communication. A two-layer framework for efficient planning and clear stakeholder updates.

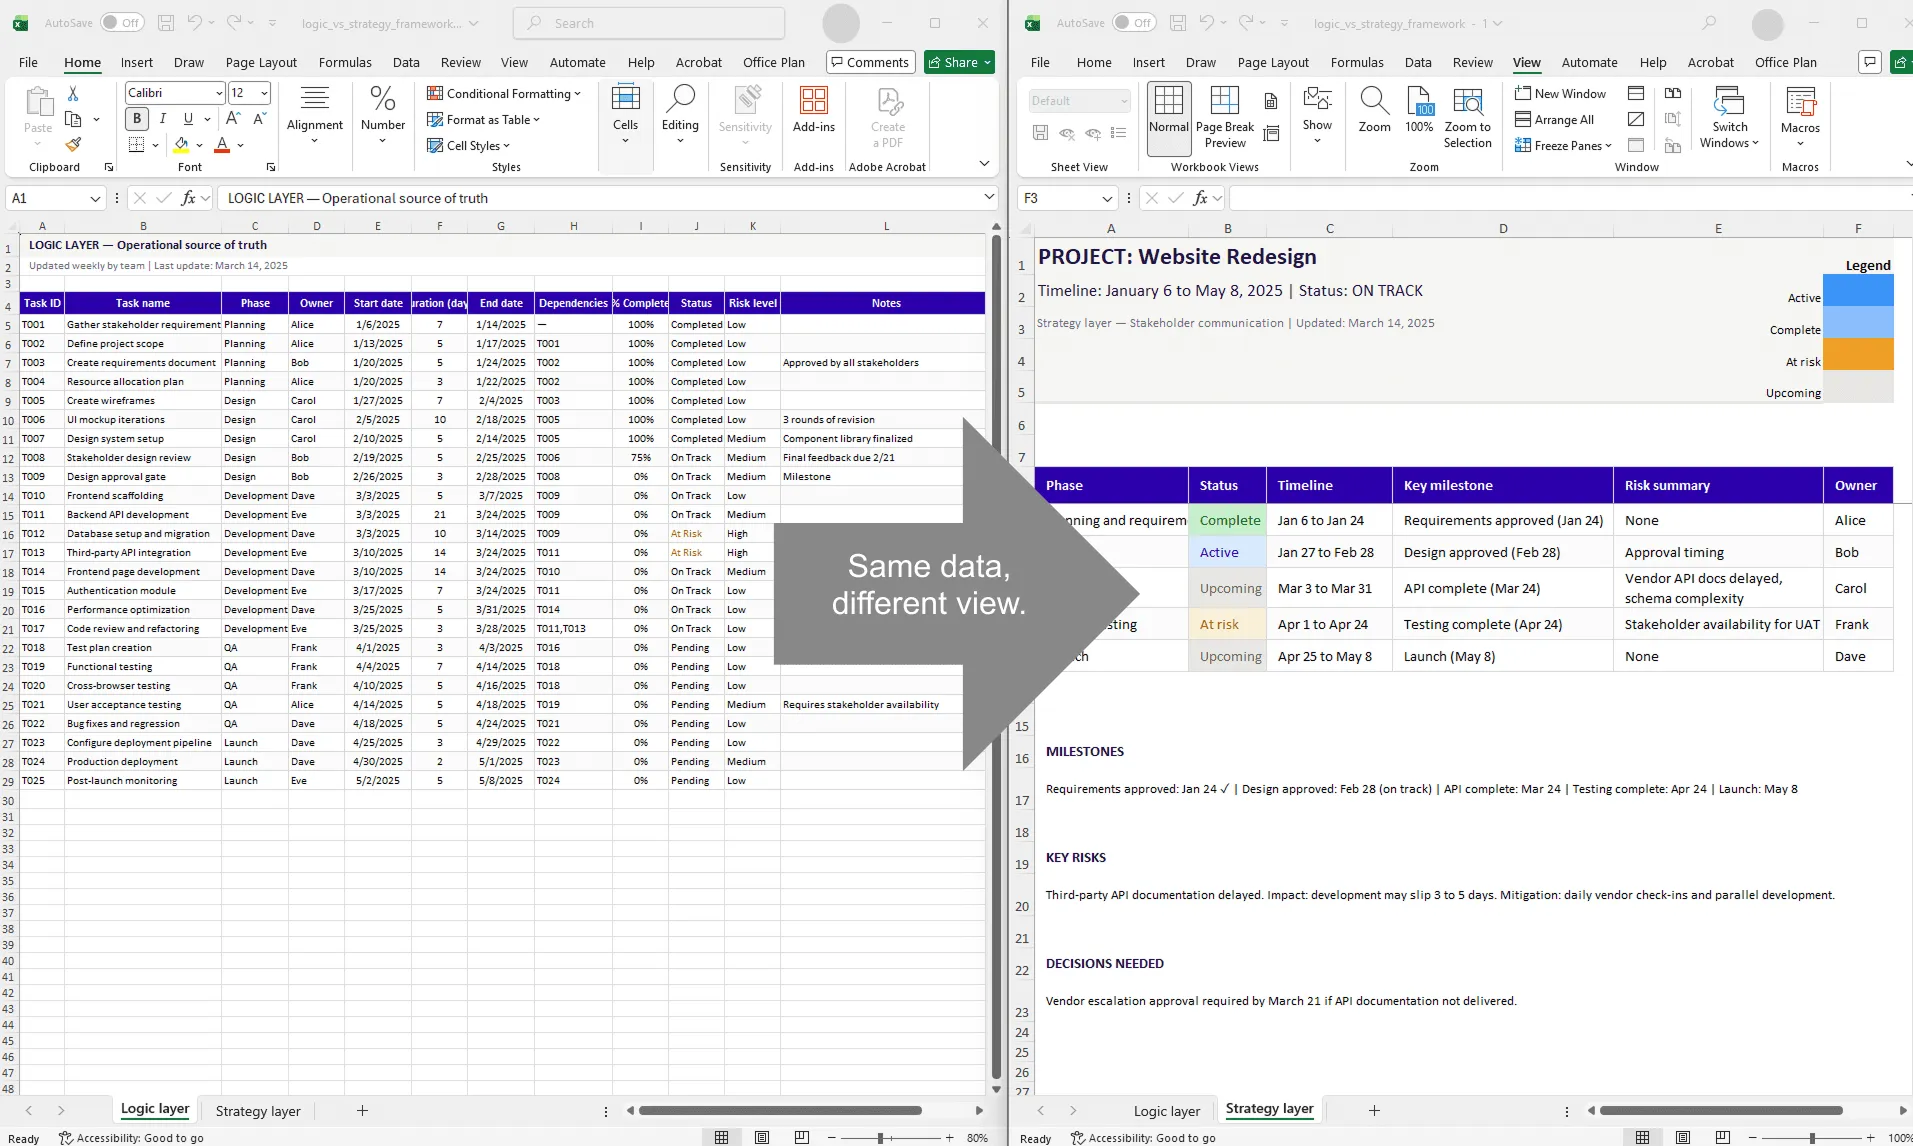
Split view showing the same project as a dense Excel table (logic layer) on the left and a clean timeline visual with phases and milestones (strategy layer) on the right, connected by an arrow labeled 'same data, different view'.
Quick answer
The logic vs. strategy framework separates project planning into two distinct layers: the logic layer (data, formulas, task details) and the strategy layer (visual communication, executive summaries). Mixing them creates cluttered plans that fail both operational and presentation purposes. Separating them gives your team the detail they need and your stakeholders the clarity they need, from the same source of truth.
Introduction
You're sitting in your project management tool (probably Excel), looking at a spreadsheet that's trying to be two things at once. It has 15 columns of detailed task data: owners, durations, dependencies, risk flags, technical notes. It also has color-coded bars representing a timeline. It's your source of truth for day-to-day operations.
Then your stakeholders ask for an update. You stare at your spreadsheet, realizing it's completely unfit for board consumption. It's too detailed, the visual signal is weak, and the context is all wrong for an executive audience. So you spend three hours creating a second, simplified version, or worse, you export the chart and hope nobody asks questions.
This is the core problem: you're trying to use one view for two fundamentally different jobs: operational planning and strategic communication. These jobs have opposite requirements. They need separate layers.
This guide introduces the logic vs. strategy framework, a mental model for structuring your planning approach so you do both jobs well without doubling your work.
The core problem: one view, two jobs
Let's be precise about what goes wrong when you try to do both in one place:
For operational planning, you need: rich task-level detail (owner, status, dependencies, risk flags, notes), formulas and calculations (duration, end dates, resource hours), flexibility to update frequently, granular filtering and sorting, and historical data.
For strategic communication, you need: high-level phases and milestones (not individual tasks), a clean and simple visual (one glance tells the story), professional formatting (colors, readable fonts, clear structure), minimal noise, and stable output that doesn't change unless major news happens.
These are in direct conflict. A spreadsheet loaded with operational detail is useless for executives. A simplified executive summary is useless for task management. One view trying to satisfy both becomes cluttered, confusing, and ultimately fails at both.
The solution isn't choosing one over the other. It's building both as separate layers from the same data.
Defining the logic layer
The logic layer is your operational source of truth. It's where all project data lives. It's detailed, formula-driven, and updated regularly.
The logic layer includes:
Task-level detail: Task ID and name, owner, start and end dates, estimated and actual duration, dependencies, percent complete, status, risk flags, and any other operational metadata.
Formulas and automation: End date = start date + duration. Days until due = end date minus today. Overall percent complete = average of all task completions. At-risk count = COUNTIF for at-risk statuses.
Regular updates: Team members update percent complete weekly. Managers adjust dates when timelines slip. New risks are flagged immediately. Completed tasks are marked done.
Example logic layer structure:
| Task ID | Task Name | Phase | Owner | Start | Duration | End | Dependencies | % Complete | Status | Risk Level | Notes |
| T001 | Requirements | Planning | Alice | 3/1 | 10 | 3/11 | — | 100% | Completed | Low | Done |
| T002 | Design | Design | Bob | 3/12 | 14 | 3/26 | T001 | 60% | On Track | Medium | Waiting for design tool license |
| T003 | Development | Dev | Carol | 3/27 | 21 | 4/17 | T002 | 20% | At Risk | High | Database schema not finalized |
This is operational detail. It's rich with context, and it's completely unfit for a board presentation. That's fine. It's not supposed to be.
Defining the strategy layer
The strategy layer is your communication view. It's what stakeholders see. It's simplified, visually clear, and focused on the signal that matters: what are we doing, when, and what's the risk?
The strategy layer includes:
High-level phases (not individual tasks):
- Discovery and planning (weeks 1–2)
- Design (weeks 3–4)
- Development (weeks 5–7)
- Testing (weeks 8–9)
- Launch (weeks 10+)
Key milestones: Requirements approved, design complete, development complete, launch ready, each with a date.
Overall status: On track, at risk, or blocked. Days remaining. Major risks or dependencies.
Clean presentation: 5 to 7 colors maximum. Clear labels and dates. No technical jargon. Visual indicators (diamonds for milestones, color-coded status).
Example strategy layer (a timeline visual):
| PROJECT: Website Redesign Timeline: March 1 - June 15, 2025 | Overall Status: ON TRACK (Yellow: Design at risk) DISCOVERY & PLANNING [============] ✓ Complete Done: 3/11 DESIGN [========────] 60% | ⚠ At Risk (Schema delays) Due: 3/26 DEVELOPMENT [====───────────] 20% Due: 4/17 TESTING [───────────────────] Due: 5/8 LAUNCH [──────────] Launch Ready Date: 6/15 MILESTONES: ✓ Req approved (3/11) | ◇ Design (3/26) | ◇ Dev (4/17) | ◇ Test (5/8) | → Launch (6/15) |
This is strategic simplicity. It tells a story. Someone reading this for 30 seconds understands the project's status, timeline, and risks.
Why mixing them creates problems
Here's what happens when you try to combine logic and strategy into one document:
Visual signal loss. Your executive audience opens a spreadsheet with 15 columns of task detail. They scroll past task names, owners, dependencies, risk notes. By the time they find the timeline, they're already lost. The signal is buried under noise.
Operational clutter. You're trying to use clean colors and simple formatting for executives, so you hide columns. Now your team can't see the operational detail they need. Managing through hiding and unhiding is fragile.
Conflicting update cadences. Your team updates the logic layer daily or weekly. Your strategy layer should update less frequently, only when significant news happens. Tying them to one view means either your communication is stale or your operational plan is forced into unnecessary visual updates.
Doubled work. Every time you need to present, you're manually translating from detailed logic to simplified strategy. Copying data, recreating visuals, exporting static images. Hours of work per presentation cycle.
Version drift. Multiple versions exist: the detailed plan, the executive summary, a slide deck, an email summary. They're not in sync. People ask questions based on different versions of the truth.
How to implement the two-layer framework
Step 1: Build the logic layer as your source of truth
Create a detailed Excel project plan with all the columns and formulas you need for operations. Use separate sheets for the detailed plan, a change log (audit trail of edits), and supporting data (resource calendars, risk register, assumptions).
Update this weekly as the project progresses. This is your single source of truth.
Step 2: Extract high-level data for the strategy layer
Periodically (monthly or when major changes occur), extract a simplified view. Create a summary that pulls phase names, phase durations (rolled up from tasks), milestone dates, overall status, and key risks.
Use formulas to auto-calculate:
- Phase percent complete = average of task completions within that phase
- Phase status = if any task at risk, mark phase at risk
- Next milestone = minimum of incomplete milestone dates
Step 3: Generate the strategy visual
Now create the visual: a timeline, roadmap, or Gantt chart designed for communication.
Design for 30-second comprehension: Title with project name and status. Timeline axis in months or quarters. One row per phase (5 to 7 max). Milestones marked clearly. Overall status indicated by color. No extraneous detail.
This is where most teams lose time. Building the visual by hand means hours of formatting. And every time the logic layer changes, you rebuild.
Office Plan eliminates this step. It reads your logic layer data directly from Excel and generates a professional strategy visual (Gantt chart, timeline, or roadmap) right inside your spreadsheet. Both layers live in one file. When the logic layer changes, the strategy visual stays current. No manual translation, no separate file, no version that drifts.
Step 4: Establish an update protocol
- Logic layer: Updated by team members weekly (or as work progresses)
- Strategy layer: Updated by PM monthly, or immediately if major changes occur (milestone slip, scope change, resource constraint)
- Version control: Strategy outputs are versioned by date for audit trail
The two-layer framework in action
Here's how it plays out in a real project:
Monday, March 10. Carol updates her tasks in the logic layer (3 tasks now 75% complete instead of 50%). Formulas recalculate; overall project completion goes from 45% to 47%. Strategy layer is unchanged. Small progress doesn't warrant stakeholder communication.
Wednesday, March 12. Bob realizes the design phase will slip by a week. He updates the end date in the logic layer (3/26 to 4/2). This cascades: development now starts 4/3 instead of 3/27. Strategy layer is updated: new design milestone date (4/2), new development start date.
Thursday, March 13. PM communicates to stakeholders: "Design milestone slipped one week to 4/2. Development start pushed to 4/3. Overall launch date unchanged (6/15) due to buffer in the testing phase. No escalation needed, but we're monitoring closely." Strategy visual is updated with the new dates. Logic layer already reflects the change from Wednesday.
This flow separates operational detail from stakeholder communication cleanly. The team updates the detailed plan frequently. The PM translates to strategy when the news matters.
Tools for each layer
Logic layer tools (operational source of truth): Excel (most common), Google Sheets (better collaboration), Airtable or Monday.com (more structured), Microsoft Project (enterprise, complex dependencies).
Strategy layer tools (communication visual): An Excel add-in like Office Plan (generates the visual inside your spreadsheet, connected to the logic layer data), dedicated Gantt or timeline tools, or even a simple PDF or printed timeline.
The key is that the strategy layer should always be derived from the logic layer, never maintained independently. When both layers live in the same file (which Office Plan makes possible), version drift becomes impossible.
Common implementation mistakes
Trying to use the same view for both. You end up with a cluttered mess that serves neither purpose. Use separate layers, even if they live in the same file.
Updating the strategy layer too frequently. Weekly visual updates create noise. Update the strategy layer only when significant operational changes occur.
Keeping logic layer changes hidden from stakeholders. Regular summaries of logic layer changes, translated into strategy layer language, keep stakeholders informed without overwhelming them.
Strategy layer becomes a second source of truth. When the strategy visual is maintained independently, it diverges from reality. The fix: strategy is always derived from logic, never independent. Formulas or a connected tool ensure this.
Frequently asked questions
They probably don't. They think they do. Give them the detailed data if they insist, but also provide the simplified strategy summary. In 90% of cases, once they see both, they prefer the simplified version. It's less cognitive load.
Create a standing monthly review. First Tuesday of each month, the PM reviews logic layer changes and updates the strategy layer if needed. If a major change occurs (milestone slip, scope change), update immediately. This prevents drift.
Yes. Use separate sheets within the same workbook: Sheet 1 (logic) is detailed with all formulas. Sheet 2 (strategy summary) pulls from logic using formulas. An add-in like Office Plan generates the visual timeline from your logic layer data, all inside the same file.
Logic layer: yes, read access for everyone, edit access for task owners and PM. Strategy layer: yes, read access for everyone, edit access for PM only (to prevent changes that diverge from the logic layer).
That's a sign your project is unstable or your logic layer is too detailed. Either increase strategy layer update frequency (weekly instead of monthly) or consolidate your logic layer to focus only on critical data. When the strategy visual is connected to the logic layer through a tool like Office Plan, staleness becomes less of a risk because the visual updates from the data automatically.
Absolutely. The tool matters less than the separation. Logic in your operational tool, strategy in a tool designed for communication visuals. When both live inside Excel via an add-in like Office Plan, you get the separation without the overhead of maintaining a second file.
Key takeaways
- The logic vs. strategy framework separates operational planning (detailed, formula-driven) from strategic communication (simplified, visual). These serve different audiences and have opposite requirements.
- The logic layer is your source of truth: all task detail, formulas, frequent updates, operational decisions. It lives in Excel.
- The strategy layer is your communication view: high-level phases, milestones, overall status. It's designed for 30-second comprehension.
- Mixing them in one view creates clutter, confusion, version drift, and doubled work.
- Use formulas or a connected tool to derive the strategy layer from the logic layer. Manual copying creates divergence.
- The logic layer updates weekly. The strategy layer updates monthly or when major changes occur.
- Tools like Office Plan generate the strategy visual directly from your logic layer inside Excel, keeping both layers connected in one file with no manual translation.
Project management tips and tricks
Keep both layers connected, not separated
The logic vs. strategy framework works because it separates two different jobs. But "separate" doesn't have to mean "disconnected." When the strategy layer drifts from the logic layer, trust erodes. Office Plan keeps them connected. It reads your logic layer data and generates a professional strategy visual right inside Excel. One file. Two layers. Both current. Your team gets the operational detail they need. Your stakeholders get the clarity they need. And you spend your time on the project, not on translating between views.