How to track project milestones in Excel using a Gantt chart
Learn how to highlight and track important project milestones in Excel Gantt charts. Use color-coding and visual indicators to communicate key deliverable dates.

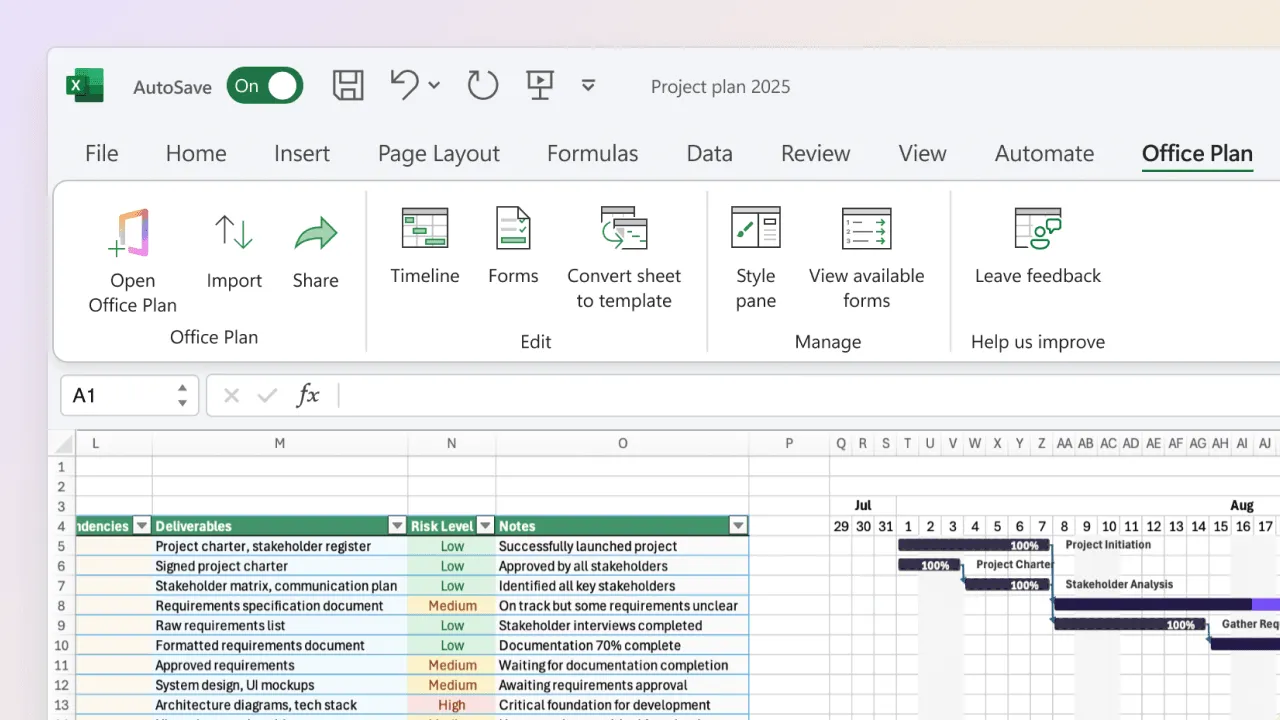
Excel Gantt chart showing task bars with diamond milestone markers between project phases, color-coded by status.
Quick answer
Track milestones in an Excel Gantt chart by creating a dedicated milestone row with duration set to 0 or 1 day, positioning it at the critical date, and formatting it with a distinct symbol (diamond, marker, or icon) to stand out visually from regular task bars. Milestones are the dates your stakeholders care about most. Make them impossible to miss.
Introduction
You have a complex project timeline with dozens of tasks spread across months. Your team is executing, progress is being tracked, and everything is flowing along in your spreadsheet. But there's a critical moment buried in week 8 when your largest deliverable must be complete. If you miss it, the entire project cascades into delay.
This is why milestones matter. A milestone is a significant date or event that marks a major accomplishment, decision point, or deliverable. Unlike regular tasks, milestones are zero-duration events. They don't represent work being done. They represent work being completed or a critical threshold being crossed.
In a project with 40 tasks, your stakeholders don't care about most of them. They care about the 3–5 milestones that determine whether the project succeeds or fails. These dates need to be crystal clear, impossible to miss, and obviously flagged if they're at risk.
The challenge in Excel is that milestones can easily get buried in the noise of a detailed task list. This guide walks through how to set up milestone tracking in your Gantt chart so those critical dates have the visibility they deserve.
What are project milestones?
A project milestone is a point in time when a significant deliverable is complete, a major decision is made, or a phase is finished. Milestones mark the skeleton of your project. They're the moments when something notable happens.
Examples of milestones:
- Requirements document approved by stakeholders
- Design mockups finalized
- Development complete (ready for testing)
- Testing complete (ready for production)
- Product launch
- First customer win
- Post-launch support plan confirmed
Characteristics of milestones:
- Zero duration: They happen on a specific date, not over a range
- Binary: Either the milestone is met or it's not. There's no "50% complete milestone"
- Critical: Missing one has downstream consequences
- Measurable: You can definitively say whether it's been achieved
What milestones are not: regular tasks (those have duration and can be partially complete), arbitrary checkpoints (must be significant), or internal team syncs (unless they're gate events).
The distinction matters. Not every task end date is a milestone. A milestone is an event that stakeholders care about and that other work depends on.
Why milestones need visual treatment
In a spreadsheet full of tasks, milestones get lost without intentional formatting. Visual treatment is what gives them the visibility they need.
Instant recognition. Anyone looking at your chart should immediately see the critical dates. A milestone should be visually distinct from regular task bars, not just another row in the spreadsheet.
Risk flagging. If a milestone is at risk, that's high-impact news. It needs to jump out instantly, not sit buried in a status column.
Stakeholder focus. Executives don't want to read your task list. They want to know: "Are the critical milestones on track?" Visual emphasis helps them find that answer in seconds.
Dependency visibility. Showing which tasks lead to a milestone helps teams understand what needs to happen to hit that date.
Visual treatment transforms milestones from data buried in rows to signals that drive decisions.
Setting up milestone tracking columns in Excel
To track milestones alongside your regular tasks, add these columns to your project plan:
| Column | Purpose |
|---|---|
| Task/Milestone Name | "Requirements approval" vs. "Write requirements doc" |
| Is Milestone? | Yes/No flag |
| Milestone Date | When the milestone must occur |
| Milestone Status | On Track, At Risk, Blocked, Achieved |
| Owner | Who's accountable for hitting the milestone |
| Dependency | What task(s) must complete for this milestone |
Example:
| Task Name | Is Milestone? | Date | % Complete | Status | Owner |
|---|---|---|---|---|---|
| Write requirements doc | No | 2/28/2025 | 100% | Completed | Alice |
| Requirements approval | Yes | 3/7/2025 | 100% | Achieved | Bob |
| Design phase | No | 3/20/2025 | 75% | On Track | Carol |
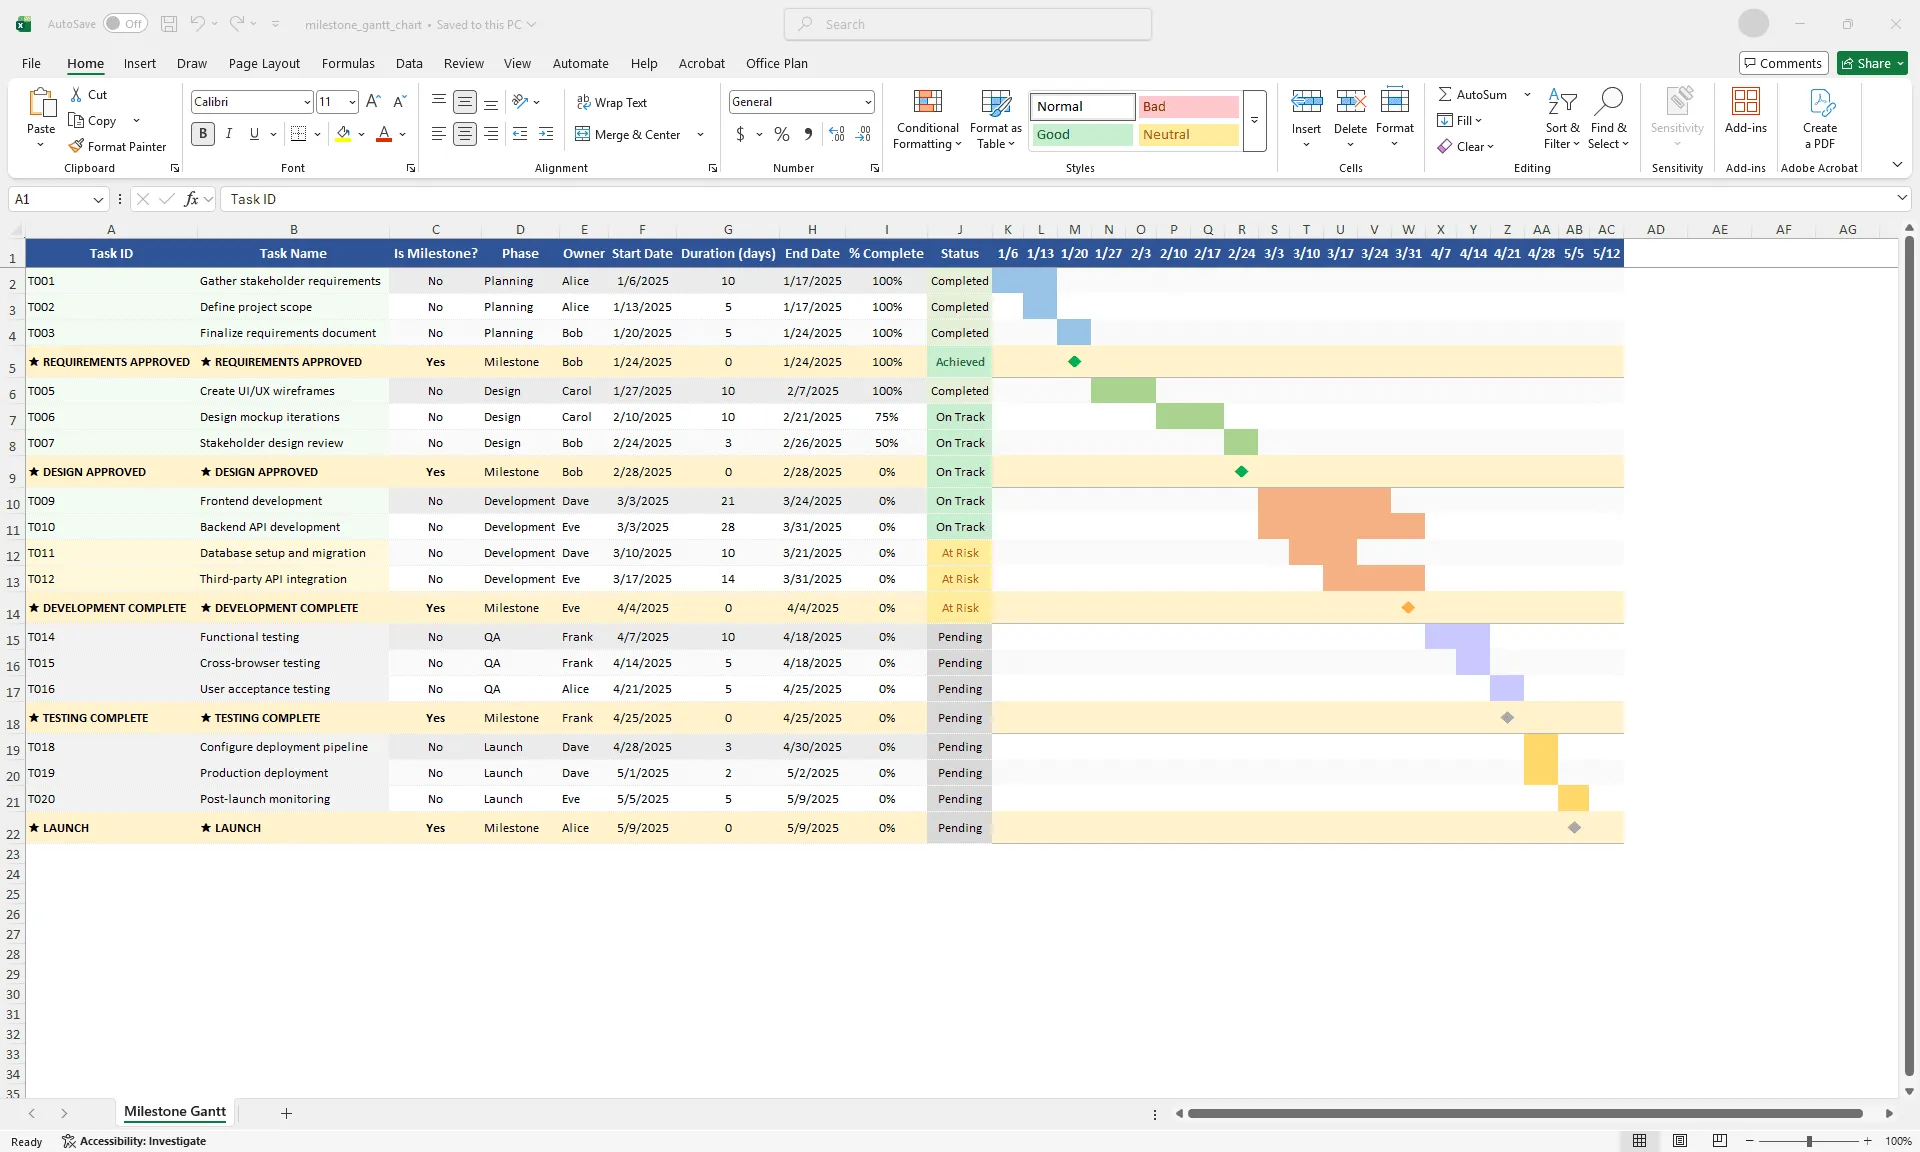
Notice: regular tasks have durations (multiple weeks). Milestones are zero-duration (a single date). Milestones are flagged with "Yes" in the Is Milestone column. Milestones have their own status tracking (Achieved vs. still pending).
Adding milestone markers to an Excel Gantt chart
Once you've identified your milestones, represent them visually in your Gantt chart.
Method 1: Diamond marker
The most common approach. Represent a milestone as a diamond shape at a specific date.
- Create a helper row for milestones, separate from regular task rows
- Set the milestone's duration to 0 days
- In your Gantt chart (stacked bar chart), create a thin bar for the milestone date
- Format the bar's end with a diamond marker shape
- Use a distinctive color (bright yellow, red, or blue) so it stands out from task bars
Method 2: Vertical line overlay
Overlay a vertical line at each milestone date on top of your regular Gantt bars.
- Create a date column in your spreadsheet marking milestone dates
- Use a chart with multiple series: one for regular tasks (bars) and one for milestones (lines)
- Use a secondary axis if needed to prevent the milestone line from shifting bar positions
This works well when you have many milestones. They don't clutter the visual because they're just thin lines.
Method 3: Milestone row with icon
Create a dedicated milestone row in your Gantt chart, formatted distinctly:
| Task | Start | Duration | Bar visual |
|---|---|---|---|
| Requirements doc | 2/14/2025 | 14 days | [Blue bar] |
| ✓ Requirements approved | 3/7/2025 | 0 days | [Green diamond] |
| Design phase | 3/8/2025 | 20 days | [Blue bar] |
The milestone row sits between related tasks, clearly positioned at its date, with a distinctive visual (diamond, checkmark, or icon).
Color-coding and conditional formatting for milestone status
Milestones carry more weight than regular tasks. If a milestone is at risk, that's immediately actionable. Use conditional formatting to make milestone status unmissable:
Status color scheme:
- Green: Achieved or on track (milestone date will be met)
- Yellow: At risk (milestone date may slip)
- Red: Blocked or missed (milestone was not achieved or is overdue)
- Gray: Not yet started or not applicable
Example:
| Milestone | Date | Status | Color |
|---|---|---|---|
| Requirements approval | 3/7/2025 | Achieved | Green |
| Design milestone | 4/4/2025 | On Track | Green |
| Development complete | 5/23/2025 | At Risk | Yellow |
| Launch readiness | 6/20/2025 | Pending | Gray |
How to set up conditional formatting:
- Select the Status column
- Go to Home > Conditional Formatting > New Rule
- Create rules: "Achieved" → green fill, "On Track" → light green fill, "At Risk" → yellow fill, "Blocked" → red fill
Green, yellow, and red give you instant health checks without reading individual cells. The milestone status tells the story at a glance.
Reporting milestone progress to stakeholders
Milestones are your primary currency for stakeholder communication. Here's how to build a milestone-focused report:
Weekly milestone status report:
Create a simple one-page summary:
| PROJECT: Website Redesign WEEK OF: March 10, 2025 MILESTONE STATUS: ✓ Requirements approved (due 3/7) — ACHIEVED All stakeholder feedback incorporated. Design team ready to proceed. ✓ Design complete (due 4/4) — ON TRACK 3 of 5 design comps approved. Final feedback due 3/21. Slight risk if feedback delayed. ⚠ Development ready (due 5/2) — AT RISK Scope creep in design phase may delay start by 3-5 days. Planning mitigation. → Launch readiness review (due 6/15) — PENDING On schedule. Checklist being prepared. SUMMARY: 2 milestones achieved, 1 on track, 1 at risk. Overall trajectory: On track for June launch. |
This format is executive-ready. Stakeholders see which milestones are critical, which are done, which are at risk (and why), and overall project health.
Dashboard summary view:
Build a simple Excel dashboard above your detailed Gantt:
| PROJECT MILESTONES Total Milestones: 8 Achieved: 3 ✓ On Track: 3 ✓ At Risk: 2 ⚠ Blocked: 0 Next Critical Milestone: Design complete (due 4/4/2025) Days until milestone: 18 days Health: ON TRACK |
Use COUNTIF formulas to auto-calculate counts from your milestone status column. This gives stakeholders a quick health pulse without scrolling through task-level detail.
Integrating milestones into your project workflow
Milestones work best when they're actively managed, not just documented.
Weekly reviews. Review milestone status every week. Ask: Is this milestone still on track? Are the predecessor tasks being hit? Are there emerging risks? Do we need to escalate or add resources?
Gate meetings. When a milestone is due, hold a gate meeting. The milestone is either achieved (project proceeds) or it's not (you pause and address blockers). This prevents milestones from becoming soft targets that slip without consequence.
Dependency management. For each milestone, clearly document which tasks are blockers. If task X must complete for milestone Y to happen, that's explicit. When task X slips, everyone knows the milestone is at risk.
Escalation protocol. Define what happens if a milestone is at risk. Who gets notified? What are the options (compress the schedule, reduce scope, accept delay)? Clear escalation prevents surprises.
Combining milestones with regular task tracking
Your Gantt chart should show both regular tasks (the day-to-day work and its progress) and milestones (the critical dates that matter to stakeholders).
The combination gives you two levels of clarity simultaneously:
- Team members see the granular task list they need to execute
- Stakeholders see the milestones they care about
- Everyone sees the connection: these tasks lead to that milestone
Example Gantt structure:
| [Task-level detail] Write requirements [████████████] Review requirements [████] [Milestone marker] ★ REQUIREMENTS APPROVED ⭐ (3/7/2025) [Next phase tasks] Create design mockups [████████████████████] Get design approval [████] [Next milestone marker] ★ DESIGN COMPLETE ⭐ (4/4/2025) |
This structure is both operationally useful (team can see their tasks) and strategically clear (stakeholders can see milestones). The visual hierarchy makes it obvious which dates are critical without requiring anyone to read through every row.
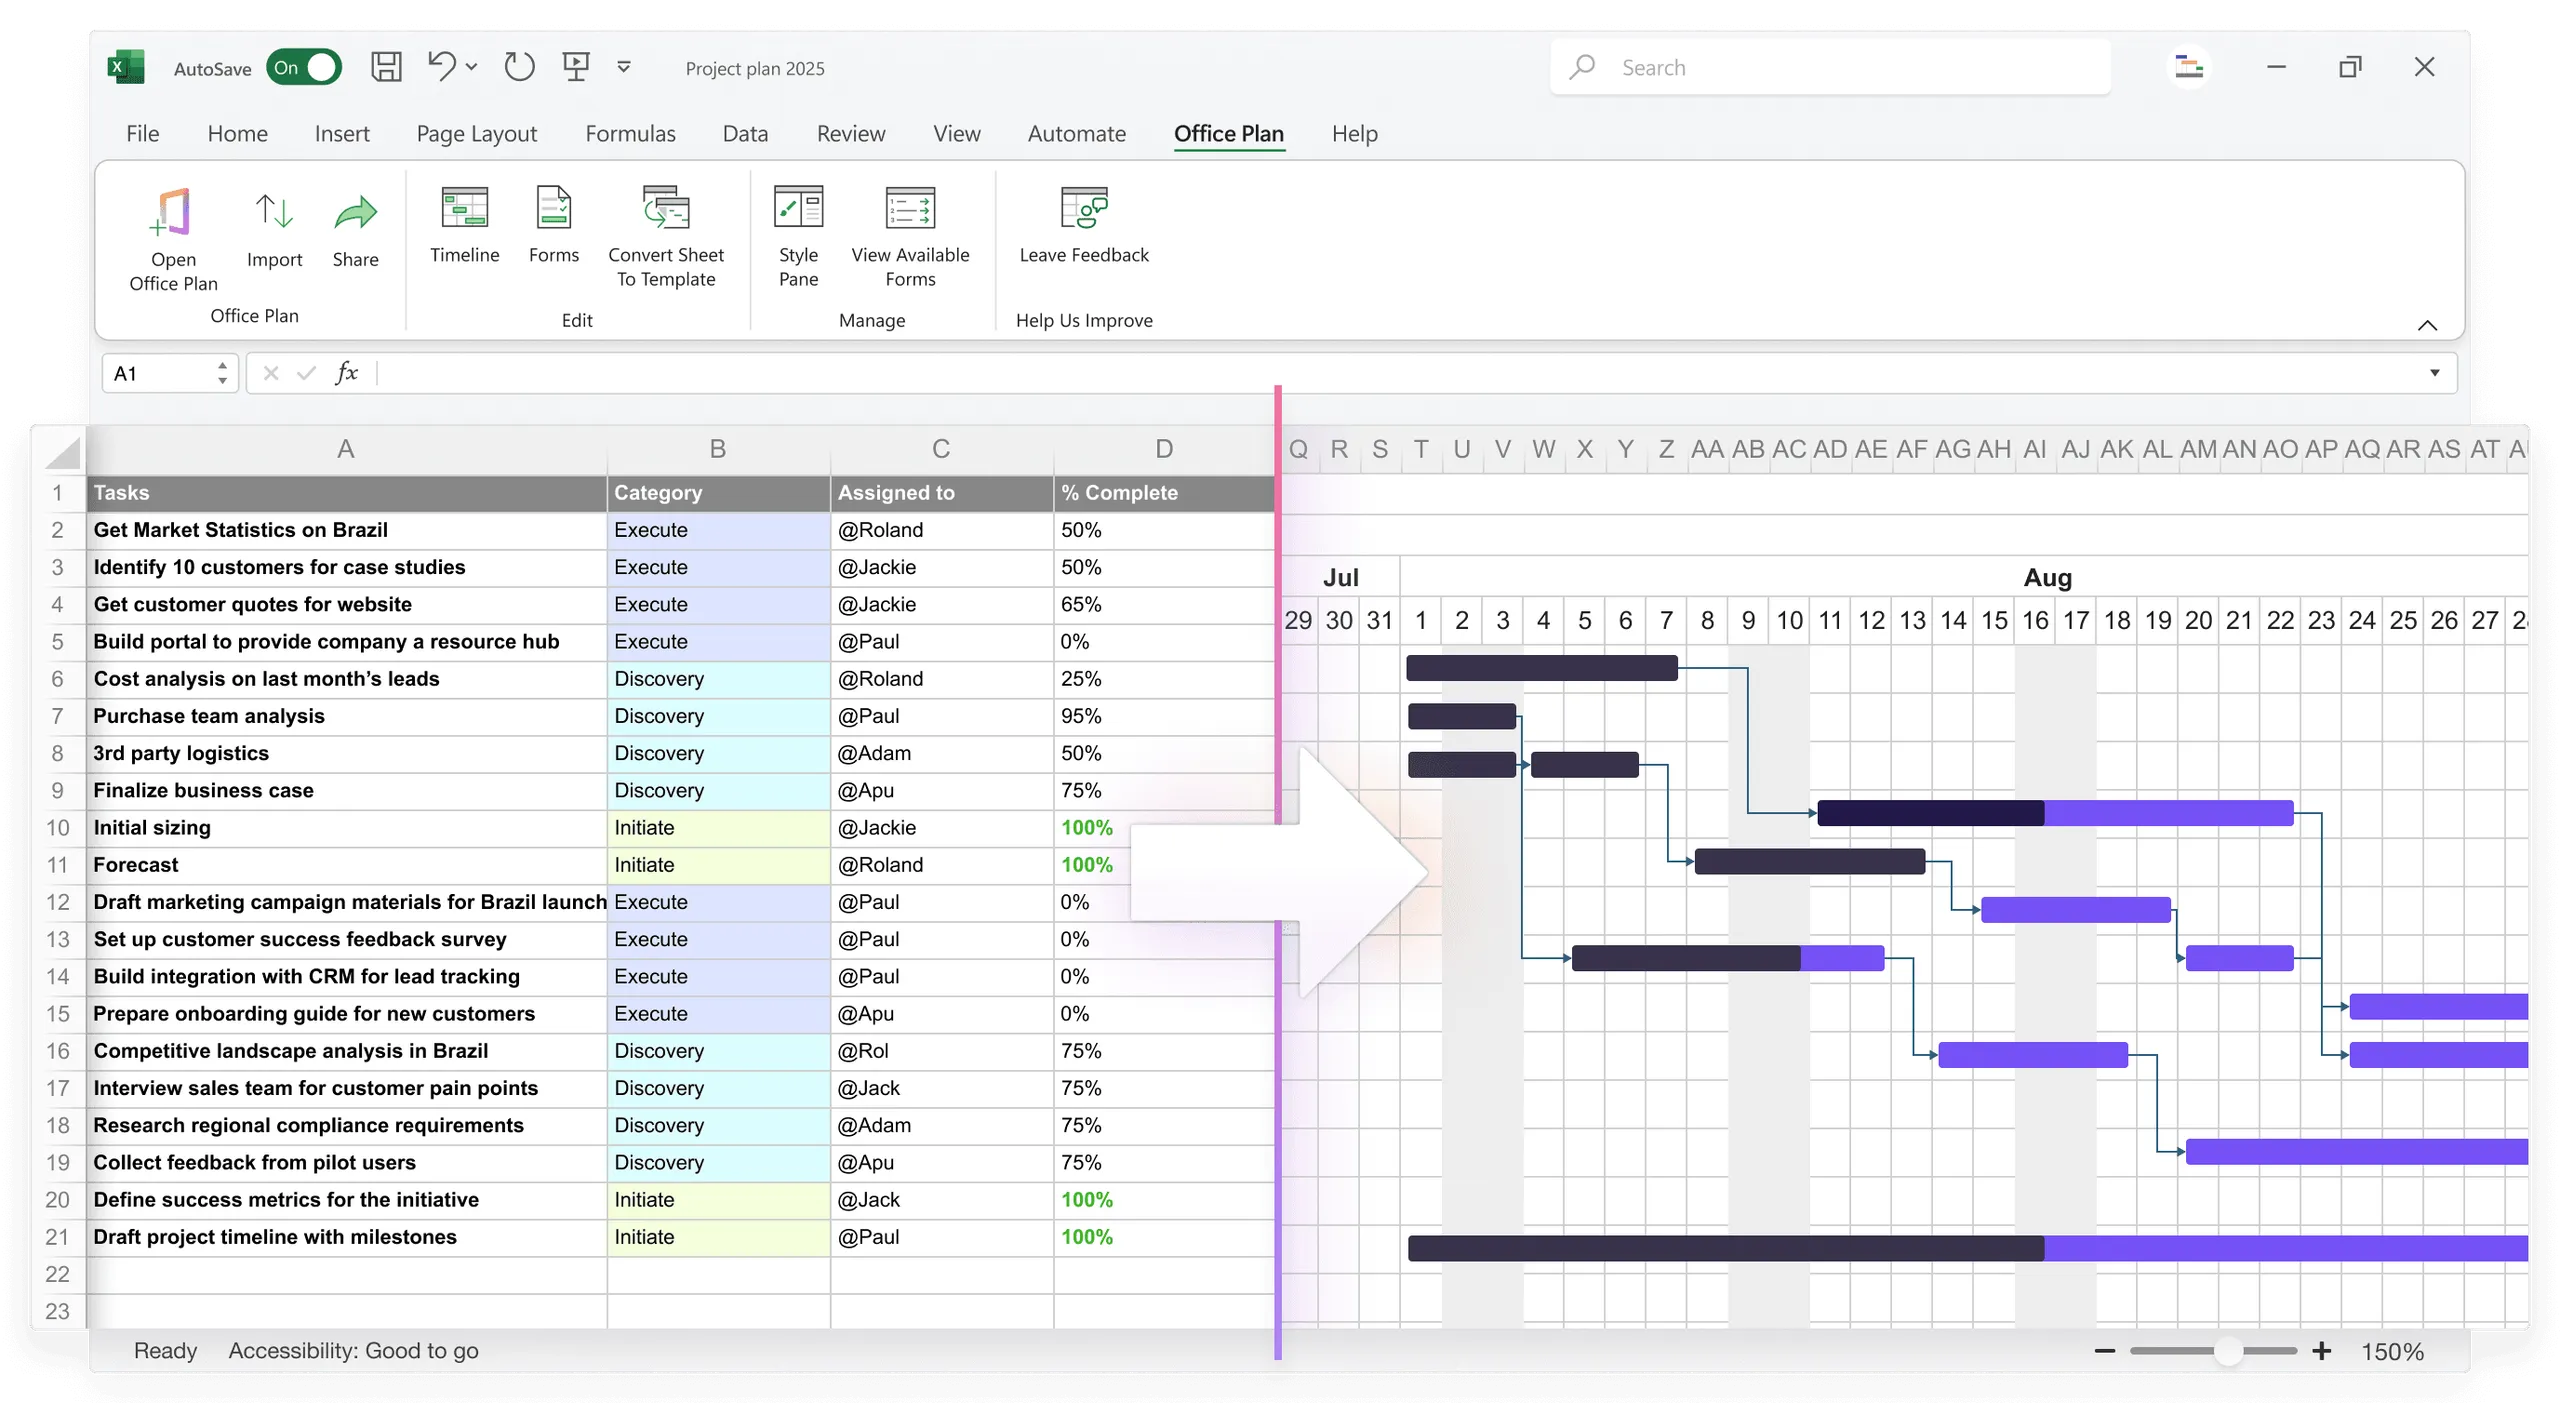
Building this dual-level view manually in Excel is where most teams lose time. Formatting milestone markers, positioning diamonds, maintaining visual consistency as dates shift.
Office Plan handles this automatically. It reads your Excel data and generates a Gantt chart with professional milestone markers, right inside your spreadsheet. When milestone dates move, the visual updates. No reformatting, no manual repositioning.
Frequently asked questions
A typical project has 3–8 milestones, depending on duration and complexity. A 6-month project might have 4–5 (one per phase or major deliverable). If you have more than 10, either your project is very complex or you're treating regular task completions as milestones. Clarify which events are truly significant.
Acknowledge it. Don't pretend it didn't happen. Determine the root cause (what was blocked, what resource was unavailable). Then decide how to recover: Can you make up the time? Does the delay cascade to other milestones? Do you need to reduce scope or add resources? The key is making the decision explicitly, not letting delays pile up silently.
Yes, but be clear about the distinction. A "Design Phase Complete" task might finish on 4/4, and a "Design Approval" milestone might also occur on 4/4. The task is the work. The milestone is the gate. Document this clearly so there's no confusion about dependencies.
Include both. Internal milestones (code review complete, testing phase start) help the team pace work. Stakeholder milestones (design approved, launch date) are for executives. You can maintain a detailed internal timeline with many milestones and a simplified stakeholder version with only the most critical ones.
Document why it slipped (root cause), what the new date is, the impact on downstream milestones, and what you're doing to recover. Communicate this proactively. Stakeholders respect transparency more than silence. Then adjust your plan and track toward the new date.
Not in the traditional sense. Milestones mark completion of work, not work itself. But you should document which tasks must complete for a milestone to be achieved. For example, "Design Approval" depends on "Design Review" being complete. This is documented in your plan but not enforced by Excel formulas.
Key takeaways
- Milestones are zero-duration events marking critical deliverables, decisions, or phase completion. They're the dates your stakeholders monitor most closely.
- Not every task end date qualifies as a milestone. Only significant events that other work depends on and that stakeholders care about.
- Track milestones with a dedicated column (Is Milestone: Yes/No) and status indicators. Make them structurally distinct from regular tasks.
- Represent milestones visually in your Gantt as diamonds, vertical lines, or distinct markers. They must stand out from task bars instantly.
- Use conditional formatting (green/yellow/red) to flag milestone health. Status should be visible at a glance, not buried in a column.
- Weekly milestone reviews keep risks visible and stakeholders informed. Gate meetings prevent milestones from becoming soft targets.
- Combine task-level detail with milestone visibility to serve both team execution and stakeholder communication from the same plan.
- Tools like Office Plan generate Gantt charts with professional milestone markers directly from your Excel data, keeping the visual current as dates shift.
Project management tips and tricks
Give your milestones the visibility they deserve
Milestones are the critical dates your stakeholders track. They should be the clearest, most visible elements in your project plan, not data points buried in a spreadsheet. Office Plan reads your Excel project data and generates a professional Gantt chart with distinct milestone markers, right inside your spreadsheet. When dates shift, the milestones move with them. No manual repositioning, no reformatting, no visual that falls behind the data. Clear milestones. Clear status. Clear decisions.