The professional signal: turning raw Excel project data into boardroom-ready visuals
Learn why visual polish matters for project credibility. Discover how to transform raw Excel data into professional timeline visuals that signal control and competence.

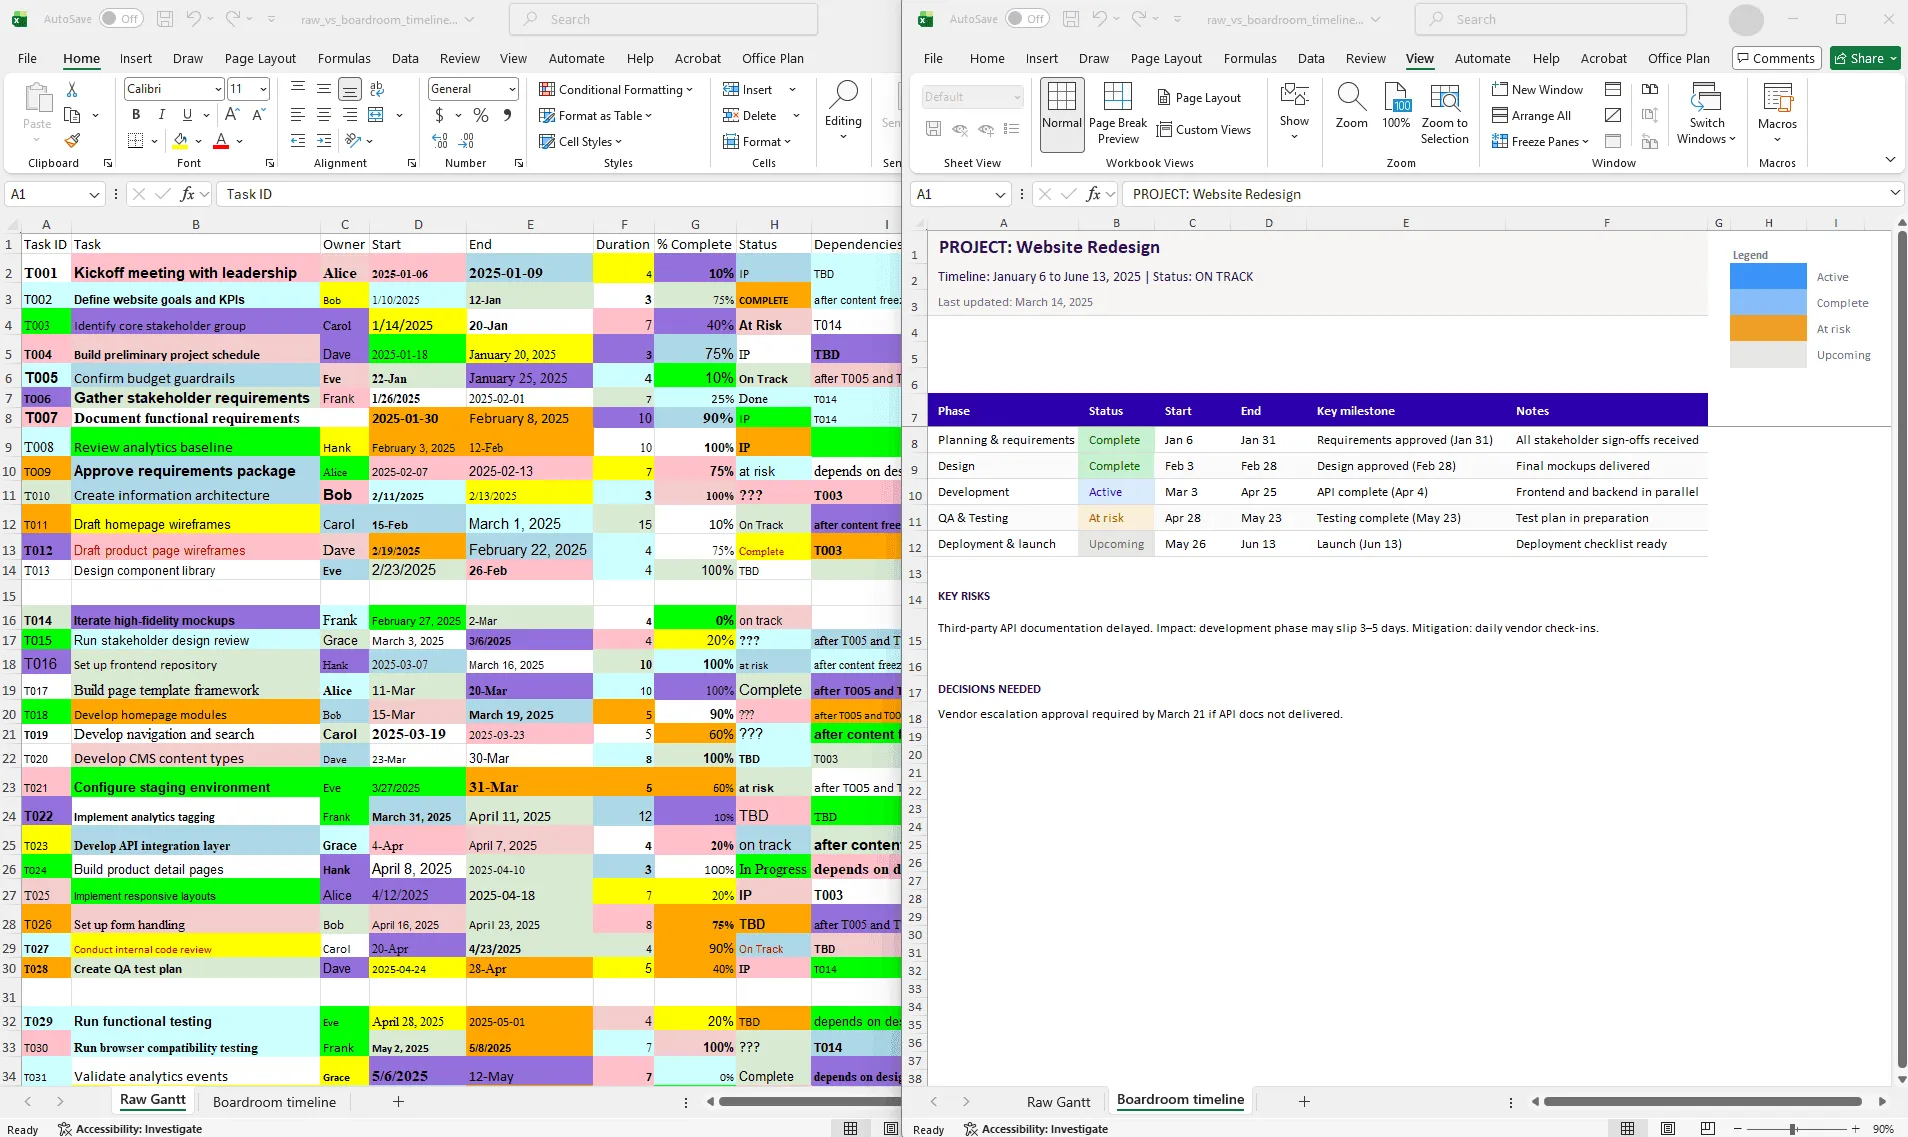
Side-by-side comparison of the same project data: a raw Excel Gantt chart with dense rows and tiny text on the left, and a clean, professional visual with phases, milestones, and clear status indicators on the right.
Quick answer
Visuals signal credibility. A messy Excel chart signals chaos. A polished timeline signals control. Executives form opinions about project health based on visual presentation quality, often before reading the data. Investing in professional visuals (clean design, proper colors, readable fonts, clear structure) changes how stakeholders perceive your project's status and your competence as a leader.
Introduction
You're presenting the same project to two different audiences:
- Your team sees a detailed Excel Gantt with every task, dependency, and risk flag
- Your board sees a polished timeline with phases, milestones, and status
Both visuals contain accurate data. But the board members unconsciously form an opinion about project health based on visual polish alone. If the visual looks chaotic or unprofessional, they assume the project is chaotic, even if the data says otherwise.
This is the professional signal. Executives judge project health partly by data, but substantially by the quality and professionalism of how that data is presented. A clean, clear timeline signals competence. A cluttered spreadsheet signals disorder.
The good news: the gap between raw Excel data and a boardroom-ready visual is a solvable problem. In this guide, we'll explore why visuals matter for credibility, what "boardroom-ready" actually means, and how to close the gap without spending hours on formatting.
How visuals signal professionalism
This isn't superficial. It's cognitive psychology. Humans process visuals before text, and they make instant judgments based on visual cues.
Visual cues that signal "this project is under control":
- Clean, consistent color scheme (not rainbow colors)
- Readable fonts (14pt minimum, professional typeface)
- Intentional whitespace (not cramped or cluttered)
- Aligned and balanced layout
- Consistent styling (all labels match, all dates in the same format)
Visual cues that signal "this project is chaotic":
- Too many colors (8+ colors competing for attention)
- Tiny fonts or unreadable text
- No whitespace; everything packed together
- Misaligned elements, asymmetrical layout
- Inconsistent styling (different fonts, different date formats)
An executive sees a messy timeline and thinks: "If they can't even make a clean chart, how are they managing the project?" It's not fair, but it's how the brain works.
The inverse is equally true. A polished visual creates a halo effect. "This looks professional, so the project must be well-managed." The data might not fully support that conclusion, but the visual sets the expectation. Your job is to make sure both the data and the visual tell the same story.
What "boardroom-ready" actually means
Boardroom-ready visuals have five specific characteristics:
1. Clarity over comprehensiveness
Boardroom visuals show what matters, not everything. A Gantt chart with 40 tasks is not boardroom-ready. A timeline with 5 phases is.
Remove: granular task names (substitute with phase names), owner assignments (unless relevant to the story), technical details (replace with business outcomes), extraneous columns (keep timeline, status, and risks only).
2. One message per visual
A boardroom-ready visual answers one question clearly: "Are we on track?" (status timeline), "What are the risks?" (risk dashboard), or "When do we finish?" (project roadmap).
Don't try to show status, timeline, budget, and resources in one chart. One chart, one message.
3. Professional styling
Specific design rules:
- Colors: 3 to 5 max, consistent with company brand
- Fonts: Readable size (14pt minimum), professional typeface (Arial, Calibri, or similar)
- Whitespace: 20 to 30% of the visual should be empty
- Alignment: Everything aligned to a grid, no floating elements
- Consistency: All labels match style, all dates in the same format
4. Context, not assumptions
Every visual should be self-explanatory to someone with no context. Legends, labels, and date ranges should be obvious.
Example - Without context (forces questions):
| [Gantt chart with colored bars, no title, no legend, no date labels] Audience thinks: "What am I looking at? What do colors mean? When is this?" |
Example - With context (answers itself):
| PROJECT: Website Redesign Timeline: Jan 1 - June 15, 2025 Status: ON TRACK [Legend: Blue = Development, Green = Testing, Orange = Launch] [Dates labeled: Jan | Feb | Mar | Apr | May | Jun] [Phases clearly labeled] |
5. Data integrity
Boardroom visuals should never contradict or oversimplify the underlying data. If the data shows "at risk," the visual should signal that (yellow highlight, risk notation). Hiding bad news to make the visual look better is a credibility risk. Transparency builds trust. Concealment destroys it.
Why the tool matters as much as the data
Two project managers with identical Excel data can produce wildly different boardroom visuals:
Manager A exports a screenshot of their Excel Gantt, pastes it into a slide at 60% zoom so you can barely read it. Colors are inconsistent, fonts are tiny, and the visual looks like a squashed spreadsheet.
Manager B uses a tool designed for professional timelines, imports the same Excel data, and generates a clean Gantt chart with appropriate spacing, readable fonts, and a professional color scheme.
Same data. Completely different perception of competence.
This is why the tool matters. Excel is designed for planning and analysis. It's not designed to produce visuals that communicate clearly to executives. A PM using the right tool produces better-looking visuals faster, which signals competence to the people making decisions about the project's future.
From spreadsheet to polished visual
Here's the process:
Step 1: Keep your data in Excel
Your Excel project plan is the source of truth. It should be detailed, analytical, and structured. This is where you do the real planning work.
Step 2: Extract a high-level summary
Don't present your detailed Excel. Instead, create a high-level summary: phase names (not task names), milestone dates, status summary, and risk summary. This summary is designed for communication, not analysis.
Step 3: Generate the visual
This is where most teams lose time. Three approaches:
Manual formatting. You build the visual by hand, formatting shapes, bars, and text. Full control over styling, but labor-intensive, error-prone, and requires manual updates every time the data changes.
Excel add-in. A tool like Office Plan reads your Excel data and generates a professional timeline visual right inside your spreadsheet. Less manual control over every pixel, but faster, more consistent, and automatically connected to your data. When the data changes, the visual updates.
Dedicated timeline software. Tools like Smartsheet or GanttProject produce professional output, but your data lives in a separate tool. Two sources of truth to maintain.
For most PMs, the Excel add-in approach is the sweet spot: professional output, data stays in Excel, minimal learning curve, and no separate file to keep in sync.
Step 4: Design for your audience
For board presentations: 1 to 2 visuals max. High-level phases, not tasks. Clear status indicator. Top 1 to 2 risks. Timeline and key dates.
For team standups: More detail acceptable (task level). Owner assignments visible. Progress tracking. Risk flags.
For stakeholder updates: Moderate detail (phases and key tasks). Clear status and milestones. Risk summary. What's next.
The same data, presented differently for different audiences. The structure of the visual changes. The source of truth doesn't.
Step 5: Maintain consistency across updates
Once you've established a visual style (color scheme, fonts, layout), stick with it. Consistency builds credibility more than occasional polish.
If you use a tool like Office Plan, it maintains consistency automatically (same template every time). If you're building visuals manually, create a template and reuse it.
Common visual mistakes that undermine credibility
Too many colors. Using 8+ colors or rainbow schemes signals chaos. Keep to 3 to 4 colors maximum, chosen intentionally (blue for development, green for testing, orange for launch).
Unreadable fonts. Tiny fonts on a timeline (8 to 10pt) are unreadable from across a conference table. Use 14pt minimum for labels, 16pt or larger for titles.
Cramped layout. Every pixel filled with data or color signals "this project is overwhelming." Use whitespace intentionally. 20 to 30% empty space makes visuals feel controlled.
Mismatched styling. Different colors for status, inconsistent date formats, varying font sizes. These small inconsistencies compound to signal sloppiness.
Missing context. A chart with no title, legend, or date labels forces the audience to ask questions. Self-explanatory visuals signal competence.
Contradicting data. If your Excel shows a task is overdue but your visual shows it as "on track," that's a credibility killer. Never hide bad news in the visual.
Four elements of a professional project visual
Clear title and context
| PROJECT: Website Redesign Timeline: Jan 1 - June 15, 2025 Status: ON TRACK |
Someone with no context should understand what they're looking at in 2 seconds.
Professional color scheme
Use 3 to 4 colors chosen intentionally: blue for active phases, green for complete phases, yellow for at-risk phases, orange for upcoming phases. Avoid red-green combinations (color-blind unfriendly). Stick with the scheme across all visuals.
Readable typography
- Title: 24pt, bold
- Labels (phase and milestone names): 14pt, bold
- Supporting text (dates, status): 12pt, regular
All text should be readable from 10 feet away (board table distance).
Clear structure
The visual should have obvious hierarchy: the most important information (status, next milestone) at top or center, supporting detail (risk summary) below, timeline axis clear and labeled, alignment and balance intentional.
When you've succeeded
Your boardroom-ready visual is successful when:
- An executive can understand it in 30 seconds without explanation
- Status is obvious (on track, at risk, blocked)
- Timeline is clear (when we start, when we finish, what's next)
- The visual signals competence (clean, professional, intentional)
- Data is accurate and unhidden (no omissions or false impressions)
- It's consistent with previous updates (not a surprise redesign every time)
Frequently asked questions
Yes. Research in cognitive psychology confirms this (the halo effect). A well-designed visual creates confidence even if the underlying data is concerning. A poorly designed visual creates doubt even if the data is strong. It's not fair, but it's consistent.
Use them. Company colors signal that you're following standards. They also create consistency across all corporate communications, which reinforces the professional signal.
Once per project cycle (monthly or quarterly). Don't redesign every week. Consistency matters more than novelty. If the underlying data changes, update the data, but keep the visual format the same.
Yes, but it's labor-intensive. You'll spend 1 to 2 hours creating it, then another hour updating it every time data changes. An Excel add-in like Office Plan reduces this to minutes.
Use two visuals: a boardroom-ready high-level timeline for the initial presentation, then a detailed Gantt chart as backup if they ask for more. Most won't.
No universal standard, but common patterns include: project name and status at top, timeline with phases below, milestones marked, risks and key metrics at bottom. Keep it simple and consistent.
Key takeaways
- Visual professionalism directly impacts how executives perceive project competence and status. This isn't vanity. It's how the brain processes information.
- Boardroom-ready visuals prioritize clarity over comprehensiveness. One message per visual. 5 phases, not 40 tasks.
- Professional styling (3 to 4 colors, readable fonts, intentional whitespace) signals control. Inconsistency and clutter signal chaos.
- The tool you use matters as much as the data. Excel is designed for analysis. Generating visuals requires a tool designed for communication.
- Keep detailed planning in Excel. Generate polished visuals from that same data using a tool like Office Plan, so your source of truth and your visual stay connected.
- Consistency across updates builds credibility. Use the same template, the same color scheme, the same structure every time.
- Never hide bad news in the visual. Transparency builds trust. Contradicting your own data destroys it.
Project management tips and tricks
Let your data speak with clarity
You've done the planning work. Your Excel data is solid. Now your stakeholders need to see it clearly, not buried in a spreadsheet they'll never read. Office Plan generates professional timeline visuals directly from your Excel data, right inside your spreadsheet. Clean colors, readable fonts, proper spacing, all applied automatically. When your data updates, the visual stays current. Your stakeholders see competence. Your data speaks for itself.