Data integrity for PMs: the 3-layer rule for building error-free project timelines
Learn the 3-layer rule for data integrity in Excel project plans. Keep raw data untouched, use calculation layers, and present in a separate layer.

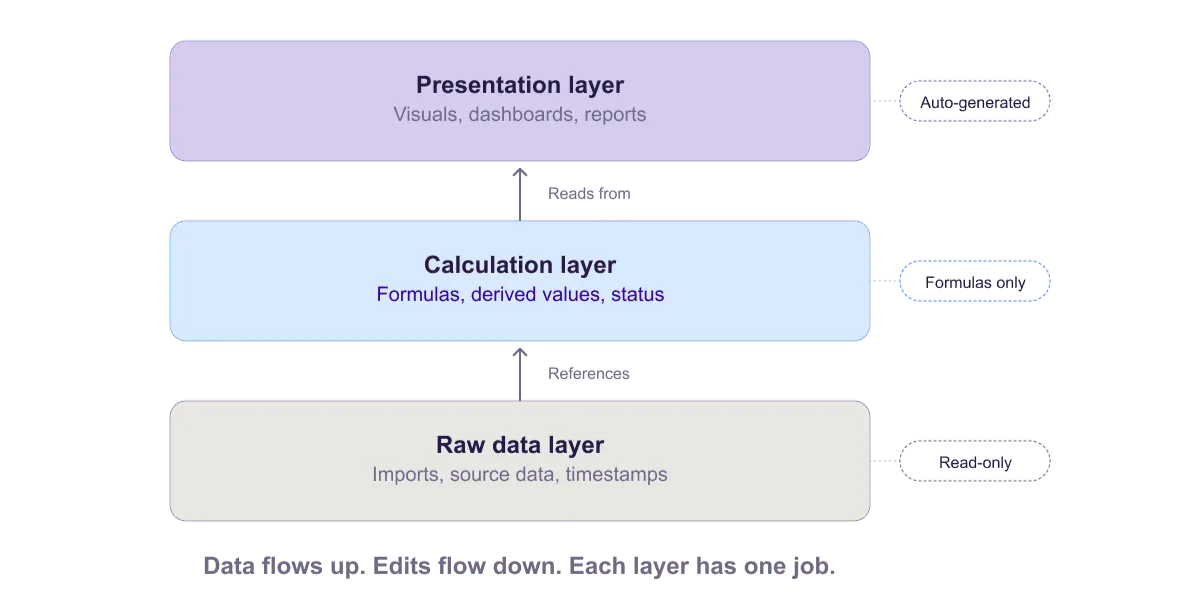
Three-layer data integrity architecture showing raw data (protected, read-only) at the bottom, calculation layer (formulas only) in the middle, and presentation layer (auto-generated visuals) at the top, with data flowing upward between layers.
Quick answer
The 3-layer rule maintains data integrity by separating raw data (imports, timestamps), calculation layer (formulas, derived values), and presentation layer (visuals, reports). Never edit raw data directly. Always calculate through formulas. Keep presentation separate. This architecture prevents accidental corruption, maintains an audit trail, and ensures every audience sees data they can trust.
Introduction
It's Tuesday morning. You're reviewing your project plan when you notice something's wrong. A task that's supposed to finish on 4/15 now shows 6/2. The duration is correct, but the start date somehow shifted back six weeks.
You search for what happened. Nobody deliberately changed it. But somewhere in the chaos of multiple editors, shared workbook conflicts, and manual updates, the date got corrupted. Now a formula that depends on that date is wrong, which cascades to other calculations, and your entire timeline is suspect.
This is the data integrity problem. In a shared, frequently updated spreadsheet, data corruption is inevitable unless you build explicit safeguards. When the data can't be trusted, the plan can't be trusted. And when the plan can't be trusted, every decision made from it is suspect.
The 3-layer rule is an architecture principle that prevents this. It's simple: organize your spreadsheet into three separate layers (raw data, calculation, and presentation) and enforce strict rules about what can be edited in each layer. The result is a project plan that stays accurate, auditable, and trustworthy as it scales.
Why project timeline data breaks
Before we solve it, let's understand the failure modes:
Accidental edits to source data. Someone is editing their task and accidentally shifts a date in the wrong cell. Or they delete a row thinking it's empty, not realizing a formula depends on it. The formula breaks silently.
Manual overrides of calculated values. A formula calculates that a task should end on 4/15. Someone manually types "4/16" into that cell, overriding the formula. Now the cell shows the wrong value, the formula is gone, and there's no audit trail of the change.
Circular references. A formula in cell A depends on cell B, which depends on cell C, which depends back on A. Calculations fail or produce false values.
Broken cell references. A formula references cell D5. Someone inserts a row, and D5 shifts to D6. The formula now references the wrong cell. Values are silently wrong.
Hidden assumptions. A formula works because it relies on unstated assumptions (e.g., "the first task always starts on row 2"). When that assumption breaks, the formula fails.
Lost audit trail. A date changed three weeks ago, but nobody can see what it was before. Was it supposed to be 4/15 or 4/16? No history. No explanation. Just the current value.
These failures are common in shared spreadsheets. Teams work around them by being careful, but care isn't systematic. The 3-layer rule makes integrity systematic.
The 3-layer rule explained
Divide your project spreadsheet into three distinct layers, each with specific purposes and edit rules:
Layer 1: Raw data
Purpose: Store original imports and manually entered source data exactly as it came in. Nothing changes here after import.
Contents:
- Raw imports from timesheet system, task tracker, or other sources
- Manual entries (task names, owner names, date entries)
- Timestamps of when data was imported or entered
- A copy of the original data before any edits
Edit rules: Once data is in the raw layer, it never changes. If source data needs correction, you correct the source, then re-import. All edits go through a version history so you can see what was imported and when.
Example:
| RAW DATA LAYER Import Source: Task Tracker API Import Date: 2025-03-10 10:15 AM | Task ID | Task Name | Start Date | Owner | Duration | |---------|-----------|-----------|-------|----------| | T001 | Requirements | 3/1/2025 | Alice | 10 | | T002 | Design | 3/12/2025 | Bob | 14 | | T003 | Development | 3/27/2025 | Carol | 21 | [This data never changes. Any edits happen in the Calculation layer.] |
Layer 2: Calculation
Purpose: Transform raw data into project timelines through formulas. All calculations live here, not in the raw data.
Contents:
- Formulas that calculate end dates (start date + duration)
- Rolled-up calculations (phase percent complete from task percentages)
- Derived values (days until due date)
- Status calculations (if date is past, task is "overdue"; if task is 100%, it's "complete")
Edit rules: No manual data entry in this layer (except for data that's not in the raw layer, like percent complete). All values are either formulas or direct references to the raw layer. If a value is wrong, you fix the formula, not the value. You can add new calculated columns, but not delete source columns.
Example:
| CALCULATION LAYER [All formulas reference Raw Data layer] | Task ID | Task Name | Start | Duration | End Date | Status | Days Until Due | |---------|-----------|-------|----------|----------|--------|----------------| | T001 | Requirements | =RAW!B2 | =RAW!C2 | =RAW!B2+RAW!C2 | =IF(TODAY()>End,OVERDUE,INPROGRESS) | =End-TODAY() | | T002 | Design | =RAW!B3 | =RAW!C3 | =RAW!B3+RAW!C3 | =IF(TODAY()>End,OVERDUE,INPROGRESS) | =End-TODAY() | [All values are formulas. No manual editing. Edit Raw layer to change source data.] |
Layer 3: Presentation
Purpose: Create visuals and reports for stakeholder communication. Never the source of truth. Always derived from the calculation layer.
Contents:
- Executive summaries (phase names, milestone dates)
- Charts and Gantt visuals
- Status reports and dashboards
- Print-ready reports
Edit rules: Presentation layer data is always read from the calculation layer via formulas. You don't manually type data here. This layer can have additional formatting and annotations. Never edit presentation-layer values to force a different visual.
Example:
| PRESENTATION LAYER [Pulls from Calculation Layer with formulas] PROJECT STATUS SUMMARY Total Tasks: =COUNTA(CALC!A:A)-1 Completed: =COUNTIF(CALC!F:F,"COMPLETED") On Track: =COUNTIF(CALC!F:F,"INPROGRESS") Overdue: =COUNTIF(CALC!F:F,"OVERDUE") Next Milestone: =MIN(CALC!D:D) [shows earliest end date] Milestones: - Requirements Complete: =FILTER(CALC!D:D, CALC!A:A="T001") - Design Complete: =FILTER(CALC!D:D, CALC!A:A="T002") [All values calculated from source. No manual entry.] |
How to implement each layer in Excel
Setting up the raw layer
Sheet name: "RAW_Data"
| Row 1: Headers | Headers | Headers Row 2-100: Imported data (never edited after import) Row 101: [Empty section with timestamp of last import] |
Protect this sheet: Go to Review > Protect Sheet. Choose "Allow users to: Insert rows, Delete rows, Sort, Filter." Uncheck "Edit contents of cells." Set a password if needed.
Now data can't be accidentally edited. Anyone can filter or sort to find data, but can't change values.
For imports: Use Power Query or data import tools to bring data in automatically. If manual, follow a checklist: paste data, verify against source, lock sheet.
Setting up the calculation layer
Sheet name: "PLAN" (or "Project_Plan")
| Row 1: Headers (Task ID, Task Name, Start Date, Duration, End Date, Status, %) Row 2-100: Formulas referencing RAW_Data sheet Row 101+: Summary calculations (Phase %, Milestones, Total duration) |
Protect specific columns: Select columns that contain formulas (like End Date, Status, Days Until Due). Go to Format Cells > Protection > check "Locked." Go to Review > Protect Sheet. Set "Allow users to: Edit contents of [unprotected cells]."
Now people can edit data cells (like percent complete) but can't accidentally delete formulas.
Formula examples:
| End Date column: =B2+C2 Status column: =IF(TODAY()>D2,"OVERDUE",IF(C2<=0,"COMPLETE","INPROGRESS")) % of project: =AVERAGE(H2:H50) |
Setting up the presentation layer
Sheet name: "Dashboard" or "Executive_Summary"
| Row 1: Project Title Row 2: Status (High-level indicator) Row 3: Timeline (Next milestone, launch date) Row 4-8: Summary metrics (tasks completed, on track, at risk) Row 10+: Charts and visuals (pulling from Calculation layer) |
Make read-only: Go to Review > Protect Sheet. Uncheck all "Allow users to" options. Users can read but not edit.
This ensures presentation data can't accidentally be changed, and everything flows from the calculation layer.
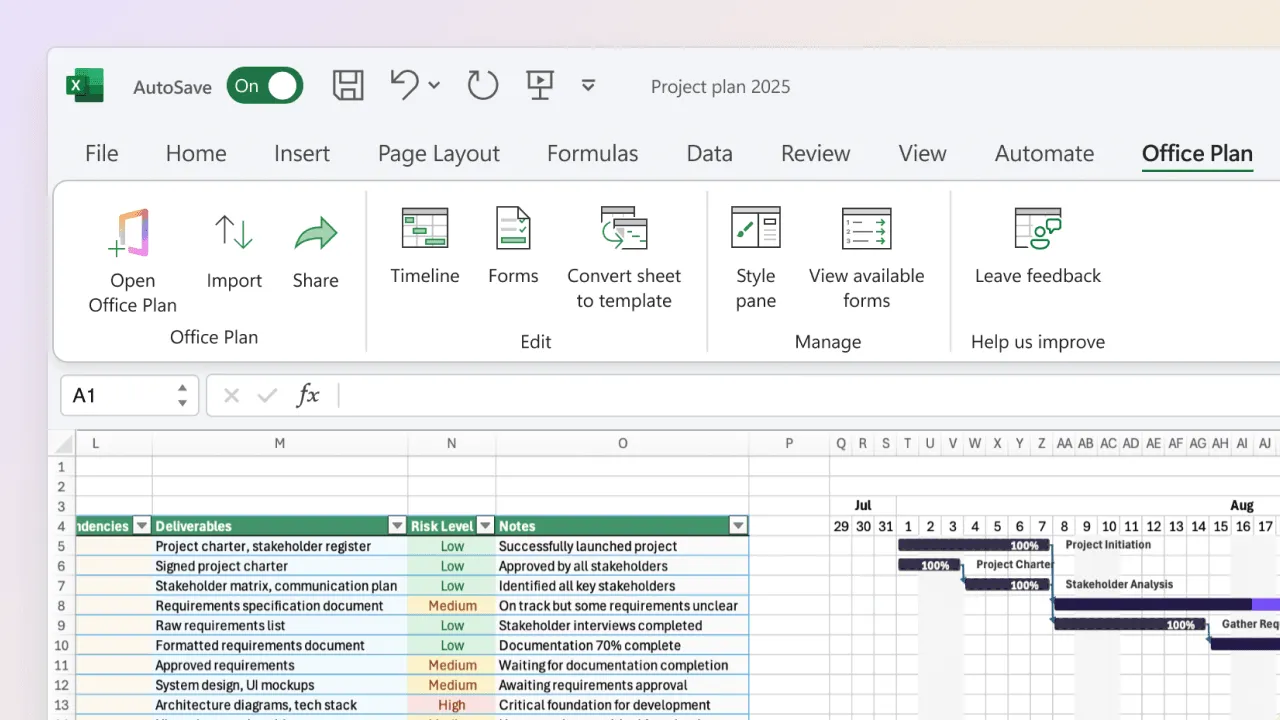
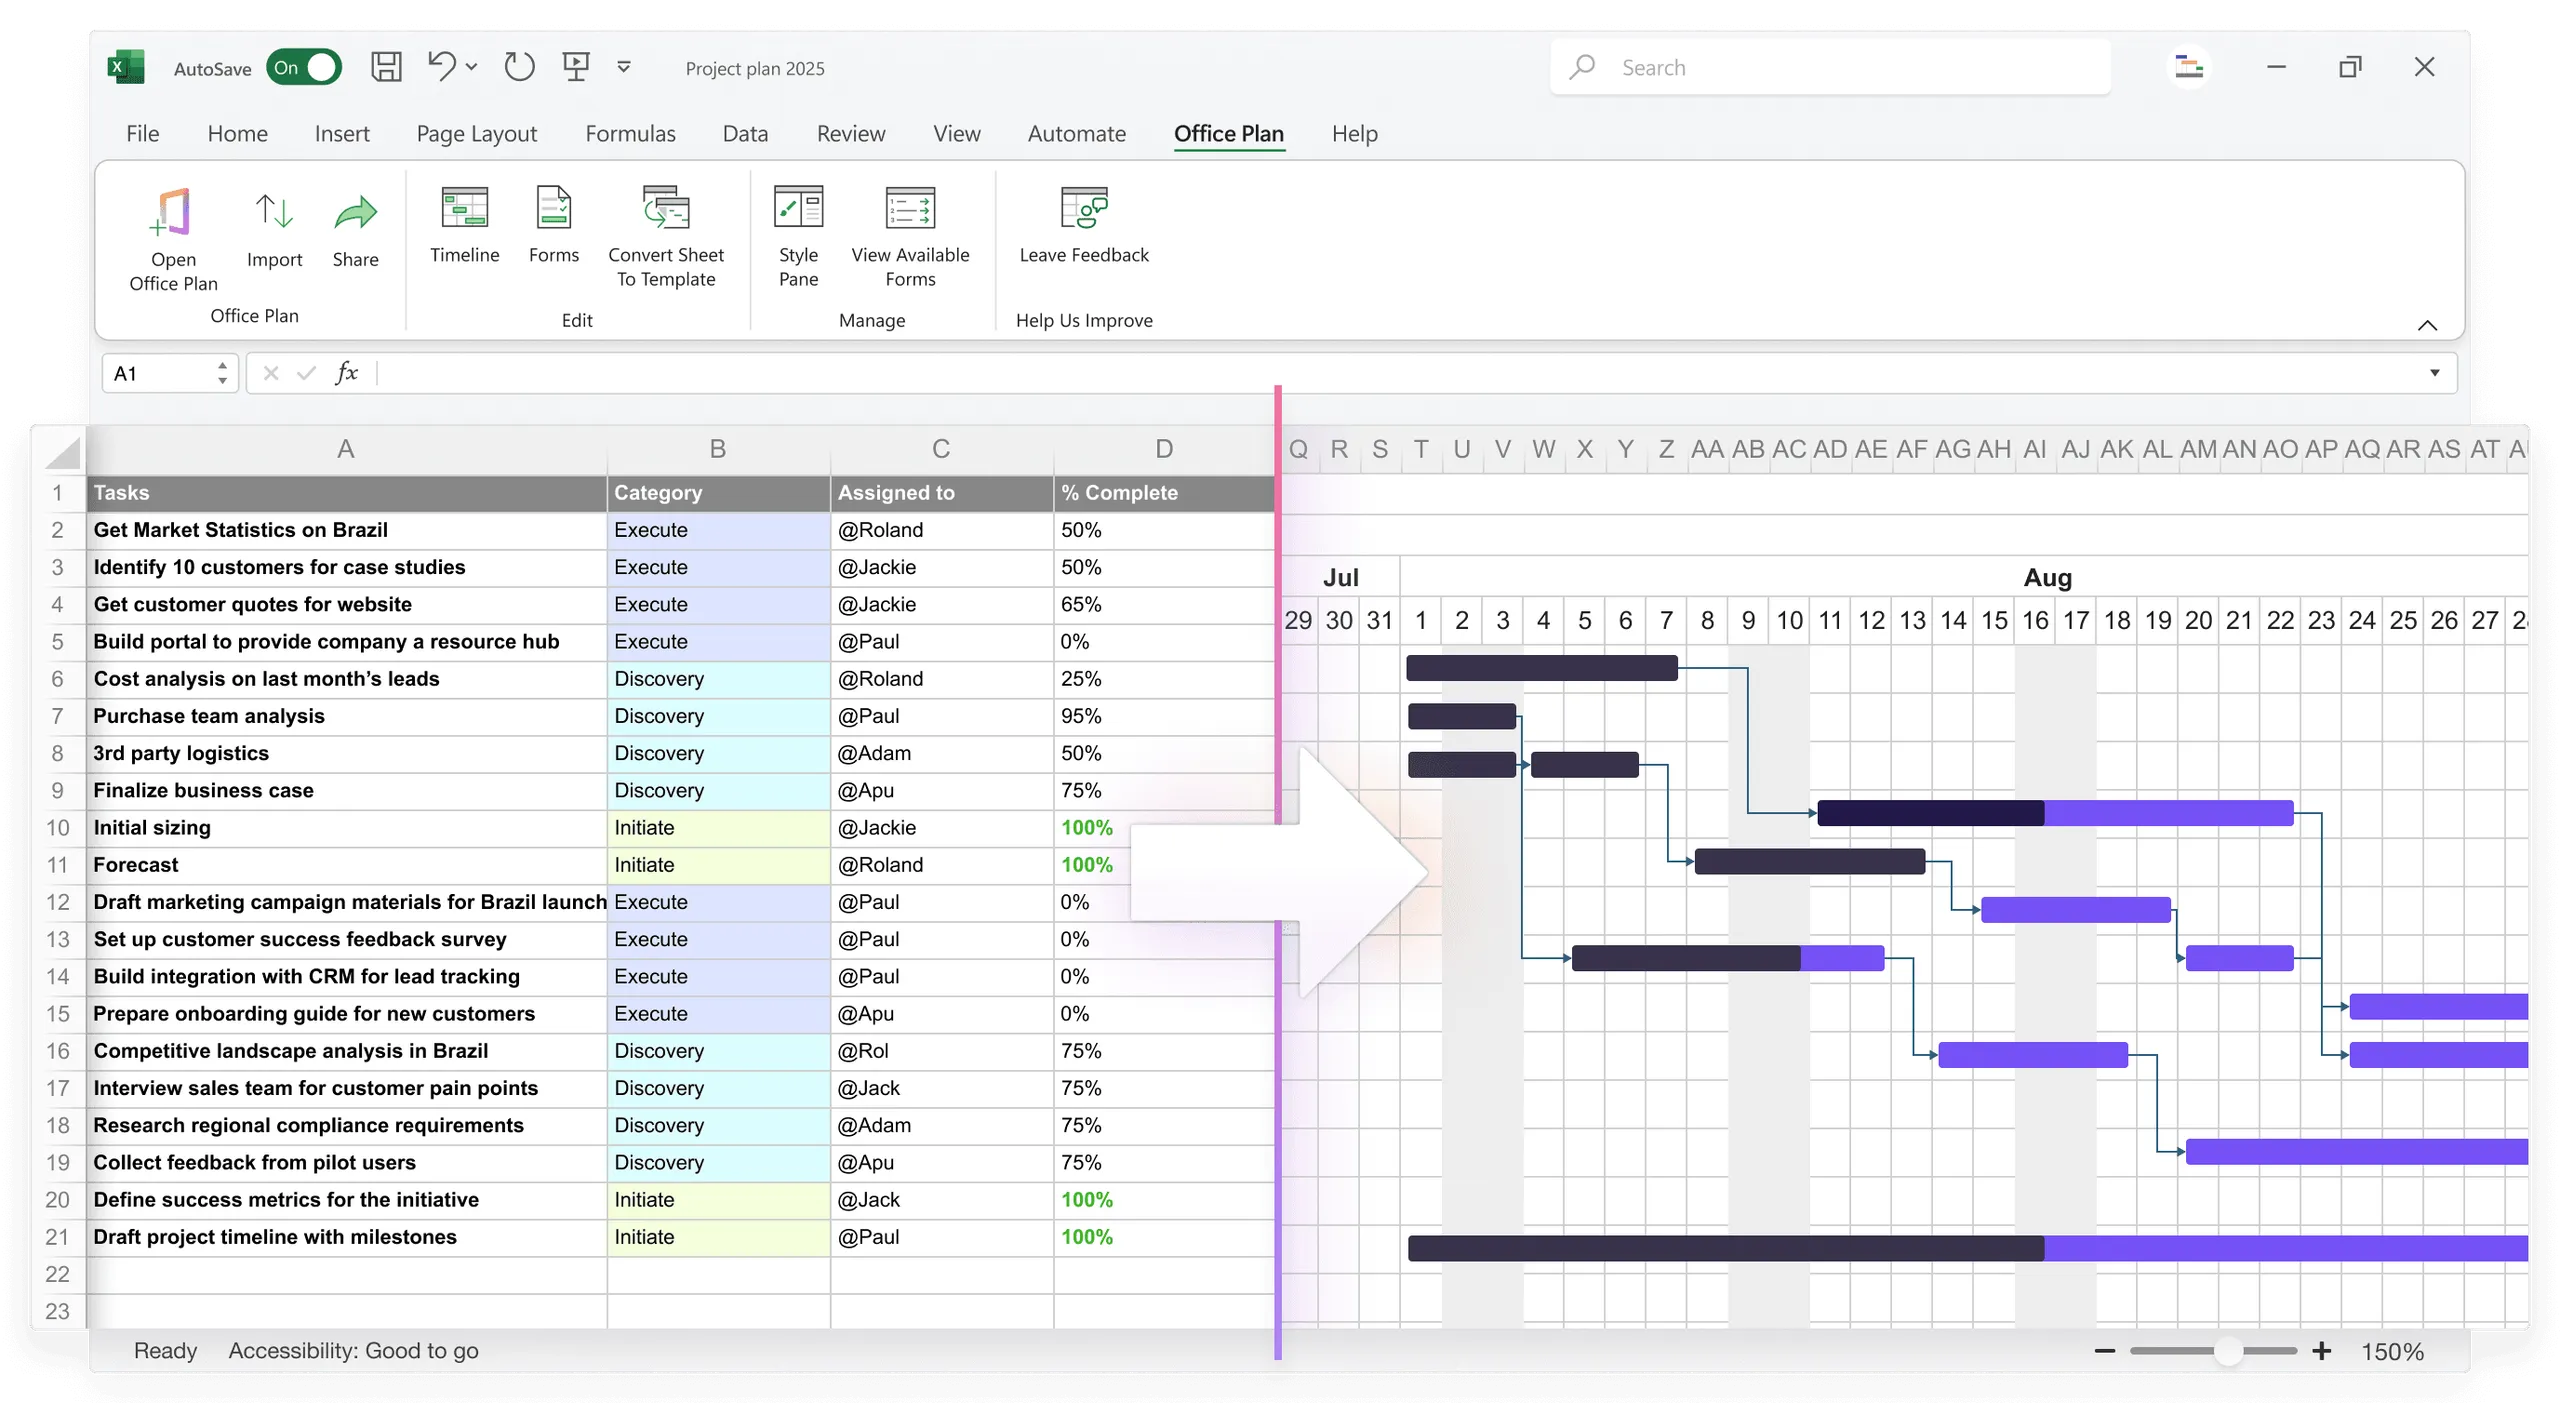
For teams that want a professional visual layer without maintaining a separate presentation sheet, Office Plan can serve as Layer 3. It reads your calculation layer data and generates a Gantt chart or timeline visual right inside Excel. The visual stays connected to the formulas. When calculations change, the visual updates. No manual translation between layers, no separate file to maintain.
Data validation techniques for project data
Beyond the 3-layer structure, enforce rules on what data can be entered in the first place:
Date Validation:
| If cell is [Start Date]: Data type: Date Allow: Dates >= Project start date Error message: "Start date must be on or after [Project start date]" |
Status Validation:
| If cell is [Status]: Data type: List Allow: "On Track" OR "At Risk" OR "Blocked" OR "Complete" Show dropdown: [List of valid values] |
Duration Validation:
| If cell is [Duration]: Data type: Whole number Allow: >= 1 and <= 250 Error message: "Duration must be between 1 and 250 days" |
These validation rules prevent bad data from entering the system. Prevention is always cheaper than correction.
Protecting layers from accidental editing
For raw data: Protect the entire sheet (read-only except for additions via import).
For the calculation layer: Protect formula columns. People can edit data cells but not formulas.
For the presentation layer: Protect the entire sheet (read-only).
For shared workbooks: In addition to protection, use Review > Track Changes to log all edits. Every change is recorded with who made it, when, and what changed. This creates the audit trail that makes the plan trustworthy.
How this principle applies beyond Excel
The 3-layer rule is an architecture principle, not an Excel trick. You see it everywhere:
Database design: Raw data (database) → Business logic (calculation) → UI/reports (presentation).
Data warehouses: Raw data lake → Transformation layer → Data mart (presentation).
Software development: Source code (raw) → Build/compilation (calculation) → Executable (presentation).
The principle works because it separates concerns: collecting data, transforming data, and presenting data. Each layer can be managed independently with appropriate safeguards. When something breaks, you know exactly which layer to investigate.
Common implementation mistakes
Doing all three layers in one sheet. Impossible to protect, easy to corrupt. Use separate sheets.
Manually editing calculation-layer values instead of fixing formulas. Formulas are overwritten, audit trail is lost, values become wrong. If a value looks wrong, check the formula. Don't override the value.
Importing data to the calculation layer, skipping the raw layer. Original data is lost. You can't trace back to source. Always import to the raw layer first.
Protecting sheets too restrictively. Users get frustrated and disable protection, defeating the purpose. Find the balance: protect formulas but allow data entry.
Not documenting which layer is which. New team members edit the wrong sheet and break things. Use clear sheet names and add a "Data Architecture" guide as a comment on the first sheet.
Frequently asked questions
You shouldn't. That breaks the architecture. If a value is wrong, fix the formula, not the value. If you need manual overrides (which should be rare), create a separate "Overrides" column outside the standard formula flow, clearly flagged.
Initially, yes. You spend more time setting up structure and protection. But it saves significant time later by preventing data corruption, broken formulas, and the debugging that follows. For projects beyond 20 tasks, it's a net time saver.
The 3-layer rule still helps. It prevents you from accidentally editing the wrong cell, overwriting formulas, or corrupting dates. Even solo PMs benefit from the discipline. Your future self will thank you when you can trace exactly where a number came from.
Create placeholder formulas in the calculation layer. For data that's manually entered (like percent complete), those cells are unprotected and you edit them directly. For calculated data (like end dates), protect those columns.
Yes, with similar techniques: separate sheets, protection rules, and formulas. Google Sheets is actually slightly better at this because it handles shared editing and version history more smoothly than Excel.
For projects under 10 tasks, the overhead may outweigh the benefit. For 10-20 tasks, it's worth it. For 20+ tasks or shared workbooks, it's essential. The more people touching the spreadsheet, the more the 3-layer rule pays off.
Key takeaways
- The 3-layer rule separates raw data (protected, never edited), calculation (formulas, derived values), and presentation (visuals, reports). This separation is what makes project data trustworthy.
- Raw data stays untouched after import. If it needs correction, correct the source and re-import. This preserves your audit trail.
- The calculation layer uses formulas to transform raw data into timelines, status indicators, and rollups. Protect formulas. Allow data entry only in designated cells.
- The presentation layer reads from the calculation layer. It's never the source of truth. Never manually edit presentation values to force a different visual.
- Data validation prevents bad data from entering the system. Constrain dates, statuses, and durations at the input level.
- Sheet protection and change tracking enforce the architecture. Without them, the layers exist in theory but not in practice.
- This principle scales beyond Excel. It's the same architecture used in databases, data warehouses, and software development. Separating concerns prevents cascading failures.
- For the presentation layer, tools like Office Plan generate visuals directly from your calculation layer inside Excel, keeping all three layers connected in one file.
Project management tips and tricks
Keep all three layers connected in one place
The 3-layer rule protects your data integrity. But maintaining a separate presentation file introduces a new risk: the visual drifts from the data it's supposed to represent. Office Plan keeps Layer 3 connected to Layer 2. It reads your calculation layer and generates a professional Gantt chart or timeline right inside Excel. When formulas recalculate, the visual updates. One file. Three layers. Full integrity from raw data to stakeholder-ready visual.