It is common to present project plans, proposals and project reviews to clients and executives in PowerPoint. In this tutorial, we will show you how to prepare a Gantt chart with Microsoft Project and how to export it to PowerPoint.
Microsoft Project Gantt charts in PowerPoint
Microsoft Project is a strong planning tool but produces complex Gantt charts that are difficult for audiences to follow. In this tutorial, we demonstrate two options for preparing project plans as PowerPoint presentations:
a) The first covers some of MS Project’s hidden features. It demonstrates how to use the Gantt Chart Wizard, Task Bar Format tool and the Copy Picture feature to prepare your visual. The end result will be a Microsoft Project image that can be copied and pasted into PowerPoint.
b) The second tutorial explains how to import Microsoft Project Gantt chart data into PowerPoint with the Office Timeline add-in. This method converts .MPP files into PowerPoint slides that can be shared, edited, and updated whenever your MS Project data changes right inside PowerPoint.
Which MS Project Gantt chart tutorial would you like to see?
Make a regular Gantt chart in Microsoft Project
How to use the Gantt Chart Wizard and Copy Picture Feature
Presentations to clients and executives need to be simple and easy to understand. Microsoft Project’s Gantt charts are often complicated but using the Gantt Chart Wizard can help make them more comprehensible. If the Gantt Chart Wizard is hidden in Microsoft Project, you will need to add it to the ribbon by following these steps.
1. Add the Gantt Chart Wizard to Microsoft Project ribbon.
a) Click on File > Options > Customize Ribbon.
b) In the right column beneath Main Tabs, right-click the tab where the Gantt Chart Wizard button will be added and select Add New Group. This adds a new section to that tab of your Microsoft Project ribbon.
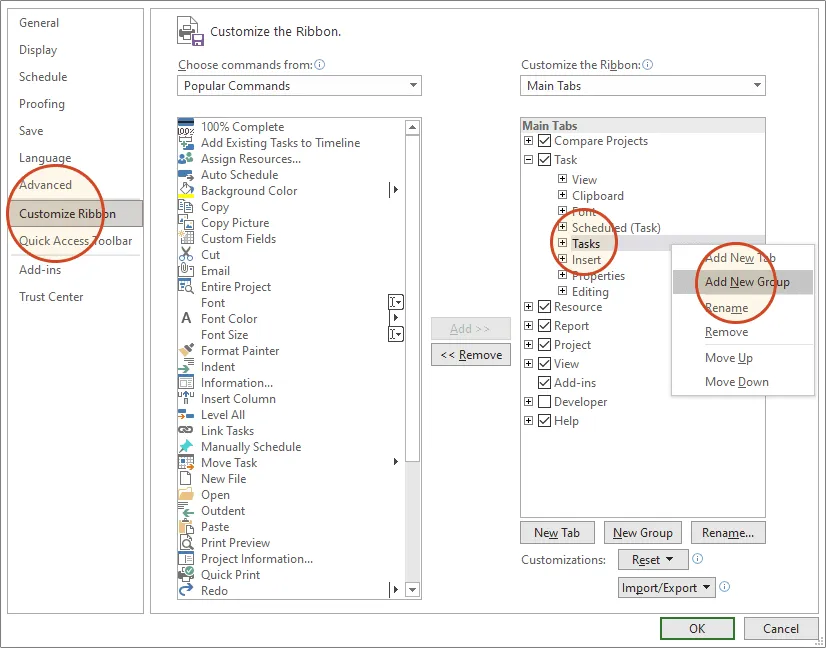
c) The new section will be listed as New Group (Custom). Righ click on New Group (Custom), rename it, and then click OK. We called ours Project Visuals.
d) Staying in the Project Options window under Choose commands, select Commands Not in the Ribbon.
e) In the column on the right, highlight the new group you created at step C (in our case, Project Visuals). In the left column, scroll down and select Gantt Chart Wizard and then Add to include the Gantt Chart Wizard in your new group. Click OK to exit.
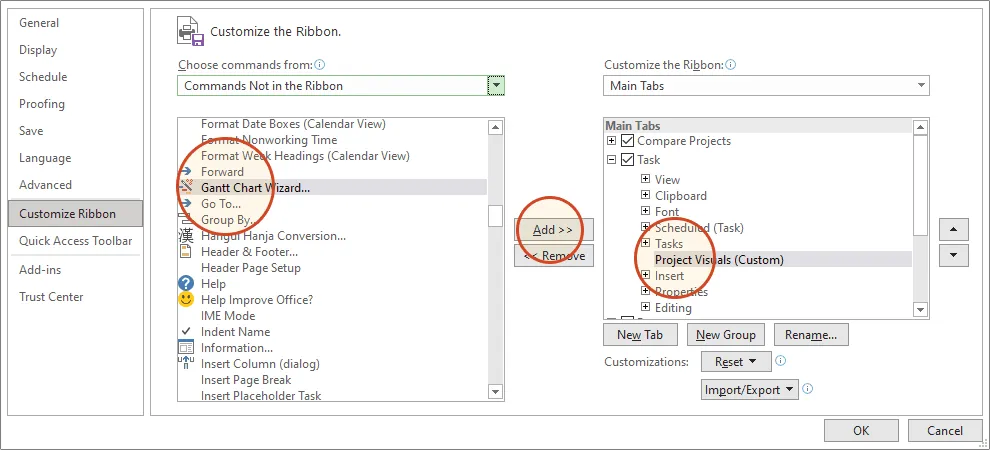
f) You will now see the Gantt Chart Wizard in Microsoft Project’s ribbon. In our example, we placed it on the Task tab in the section Project Visuals.
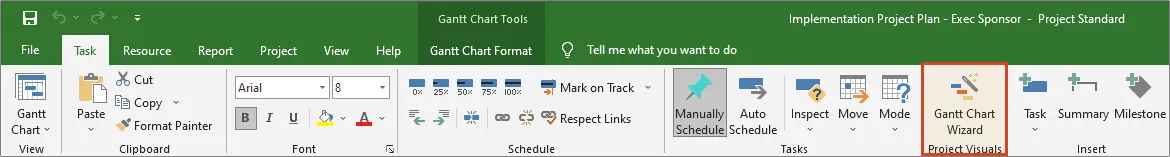
2. Use the Gantt Chart Wizard to prepare your visual for PowerPoint.
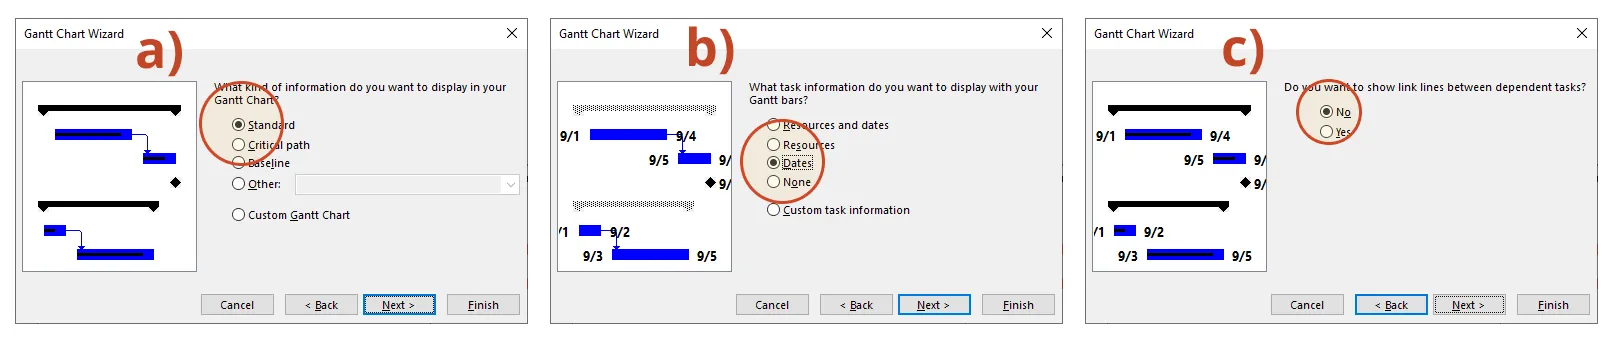
a) After you click on the Gantt Chart Wizard button, the first styling option you get is to select what type of Gantt information you want to display. For client and executive presentations, keep project visuals simple to understand by displaying only Standard information.
b) The second step of the Gantt Chart Wizard allows you to select the type of text you want to display alongside your task bars. For clarity purposes, we selected Dates. Further down in this Microsoft Project tutorial, we’ll show you how to add extra information to any task.
c) The final step of the Gantt Chart Wizard is to select whether you want to display links between tasks with dependencies. To keep the MS Project Gantt chart as simple as possible, we chose not to show link lines.
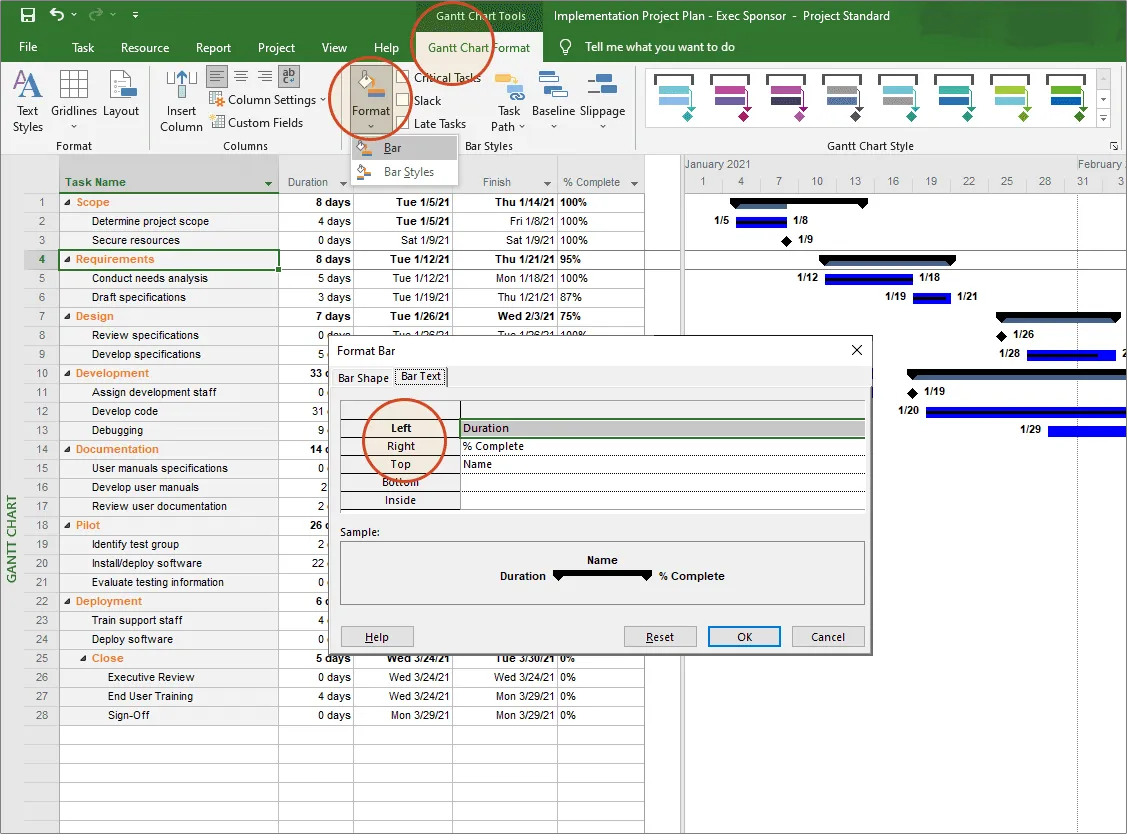
3. Use the Gantt Chart Format task bar features to add detail.
a) From the Gantt Chart Format tab, drop down the Format control to change the appearance of your tasks. Here you can add and rearrange important elements to your MS Project Gantt chart. In our example, we added titles (name), durations and % complete for each summary task.
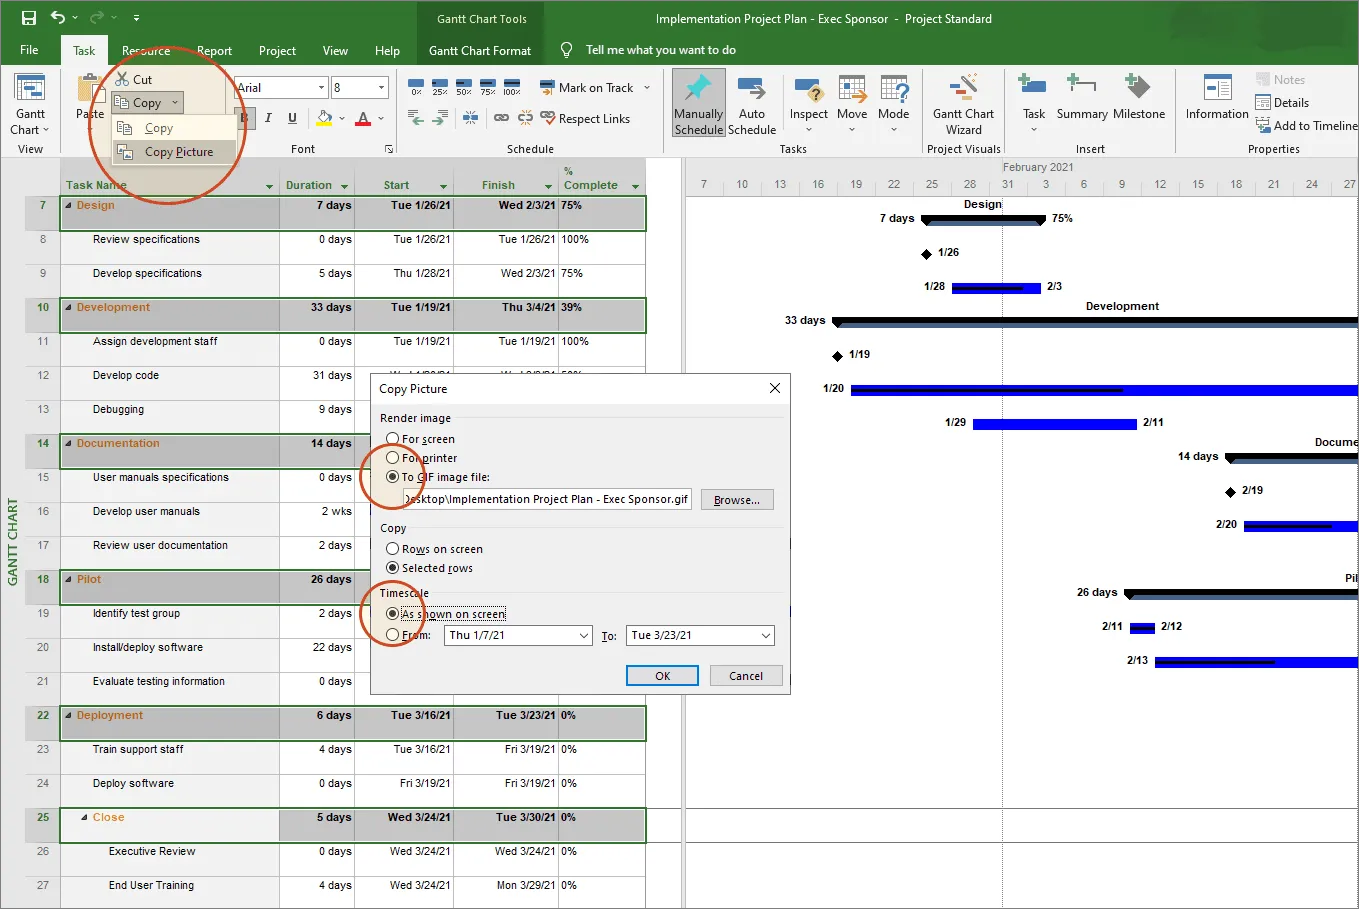
4. Use the Copy Picture tool for selecting the tasks to display on your slide.
Now you need to create an image that you can copy and paste into PowerPoint. Microsoft Project has a feature called Copy Picture which allows you to choose which tasks you want to show on your visual. This is useful for paring down project tasks to the ones that are critical for your presentation.
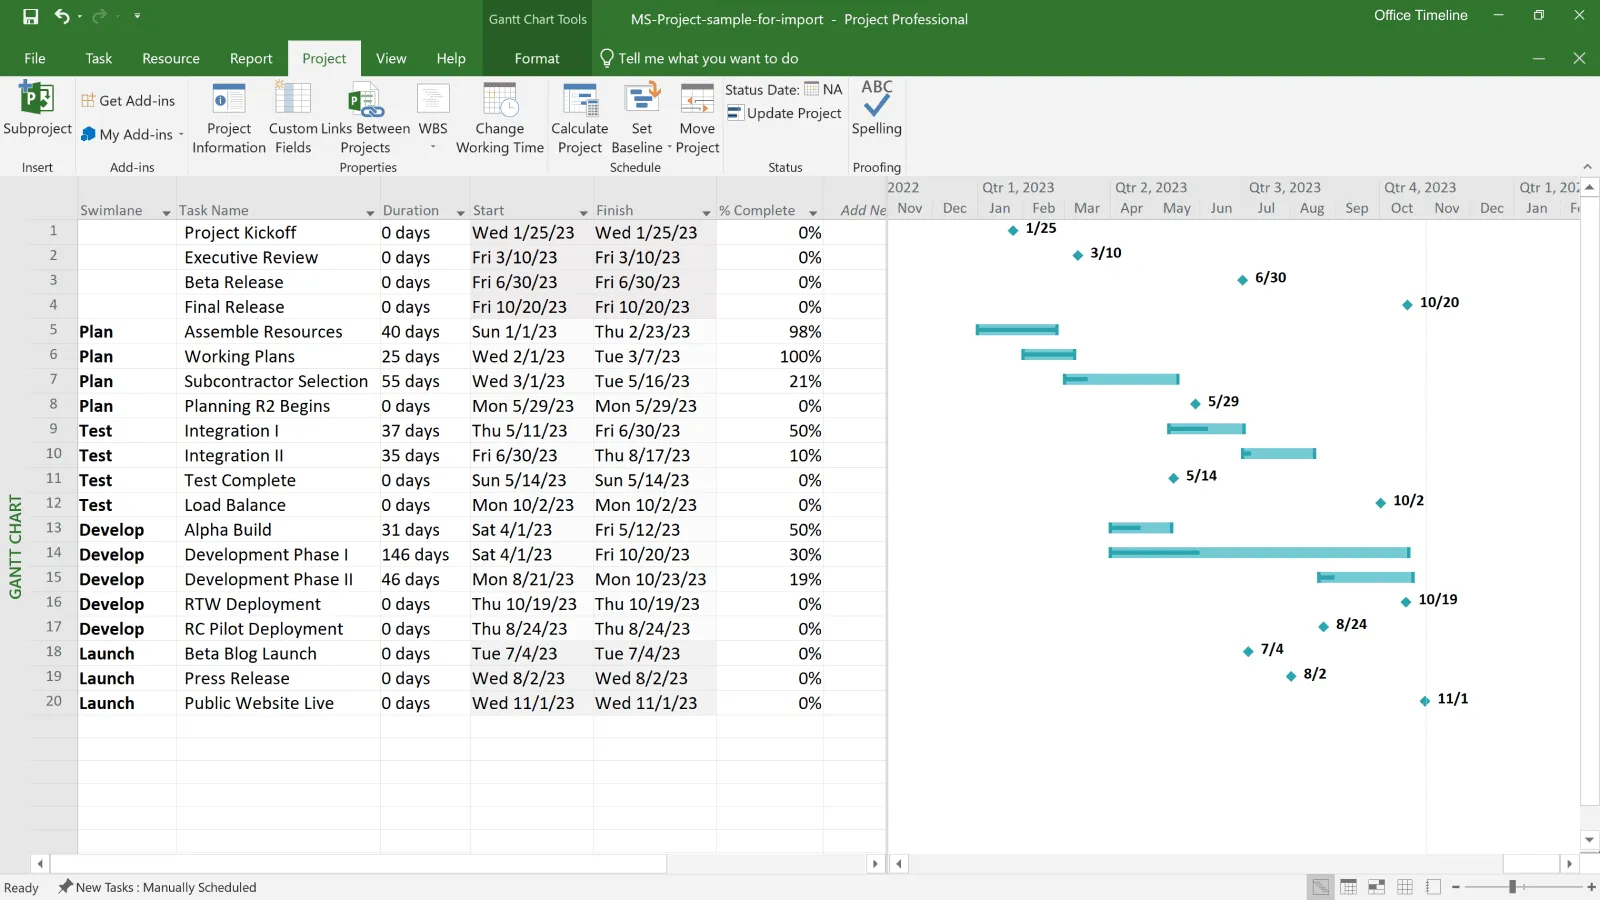
a) On your View tab in Microsoft Project, go to the Data section, and select the Summary tasks option in the Filter category to view just the major ones. Then, select all the task rows you want to be displayed on your image (hold CTRL + click to select each item). In the example below, we selected all our Summary Tasks rows
b) On the Task tab, drop down the Copy button to find the Copy Picture control.
c) Choose to render image as a GIF file if you want to save it locally or select For screen if you want to copy and paste the image directly into another program.
d) Choose to Copy Selected Rows.
e) Set your timescale and click OK. In our example, we set the timescale to ”As shown on screen”.
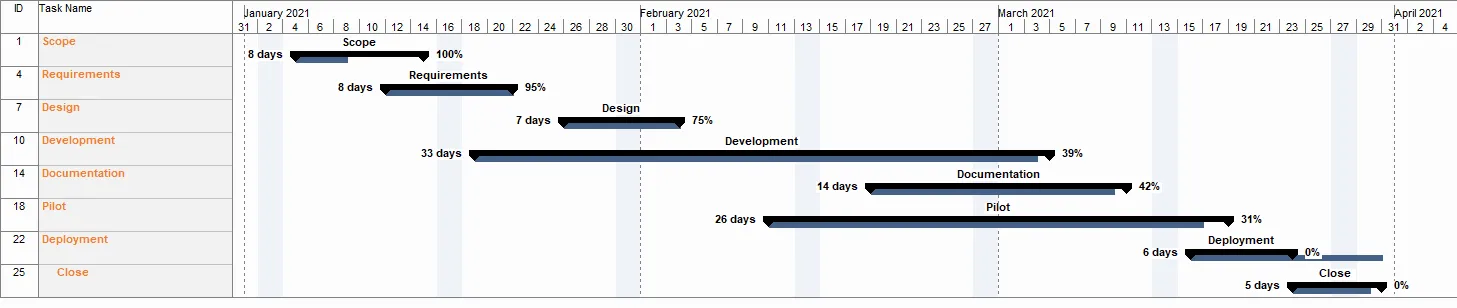
f) Here is the final Gantt chart graphic produced by Microsoft Project. You can share this Gantt chart with your stakeholders by inserting it into a new PowerPoint slide or an email. You can also crop out the task names for more clarity.
So far, we’ve demonstrated how to format your Microsoft Project Gantt chart into a presentable graphic and how to paste it into PowerPoint as a static image.
To find out how to import your .MPP file into PowerPoint and how to refresh your slide to automatically update it whenever your Microsoft Project data changes, read the section below.
Download the sample Microsoft Project Gantt chart file
If you’d like to use the Gantt chart created in this guide as a template to help you move faster, you can download the file below, free of charge.
Get this free Gantt chart template
Make a Gantt chart in PowerPoint using MS Project data
PowerPoint is a visual application and, therefore, better suited for creating the type of visuals your clients and executives expect. Office Timeline is a PowerPoint add-in that imports data directly from Microsoft Project and transforms it into professional Gantt charts instantly.
Since all these automatically generated graphics are native PowerPoint slides, they can be opened, shared, presented, updated, or edited by anyone who has PowerPoint installed.
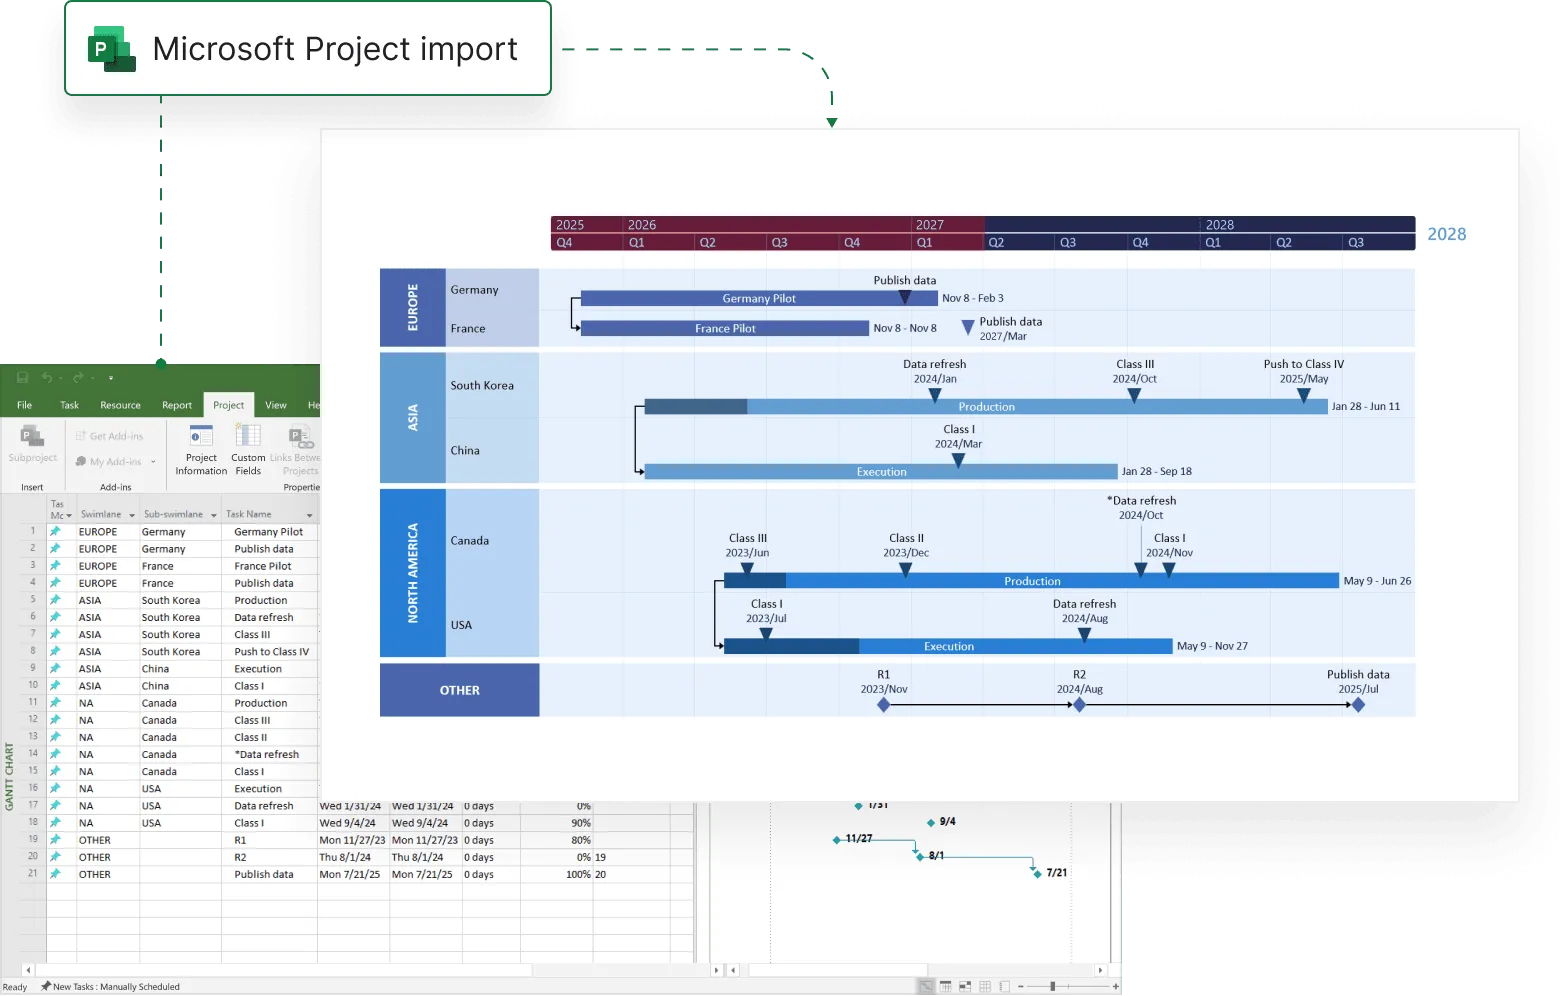
In the tutorial below, we will show you how to quickly import Microsoft Project data directly into PowerPoint using Office Timeline’s Microsoft Project import wizard. You will also learn how to refresh the slide instantly after you make changes to the .MPP file.
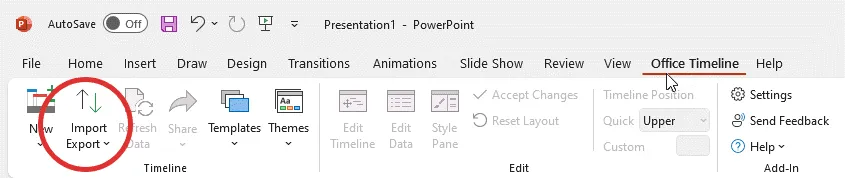
To get started, you first need to install Office Timeline's free trial, which will add a timeline maker tab to the PowerPoint ribbon (image below).
Import Microsoft Project data into PowerPoint
a) Open PowerPoint and click the Import button on the Office Timeline ribbon tab.
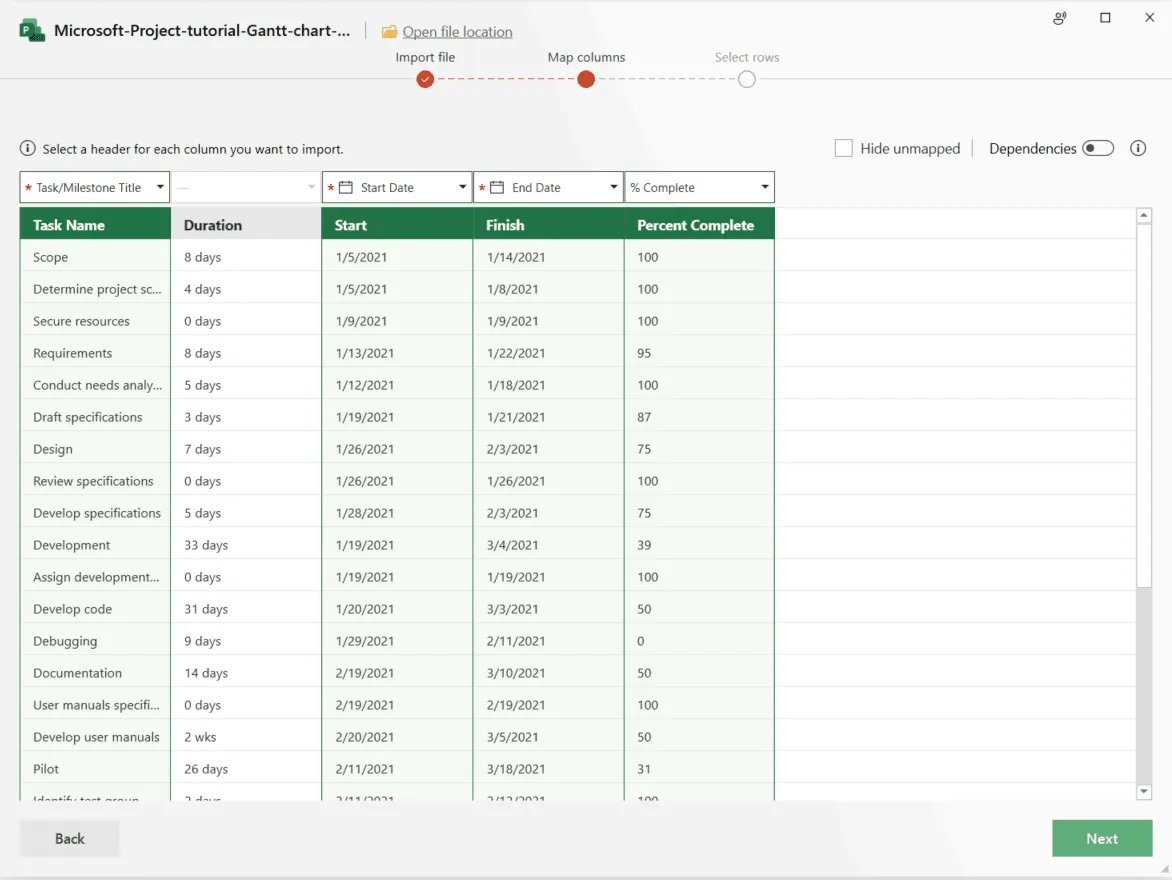
b) Click on Microsoft Project in the Import wizard and select the .MPP file you wish to load.
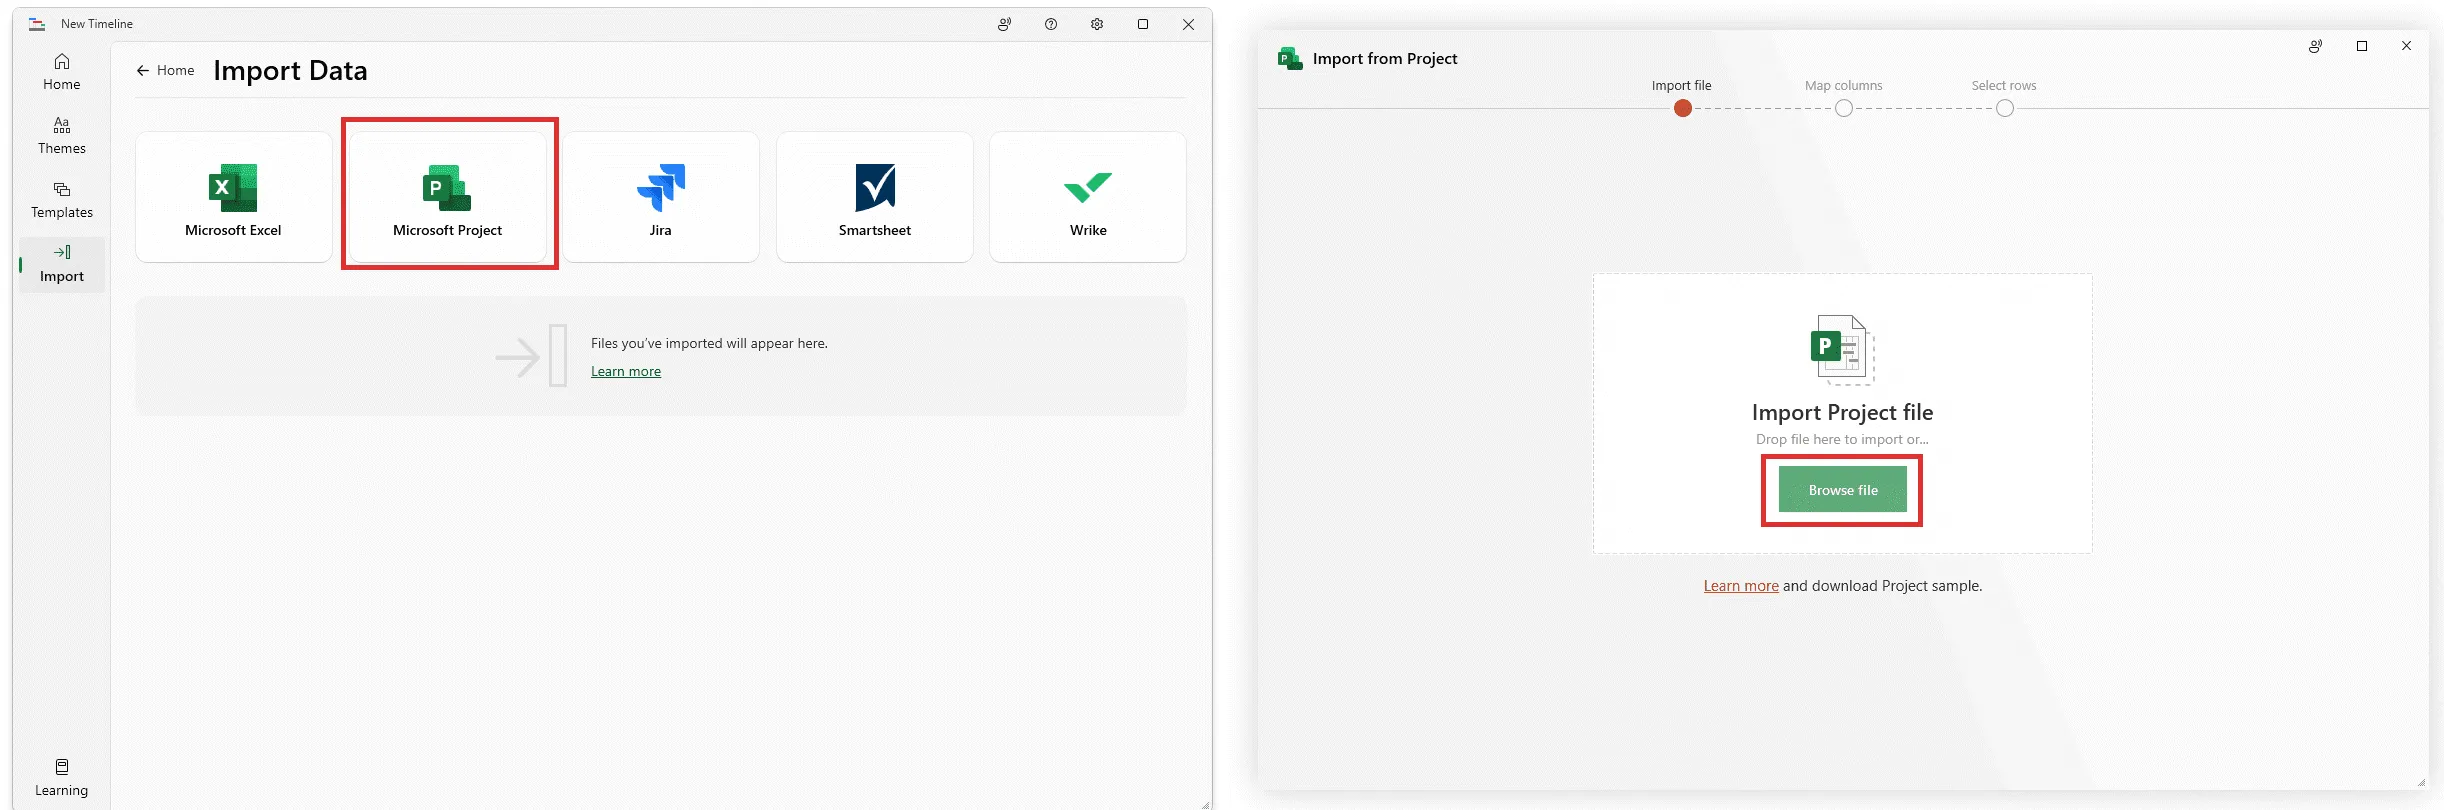
c) Next, Office Timeline will map the columns in the .MPP file, but you can make changes if there are any mismatches.
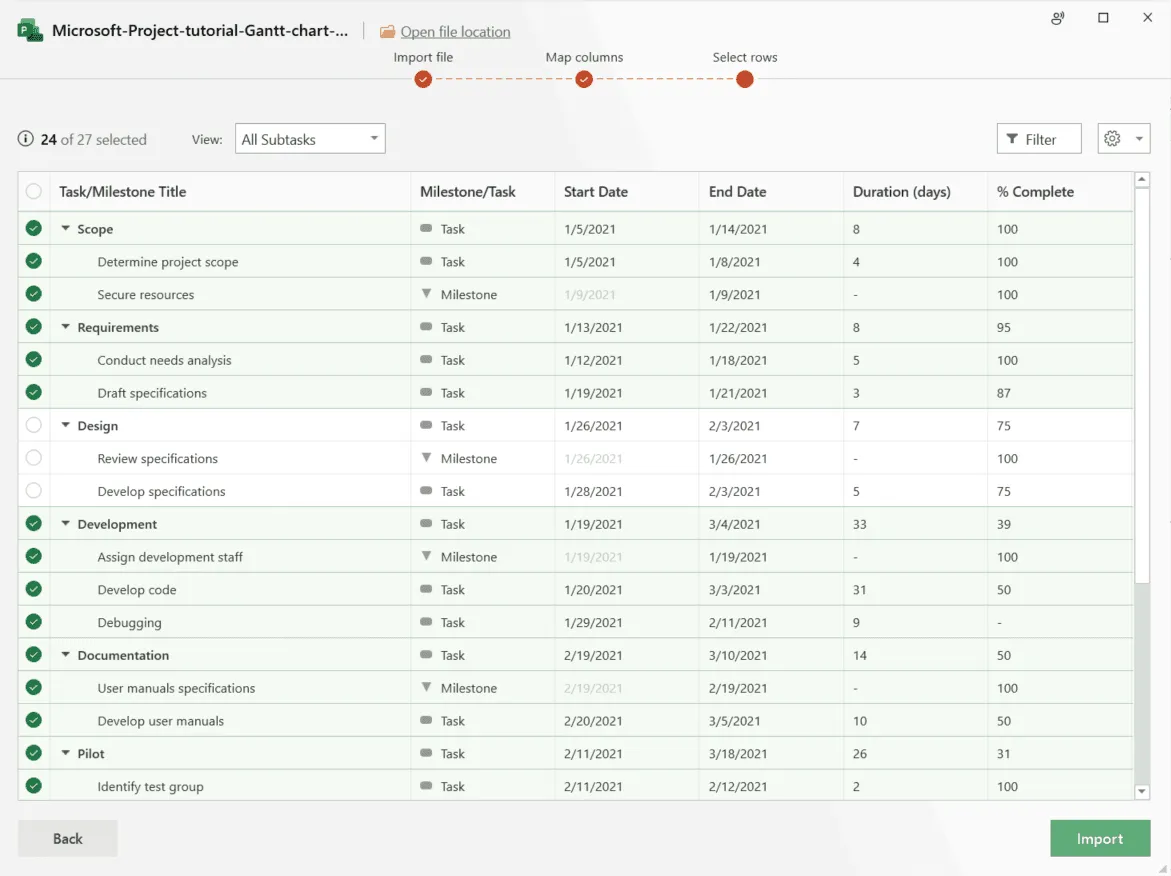
d) Now, from the .MPP import list screen, select what MS Project data you would like to import by ticking or unticking them. You can choose to display some of the imported items using the Outline or the Filter options.
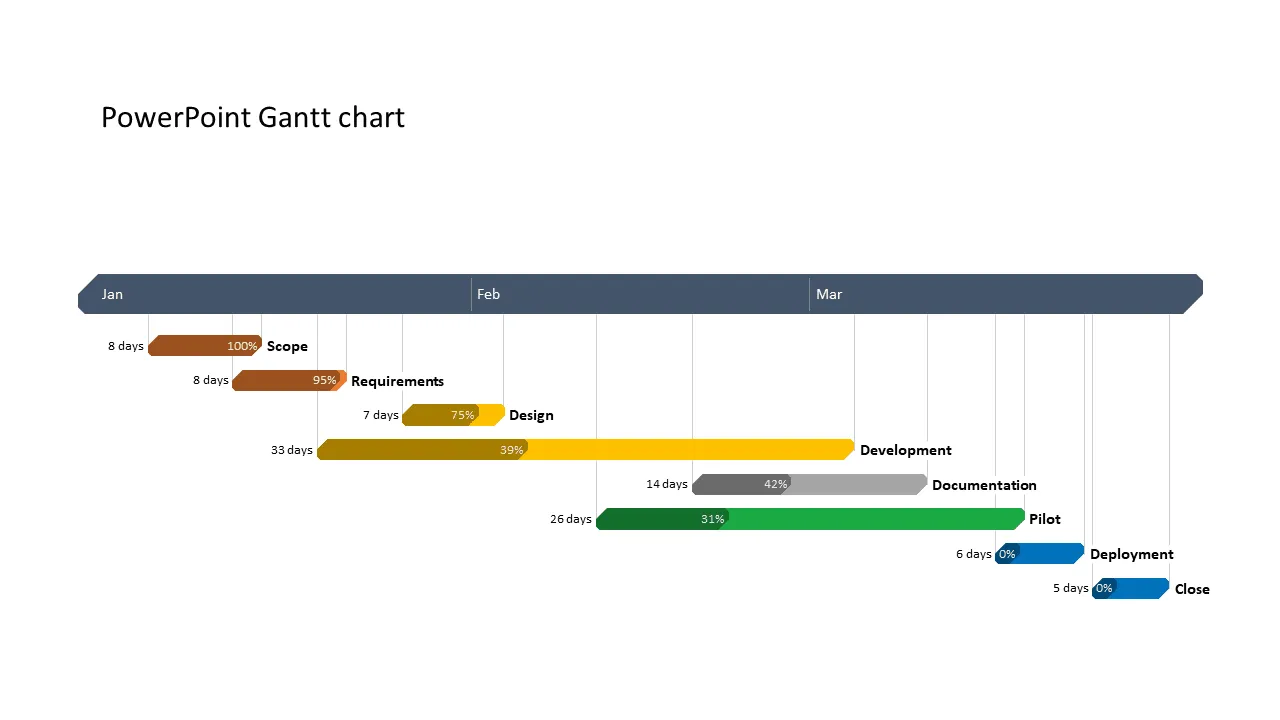
e) Office Timeline will instantly create a PowerPoint Gantt chart slide from your Microsoft Project data. This one took around one minute to make:
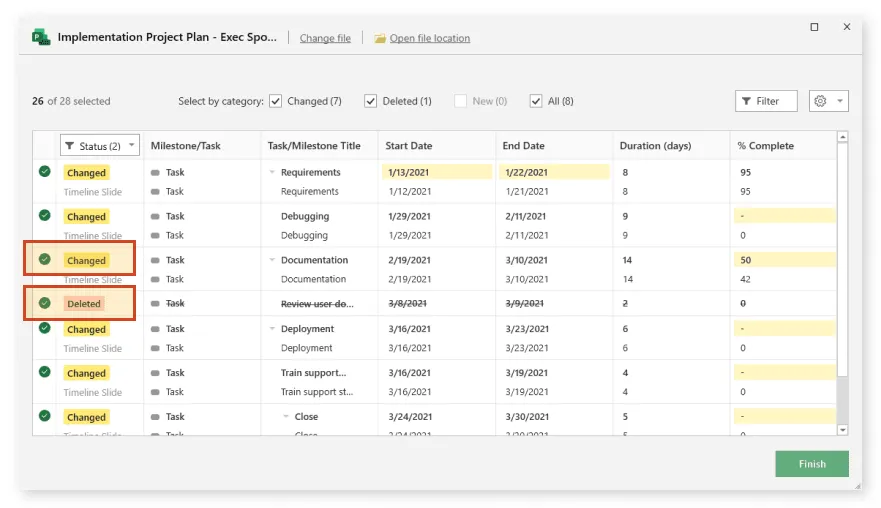
f) Click the Refresh Data button on the Office Timeline ribbon to update your Gantt whenever the data changes in your Project file. The Refresh wizard will identify any changes to the .MPP file. It’s worth noting that Refresh data is a one-way process, and your Project file will not be affected in any way. Select the changes you want to keep and click Finish to update your Microsoft Project Gantt chart.
Download the sample PowerPoint Gantt chart file
If you’d like to use the Gantt chart created in this guide as a template to help you move faster, you can download the file below, free of charge.
Get this free Gantt chart template
See how to make a PowerPoint Gantt chart from MS Project in under 3 minutes
Play Video
FAQs about Microsoft Project Gantt Charts
When using MS Project to make a Gantt chart that is more complex, you might encounter pagination issues, like your graphic spanning too many pages. That can be problematic when you present it to your stakeholders and execs. Fortunately, there are a few options available:
- Manually adjusting the timescale on your graph;
- Fitting the timescale to End of Page;
- Scaling the entire project;
- Importing the MS Project data into Office Timeline and allowing the add-in to adjust the timescale automatically based on the dates of the tasks.
Start out by clicking on View then select Timeline to adjust the display mode of your graphic. From there, select the tasks and milestones you’d like to show and click Add to Timeline. You can use the Format section to adjust the date range, colors, or text style, and even create multiple timelines. Another way to go about it is to simply import the .MPP file into Office Timeline, apply a professionally designed Gantt chart template and let the add-in do the work for you.
Multiple Gantt chart makers are available in both online and offline versions. To select the best one for you, it’s worth taking into account your personal requirements in terms of complexity, learning curve and value for money. If you want to look at a comparison, check out our article on the best Gantt chart makers available today.
Many tools on the market offer either a free version, a freemium model or a free trial. After you try them out and depending on the complexity of your project, it might be better to consider investing in a decently priced app that will save you time and money in the long run.