Overview
The simplest way to outline a clear project schedule and direct it towards completion is by using a Gantt chart. Displaying activities (tasks or events) against a certain timeframe for projects of all sizes, a Gantt chart effectively shows what work needs to be done and when.
To help you better grasp and apply the concept of Gantt charts, we’ve gathered here a few useful resources, including a free downloadable Gantt chart template and tips on how to easily create such a graphic.
What is a Gantt chart?
A Gantt chart is a type of bar chart that illustrates a series of tasks over a period of time. By displaying the list of activities to be completed within a project, along with their start and end dates, a basic Gantt chart provides a clear visual representation of a project schedule.
What should be included in a Gantt chart?
The overall layout of a basic Gantt chart depends on the nature of the project for which the graphic is used. However, the following elements should be included in any Gantt, regardless of the type of project with which one is dealing:
- List of tasks and milestones involved;
- Task descriptions;
- Start date;
- End date;
- Task duration;
- Percent complete;
- Task owner(s).
How do you read a Gantt chart?
You should look at a Gantt chart as a diagram with two axes – a vertical and a horizontal one. The vertical axis of the Gantt chart shows all the project tasks to be performed, each of them being represented by a bar on the graphic. The horizontal axis defines the time period over which these activities are planned. The position and width of a bars reflect the start date, duration and end date of its assigned activity.
Why is a Gantt chart useful?
Visually combining the activities required to achieve an objective with a timescale, Gantts are the most frequently used when planning, scheduling or reporting on a project. They are effective and powerful illustrations because they provide a quick snapshot of what needs to be done and when.
How do you make a simple Gantt chart?
Here are the basic steps you need to take in order to create the outline of a basic Gantt chart:
- List the main activities that make up the work breakdown structure of your project;
- Sequence these activities in a logical order;
- Estimate and allocate resources for each activity;
- Estimate the duration of your activities, by giving them a start and an end date.
Once you’ve compiled this information, you can turn it into an actual Gantt chart using pre-built Gantt chart samples like the template above, office tools (such as Microsoft Project, Excel or Word), or dedicated Gantt chart software.
How do you create a basic Gantt chart in Excel?
To make a basic Gantt chart using Microsoft Excel, here is what you need to do:
- In an Excel table with four columns, list your project information as follows: Start Date; End Date; Task Description; Duration (expressed in days).
- From the Insert menu, add a Stacked Bar chart to your Excel spreadsheet.
- Add the start dates, durations and descriptions of your tasks to the chart using the Select Data function.
- Format your stacked bar chart to turn it into a Gantt one using the Format Data Series function.
To find out more on how to build and customize a Gantt chart in Excel, please read our full Excel Gantt chart tutorial.
Why use the basic Gantt chart template?
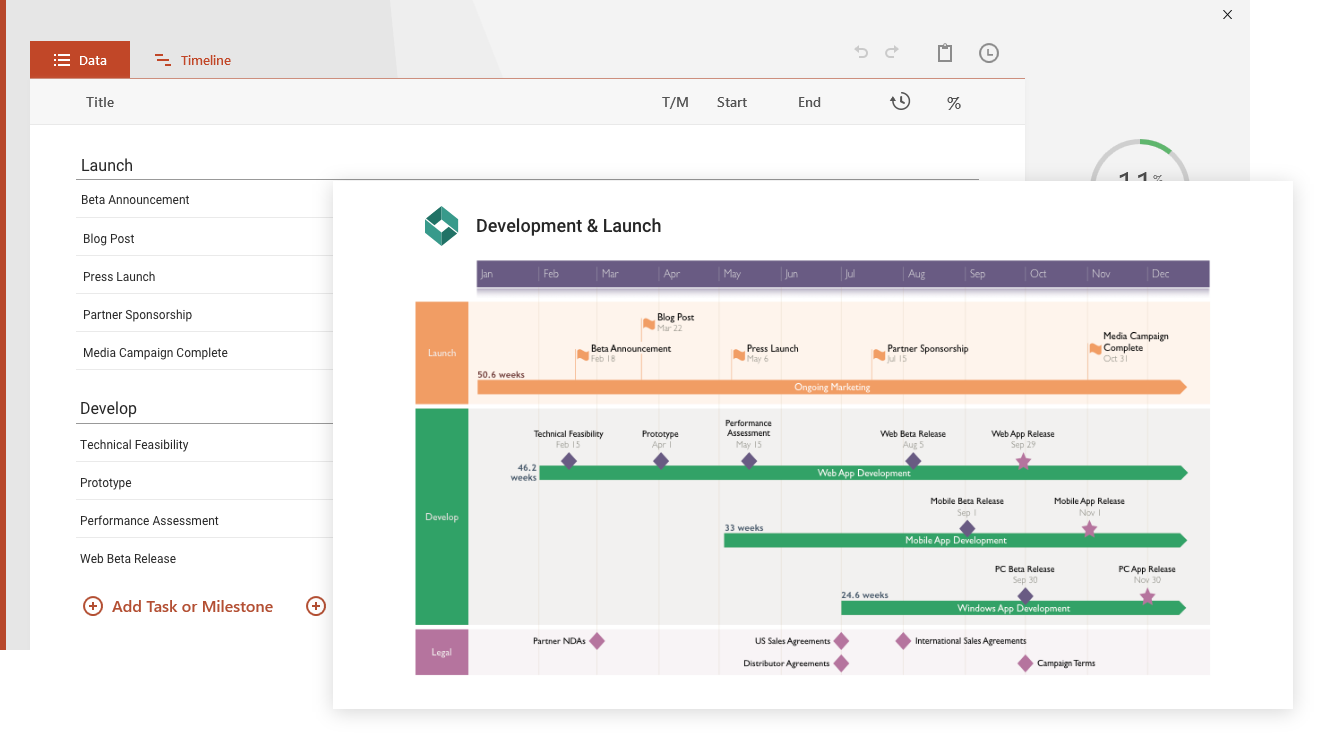
This simple Gantt chart template was designed to allow users to effectively plan and communicate projects at a high level. Featuring a clear, easy-to understand format, it will help you present project data to clients and executives, or any audience for that matter.
First devised in the late 1890s and manually drawn to show a project schedule, Gantts have changed over time. Today’s typical Gantts are created with project management software, and they can become complex visuals including detailed information such as:
- Baseline comparisons;
- Slip schedules;
- Earned value;
- Budget cost for work performance calculations.
Despite the value that such level of detail can bring to project managers, heavy and complicated Gantt charts can be ineffective for non-project people like clients, executives and other stakeholders. If you aim to present data-rich plans efficiently, the best Gantt chart template you can use is one that conveys the main points in a straightforward manner.
Our basic Gantt chart template was created to meet this need as it ensures a high-level summary view of a project, thus easily communicating the big picture and overall progress of its planned activities.
Furthermore, being made with the popular and familiar PowerPoint platform, this and all our other Gantt chart templates are easy to download, edit and share. Teams can easily collaborate on this presentation-ready Gantt chart PowerPoint template, and stakeholders can easily read, share or include the slide in their presentations.
How to update the basic Gantt chart template
The basic Gantt chart template was created to work natively with the Office Timeline Gantt tool for PowerPoint. Using its free 14-day trial, you can automatically create and update Gantts, as well as integrate with project management software like Microsoft Project and others. Therefore, you can quickly import your existing data and instantly have it transformed into a beautiful PowerPoint Gantt chart sample that can be revised as quickly as your stakeholders need updates.


