Top 10 Gantt Chart Makers
Boost your project management game with our Top 10 Gantt Chart Makers. Streamline task tracking and stay on track with precision. Discover the perfect tool for your project needs now!

Updated on March 30, 2023
When it comes to accomplishing your tasks with precision within a given deadline (regardless of the scope and complexity of your project), nothing helps better than a Gantt chart.
What is a Gantt chart and why is it important?
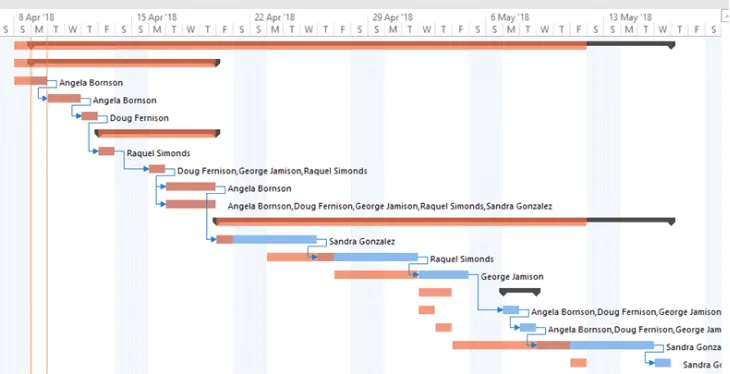
Created by Henry Gantt in the early 1900s, the Gantt chart is a type of visual that illustrates a project schedule and gives an overall view of what needs to be done. Providing a macro perspective of all the aspects of a project, a Gantt chart helps you plan, manage and execute all the important underlying activities.
What is a Gantt chart?
- A horizontal bar chart illustrating a timeline of a project;
- A visual representation of scheduled tasks that helps you to plan, coordinate and track specific activities in a project. As these tasks get completed, the team can get an overview of what work needs to get done, who’s doing it and when.
What should a Gantt chart include?
- Tasks and milestones – different types of work which should be done to reach the goal;
- Start and end date for each task;
- Task dependencies – the connection between different deliverables;
- Task duration and status – showing progress and completion percentage;
- Assigned resources.
Why use a Gantt chart?
Not limited to project management only, a Gantt chart proves useful in any situation where there’s a coordinated effort of any kind, as it outlines the starting point, progress, and intended destination.
Purposes of a Gantt chart
- In any working area that requires project management and scheduling tasks & resources, it’s used for visualizing a project plan (what work will happen, when and in what order);
- To organize complex projects and guide teams throughout the process, showing them each step in advance and giving a common direction;
- To coordinate multiple team members that work on different parts of a project at the same time and give them perspective of what’s going on;
- To estimate timelines and workloads so resources are allocated, and due dates scheduled accordingly;
- To set deadlines more accurately and take better decisions if something unexpected comes up and interferes with the initial schedule.
Benefits of a Gantt chart
- Visually representing the breakdown of tasks in a project, it makes scheduling, planning and execution easier – integral part of project management and planning;
- It gives a better understanding of how tasks are connected and thus ensures an optimal workflow;
- Provides an easy way to communicate the project schedule to the entire team, keeping everyone on the same page;
- It monitors progress and helps managers redistribute tasks to keep a balanced workload;
- Laying out the overall timeline of the project, it gives perspective and a more understandable method to maintain deliverables.
Originally written by hand, Gantt charts were expected to be as accurate as possible since every change would have required for the graphic to be redrawn from scratch. This limited their usefulness in an ever-changing area that project management is. Consequently, more and more Gantt chart apps have been developed to help PM professionals easily update their project schedules whenever requirements change.
What are the best Gantt chart creators for you?
There are plenty of Gantt chart apps on the market that are worth exploring. Ready to find the right fit for your needs? Here’s our top 10 Gantt chart maker list that we’ve put together so you can make an informed decision:
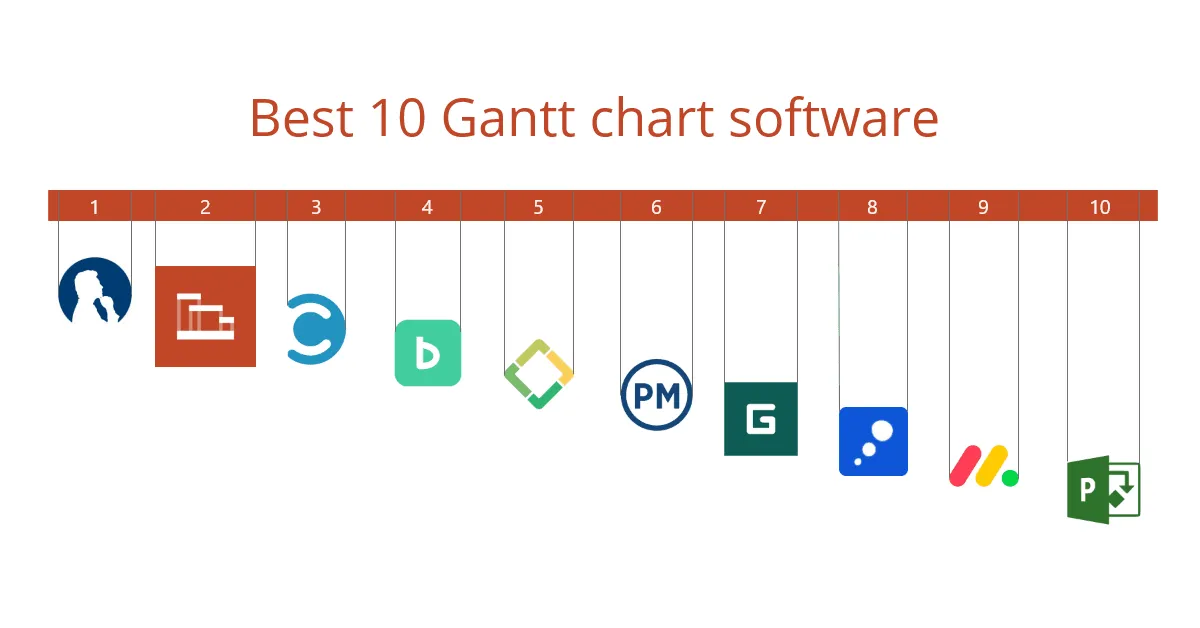
Top 10 Gantt chart software shortlist
How to choose the best Gantt chart generator
Below you will find an elaborate review of each of these Gantt chart tools which have been ranked based on the following criteria:
a. User Interface (UI): Does it offer intuitive navigation and well-designed displays?
b. Usability: Is the tool easy to learn? Does the company offer good technical support and training materials?
c. Integrations: Does the software offer any pre-built integrations or connect with other tools?
d. Value for money: Is the price appropriate for its capabilities?
e. Features and functionalities: how many of the essential time management chart functions does it offer? Among the key features you should look for:
- Collaboration & Sharing: ability to assign tasks to team members, set roles and share & export to popular formats like .png, .xls, and PDF.
- Drag & Drop: easily arrange tasks and adjust their size (extend or shorten), as well as add attributes by simply clicking and dragging.
- Notifications & Alerts: receive notifications about upcoming tasks, edits and mentions, along with at-risk items so you can effectively reprioritize activities accordingly.
- Auto-scheduling: also known as dependency tracking, this functionality allows the automatic adjustment and recalculation of all downstream activities based on their dependencies when previous tasks undergo changes.
Your ultimate Gantt chart software list
1. MindView
A dynamic Gantt chart maker that is available as a desktop tool for both Mac and Windows OS, as well as a cloud-based app; it includes modules for project timelines, project reporting and work breakdown structures.
- Allows the gradual and easy creation of Gantt charts in a few steps: in the mind map view, you add schedule information that will be automatically turned into an overall sketch of your project plan; to refine and customize the plan, you switch to the built-in Gantt view where you can allocate resources and manage scope changes;
- Its capabilities range from simple features such as dependencies and baselines to advanced management functions like project calendars, effort drive tasks and resources/rates, as well as project reporting, all of which can enhance collaboration for portfolio management;
- Adopting the latest Microsoft Office interface and providing built-in video tutorials, the software is familiar and easy to learn and use;
- Imports and exports to the entire MS Office Suite (Excel, MS Project, PowerPoint, Word, Outlook); other formats you can export your Gantt charts to include PDF, HTML, XML and picture;
- A MindView license for a single user starts at $379, but users benefit from a fully functional 30-day free trial and free webinars to get started.
UI: 10/10
Usability: 10/10
Integrations: 10/10
Value for money: 10/10
Features & Capabilities: 10/10
Overall Score: 10/10
2. Office Timeline
With a web-based version (Office Timeline Online) and a desktop add-in (Office Timeline; compatible with Windows OS), it is the only project management tool that helps you build native PowerPoint Gantt chart and timeline slides.
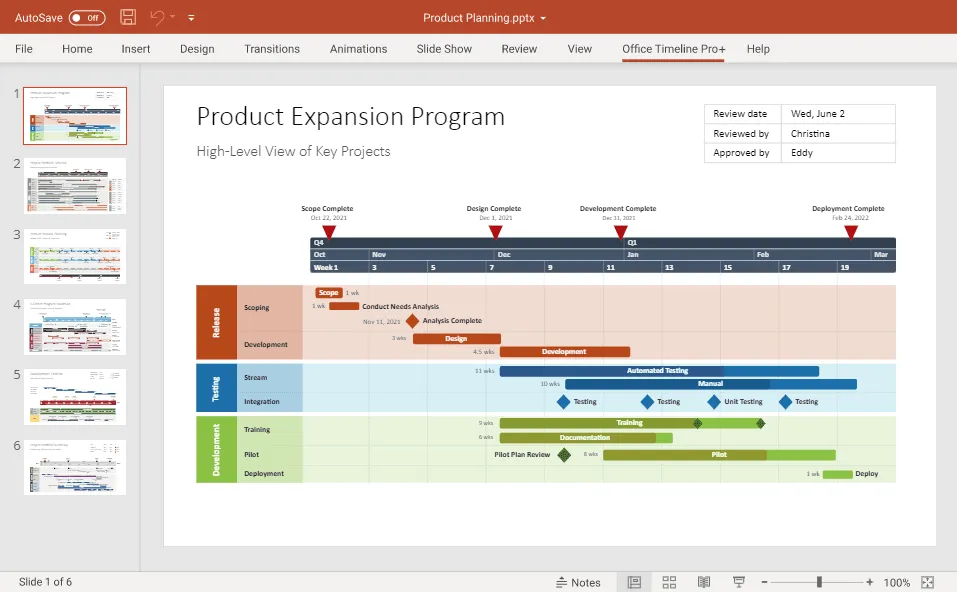
- Seamlessly built-in into PowerPoint, the on-premise add-in is familiar and simple to use, helping you to make presentation-ready Gantt charts, project timelines and roadmaps right inside the popular slide-maker platform; with the online Gantt chart maker, you get the simplicity of the web to quickly create and share your Gantt charts as PowerPoint slides from anywhere;
- Its intuitive drag & drop interface and smart layout engine help you automatically turn complex project data into simple visuals that can be updated and styled on the fly; a rich gallery of pre-designed templates to choose from and the ability to import files get you set up faster;
- Easy data management and customization through a diverse range of task and milestone functionalities (shapes, colors, date formats, duration, status indicators, percentage complete, grouping in swimlanes and sub-swimlanes) and multiple timescales to visualize long-term projects;
- Integrates with MS Project, Excel, Jira, Wrike and Smartsheet, and lets you export your visuals as PowerPoint slides (.pptx format), image (.png format) or .xls files (Excel format);
- The web tool features a Share & Collaboration function which enables multiple people to edit the same visual;
- Provides a continuous state of development with regular product updates and addition of new features;
- Both versions offer a fully-functional freemium model limited to 10 rows of data; the online version paid plan costs $149/year, while the PowerPoint add-in comes in several editions that range from $108 to $249/year for the most advanced edition (14-day free trial available).
UI: 10/10
Usability: 10/10
Integrations: 10/10
Value for money: 9/10
Features & Capabilities: 9/10
Overall Score: 9.6/10
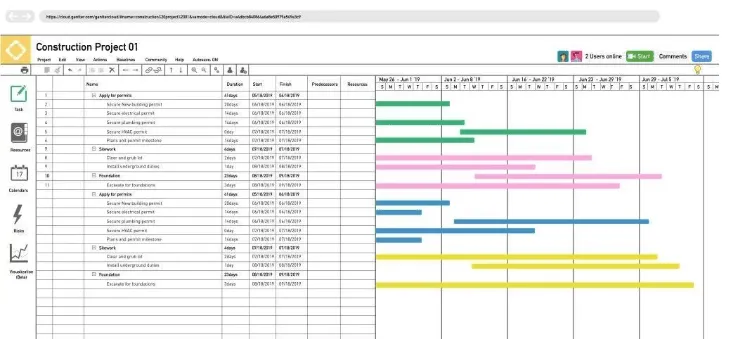
3. Celoxis
Used by global brands like Adobe, The World Bank, HBO and Tesla, it is an enterprise-class web-based project management tool that is suitable for managing dynamic projects with clear Gantt charts.
- Packs a variety of functionalities ranging from dashboards, project requests and financials to resource management, collaboration, workflow and reporting functions;
- Its interactive interface mimics the Microsoft Project model, enabling seamless sync and adoption of the latter’s overall organizational framework;
- Supports features such as drag & drop, inter-project dependencies, multiple tasks and subtasks which can be customized by colors, critical path and baselining, assigning multiple resources per task, as well as manual and automatic scheduling;
- Allows export to PDF, HTML and .png formats;
- Direct integration with MS Project, Excel, Salesforce, Google Drive, QuickBooks, Outlook and Zapier to ensure extensive interoperability with many other different apps;
- Users can enjoy a ‘preview’ of the software with its 30-day free trial; the cloud full version costs $25/user/month, whereas the on-premise version comes at $450/user but it is billed only once.
UI: 10/10
Usability: 9/10
Integrations: 9/10
Value for money: 9/10
Features & Capabilities: 10/10
Overall Score: 9.4/10
4. Backlog
A web-based project management tool specialized for developers and the teams they work with.
- Provides a variety of collaboration features such as milestone and task management (with subtasks, custom fields and checklists), Gantt and burn down charts, wikis and file management; collaboration on the-go is possible via their mobile app on both iOS and Android;
- Also includes a bug tracker and version control system;
- Allows collaboration on code through SVN and Git repositories, a differences viewer, pull and merge requests, as well as inline comments;
- Enables quick project assessment through Git, Gantt and burn down charts;
- Ensures transparency and accountability across teams with functions that let you assign, track and release work;
- It integrates with Nulab’s apps and provides import functions from Redmine and Jira;
- Suitable for a range of team sizes, Backlog comes in 4 flavors (Free plan – for up to 10 users but with feature limitations; Starter – $35/month for up to 30 users; Standard – $100/month for unlimited users on 100 projects and 30 GB of storage; Premium – $175/month – for unlimited users and projects and 100 GB of storage).
UI: 10/10
Usability: 10/10
Integrations: 8/10
Value for money: 9/10
Features & Capabilities: 8/10
Overall Score: 9/10
5. Gantter
A rich Gantt chart-based online PM tool available in the Google Chrome web store; designed to ensure a smooth Google Drive Editor-like experience for project management, it combines the functionalities you get in MS Project with the advantages of the cloud.
- Suitable for project scheduling and planning, risk management, data visualization and baselining, the tool comes with a menu in 23 languages;
- Some of its most attractive and useful features include task tracking and hierarchical linking; cost/workload tracking, risk tracking and management, along with automatic work breakdown structure;
- Multi-party editing in real time and Google Hangout integration allow advanced collaboration across teams;
- It comes with an innovative AI Recommendation Engine that automatically suggests tasks, resources and risks for your project, based on data taken from other projects similar to yours; users can also benefit from community-contributed project templates that they can use and share;
- Provides built-in analytics and reporting that yields real-time analysis on costs, risks and resources;
- Integrating with Google, Gantter allows single sign-on, storing files on Google Drive, and bi-directional task synching between its schedules and your Google calendar; it also lets you view and save Microsoft Project (.mpp) files and integrates with Smartapp.com for planning infrastructure projects;
- With a 30-day trial available, Gantter charges $5/month per user, which is a very good price for such a fully-featured product.
UI: 9/10
Usability: 9/10
Integrations: 7.5/10
Value for money: 10/10
Features & Capabilities: 9/10
Overall Score: 8.9/10
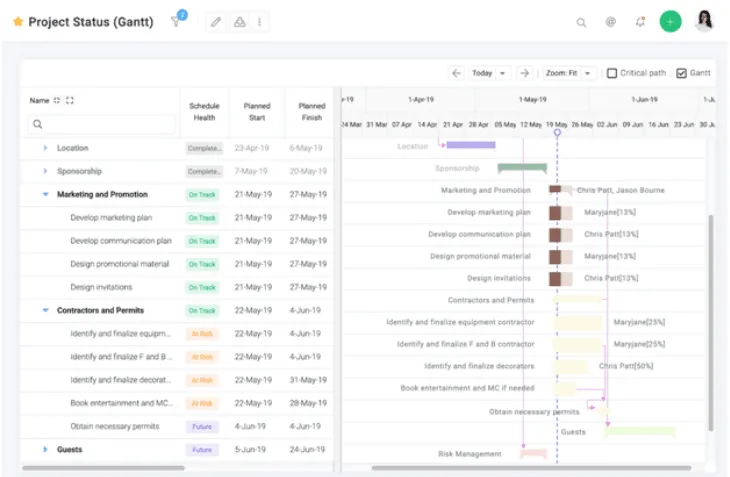
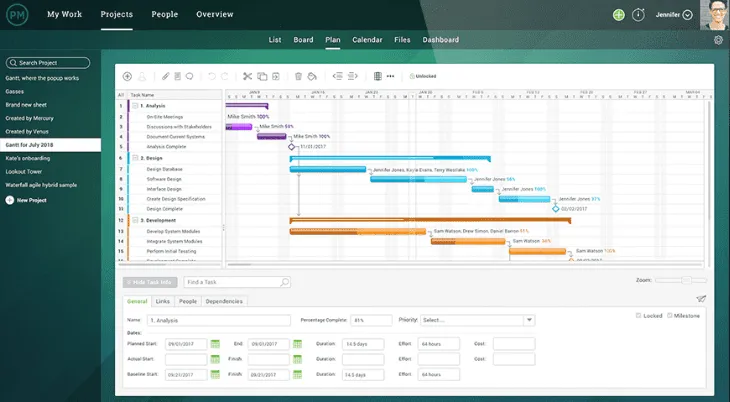
6. ProjectManager.com
An award-winning software used by big names such as NASA and Volvo, ProjectManager.com offers cloud-based interactive solutions to plan, schedule and update in real time.
- Comes with a varied series of Gantt chart features ranging from creation, task assignment and progress tracking to reporting, timesheet, expenses and workload management;
- Collaboration is enabled through in-app communication features (e.g. comments on tasks);
- Flexible interface that lets you easily switch between views – from Gantt chart to task list or Kanban board view;
- Its real-time dashboard gives an overview of current project status and allows you to create and customize reports across multiple projects from their pre-set templates or from scratch;
- It natively integrates with GoogleApps (Drive, Gmail, Calendar), Microsoft Project and Microsoft Office and through Zapier with other tools.
- Offers a 30-day free trial (although a credit card is still required to sign up); and the pricing for the paid version starts at $15/user/month (with a minimum of 5 users required for their basic Personal plan).
UI: 9/10
Usability: 9/10
Integrations: 9/10
Value for money: 7.5/10
Features & Capabilities: 8.8/10
Overall Score: 10/10
7. GanttPRO
An interactive cloud-based Gantt chart software that is a household name for PMs in companies like Salesforce, HubSpot, and Sony.
- With a wide range of Gantt chart-specific features such as chart building, task management (with subtasks and milestones) and integrated dependencies, progress tracking, ready-made Gantt chart templates categorized by industries and collaboration functions (tagging, assigning and cloud storage for multi-party access), GanttPRO is quite well-suited for related needs;
- On the other hand, it is quite bare in its integration offerings, integrating only with Microsoft Project and Microsoft Excel, which is a major disadvantage;
- Supporting team training sessions, project role settings for members and real-time notifications, it is a great pick for team work;
- Allows customizable export to PNG, PDF and XL format;
- Offers a 14-day free trial and the full license costs from $15/user/month, but onboarding 5+ users will land you a discount on the monthly subscription price.
UI: 10/10
Usability: 10/10
Integrations: 6/10
Value for money: 8.5/10
Features & Capabilities: 9.5/10
Overall Score: 8.7/10
8. MindGenius
Available as on-premise software for both Mac and Windows OS, as well as an online app, MindGenius provides diverse visual mapping tools that give you several ways to structure your project data depending on your needs/preferences.
- Boasts a solid range of Gantt chart-related functions such as the ability to assign resources, dependencies and durations to your Gantt chart, review progress and revise your schedule in a flexible way; there is a Snapshot feature to graphically highlight exactly when and where the execution differs from the project plan;
- Its simplicity and intuitiveness makes it a good choice for small or tech-adverse teams;
- Features a gallery of ready-made templates and guides you can use to get started more easily;
- Integrates with Outlook, MS Project, One Drive, Dropbox, Google Drive, MS Visio and MS Office;
- Users of the mobile application will encounter limitations when trying to export their Gantt charts, and the software in general is designed to handle small to medium-sized projects rather than overly complex ones (it doesn’t provide any budgeting or expense-related features);
- They offer a 14-day free trial and the paid version starts from $16/month.
UI: 9/10
Usability: 10/10
Integrations: 8.5/10
Value for money: 9/10
Features & Capabilities: 7/10
Overall Score: 8.7/10
9. Monday.com
An online work management platform with calendars, timelines, Gantt charts, Kanban boards and other project management tools to enable efficient project planning and resource tracking.
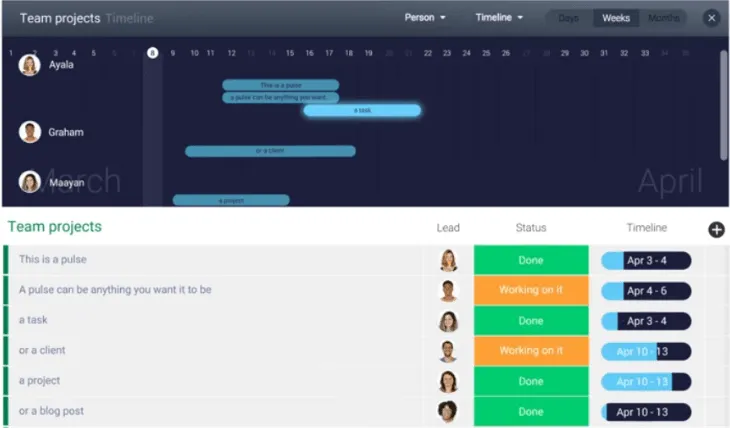
- Lets you see overviews of your project timeline, upcoming deadlines and progress of different tasks;
- Its intuitive and appealing UX coupled with its user-friendly design makes it a great choice for people who are new to digital project planning tools or tech-phobic;
- Integrates with Dropbox, Excel, Google Calendar, Slack, Trello;
- Could use minor improvements in terms of scheduling recurring tasks (currently you need an outside integration to do so), as well as having a general chat board with the ability to assign comments to specific team members;
- Has a free 2-week trial and 4 paid plans: Basic, Standard, Pro and Enterprise; the price for the paid version starts at $17/month for two users and goes up to $2,399.
UI: 9/10
Usability: 10/10
Integrations: 6/10
Value for money: 10/10
Features & Capabilities: 8/10
Overall Score: 8.6/10
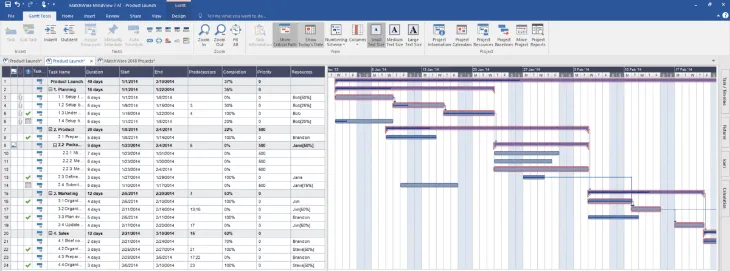
10. Microsoft Project Online
Delivered through Office 365, it uses familiar interface and ensures an intuitive way of visualizing various aspects of your projects.
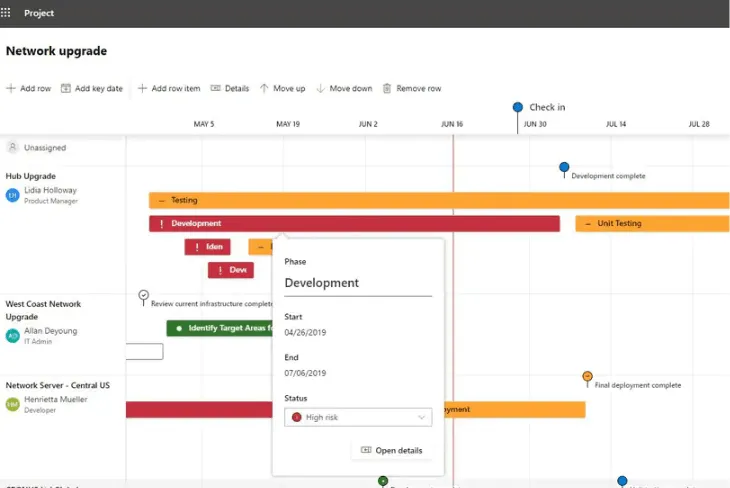
- Offering plenty of pre-designed Gantt chart templates and familiar scheduling functionalities like selecting items for phase indicators, setting start and end dates and adding RAG risk status for easy prioritization, the tool makes it easy to launch and navigate assignments;
- Integrates with the entire MS Office suite, OneNote, Skype and OneDrive, but the fact that it doesn’t expand into non-MS services is the reason for the lower score in our integrations evaluation criteria;
- Changing schedule dates is not very seamless and the project file cannot be accessed by multiple users at the same time, which makes the tool more geared towards large-scale projects rather than smaller workflows;
- A 30-day free trial is available; and the paid suite of features starts at $7/user/month.
UI: 8/10
Usability: 8/10
Integrations: 5/10
Value for money: 8/10
Features & Capabilities: 9/10
Overall Score: 7.6/10
Conclusion
Picking the ideal Gantt chart maker for you primarily relies on how any given software meets your requirements. We hope that the options outlined in this article will help you narrow down your choices more easily.
The Best Gantt Chart Creator Overview
| Software | Free Option | Price | Score |
| 1. MindView | Free 30-day trial | $240/year | 10 |
| 2. Office Timeline | Freemium model available Free 14-day trial | $149/year (for online version) $249/year (for the top edition) | 9.6 |
| 3. Celoxis | Free 30-day trial | $270/user/year | 9.4 |
| 4. Backlog | Free for up to 10 users | From $350/year for 30 users | 9 |
| 5. Gantter | Free 30-day trial | From $50/user/year | 8.9 |
| 6. ProjectManager | Free 30-day trial | From $180/user/year | 8.8 |
| 7. GanttPRO | Free 14-day trial | From $106.80/user/year | 8.7 |
| 8. MindGenius | Free 14-day trial | From $160/user/year | 8.7 |
| 9. Monday.com | Free 14-day trial | From $288/year | 8.6 |
| 10. MS Project Online | Free 30-day trial | From $84/user/year | 7.6 |
Project management tips and tricks
Turn project data into professional timelines
Get the advanced features of Office Timeline free for 14 days.
