Gantt chart 101: Everything you should know about Gantt charts
Explore our complete guide about Gantt charts to get all information you need and answers to your questions.

There comes a day in the life of a project management professional or anyone doing project work when you come across the widely known and used Gantt chart. That’s the moment when you need to figure out not only what it is but also the best way to create and use one for your project.
Now it’s your turn to gain a better understanding of this powerful project management tool that helps you effortlessly map out activities and deadlines for complex projects, keep an eye on progress in real time, and update clients and executives in the most visually engaging way possible.
Like any other learning journey, you’ll need a comprehensive guide that will help you level up and leverage the Gantt chart’s powers to successfully deliver projects on time. But above all, you deserve a guide that will ensure you have an enjoyable time while you’re figuring out what this chart is all about.
We’re excited to present to you our Gantt chart 101 series, the much-anticipated guide containing the answers to your Gantt chart-related questions, including:
- What is a Gantt chart and what is it used for?
- How do I read a Gantt chart?
- What key elements do I need to include in a Gantt chart?
- When should I use a Gantt chart and when it’s best not to?
- What differentiates Gantt charts from other charts?
- How can I create a free Gantt chart online?
In this article, we’ll give you a quick overview of the whole series and what you can expect from each of its five in-depth sections. Let’s jump straight into it.
1. What Gantt charts are used for
Once upon a time, when the internet wasn’t a thing yet, an American engineer called Henry Gantt adapted Karol Adamiecki’s bar chart and created a visual tool that enabled manufacturing managers to get a clear overview of their work schedule and current progress.
As you’ve already guessed, that tool is none other than the Gantt chart or rather its hand-drawn version. Nowadays, thanks to advanced Gantt chart software, anyone can digitally create their own Gantt chart and visualize the project’s timeline with its tasks and their start and end dates, crucial milestones and deadlines, and current progress status.
Turning complex data into intuitive project visuals that are easy-to-follow for team members and key stakeholders is Gantt chart’s top superpower. There are multiple use cases when a Gantt chart saves the day:
- communicate the project schedule and status updates
- create a software development roadmap
- build a content calendar for your marketing strategy
- visualize a construction schedule
- plan and organize an event
2. How to read a Gantt chart
Learning how to read a Gantt chart properly can take time and requires you to first get familiar with its key elements, especially if you’ve just started using this type of diagram. To cut the learning curve in half, we recommend you check out our step-by-step guide to reading any Gantt chart with ease.
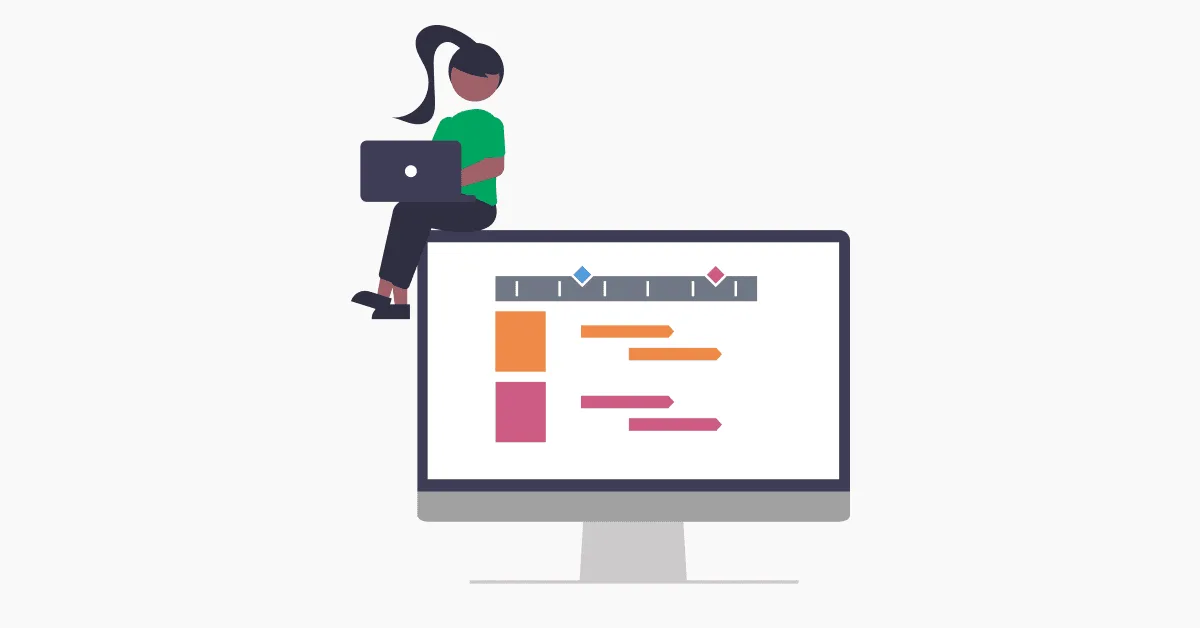
In a nutshell, here’s what the most important Gantt chart elements represent:
- timeband – shows you the duration of your project in days, weeks, months, or years, highlighting important events such as incoming deadlines and milestones
- task list – is a list of all the tasks that need to be completed before you deliver the project
- task bars – each project task is illustrated using colorful bars whose length varies depending on their duration
- milestones – these are crucial events that make it easier for you to keep track of project progress from one phase to another
3. What to include in a Gantt chart
Crowding too many details into your Gantt chart will make it difficult to read, while leaving out relevant information can be a serious threat to project completion. That’s why it’s essential to understand what elements you can’t miss from your diagram.
Using one of our ready-made Gantt chart templates, we’ve zoomed in on what elements you need to include in a Gantt chart to get a complete and uncomplicated overview of your project schedule.
Here’s a quick Gantt chart checklist for you to use when creating your diagrams:
- Build a timeband that accurately represents the duration of your project
- Divide the tasks specific to each project phase into swimlanes
- Illustrate each task with a color-coded bar and set its start and end dates
- Add important milestones to your charts using distinct symbols
- Display task progress either through bar shading or by adding percentage complete
4. When to use a Gantt chart (and when not to)
Gantt charts are excellent visual tools that can take the stress out of scheduling and tracking projects and boost team communication — if used in the right situation.
More exactly, you should definitely use a Gantt chart when you have to hold a presentation in front of key stakeholders, when you are asked to create a report for your next executive meeting, and whenever you have the opportunity to pitch your company’s services to a new client.
However, there are also scenarios where you should avoid using a Gantt chart: when the project is still in the discovery stage, when you need to manage your project in detail (leave that to the project management software) or if you want to get a better view of your project budget and scope.
5. What makes the Gantt chart different from other project management charts
As much as we love Gantt charts, we’re aware that their distinct way of visually organizing project data won’t work in every situation. When that happens, there are a few Gantt chart alternatives you can use:
- PERT chart: this chart is best used in the planning stage as it provides you with a high-level overview of the project’s schedule. The PERT chart uses a network diagram with numbered circles/boxes or nodes for milestones and arrows for task dependencies and concurrent tasks.
- Critical path method (CPM) chart: as the name suggests, the CPM chart helps you illustrate task dependencies and uncover the critical path. This diagram is a great tool for making time estimations and figuring out which tasks need to be prioritized within a project.
- Network diagram: this is a greatly simplified scheme of your project’s workflow, involving nodes linked together with arrows. You can use a network diagram to plan and organize tasks in the initial stages of a project.
6. How to make a Gantt chart online for free
Ready to put your Gantt chart knowledge into practice?
A simple yet powerful Gantt chart maker like the Office Timeline drag & drop online app lets you skip the hassle of having to navigate the intimidating menus of complex tools and make your own Gantt chart in just three steps. The only thing you need is a free account that lets you share your creations and collaborate in real time with team members and stakeholders.
More of a PowerPoint kind of person? No problem. You can now test the advanced features of the Office Timeline add-in and customize any of our pre-designed professional Gantt chart templates by simply installing the free trial version on your device.
Project management tips and tricks
Tagged With:
Gantt chart 101Turn project data into professional timelines
Get the advanced features of Office Timeline free for 14 days.
