Gantt chart 101 – Part 2: How to read a Gantt chart
Learn how to quickly read the project information illustrated on a Gantt chart. Get started with Gantt charts with our free pre-designed templates.

We believe most project managers will agree when we say there’s no simpler way to get a visual overview of your project schedule than using a Gantt chart.
You can see everything at a glance—the project timeline, the list of tasks with their start and end dates, descriptions and task owners, important milestones, and real-time progress. Plus, every stakeholder involved gets a clear picture of what needs to be done, who is responsible for each task, and if the project is on the right track.
In other words, Gantts charts are the best project management tools you can use to make sure nothing slips through the cracks and effortlessly communicate project information and updates.
But when you’re new to Gantt charts, you might need some time and guidance to get familiar with all its elements and figure out how to interpret them.
That’s why we’re here to give you the essential information you need to read any Gantt chart with confidence and even learn how to make Gantt charts using PowerPoint and other office tools.
What are the main elements of a Gantt chart and what do they mean?
First, it’s best if you think of the Gantt chart as the story of your project. Together, the following elements help you tell that story in an easy-to-follow format:
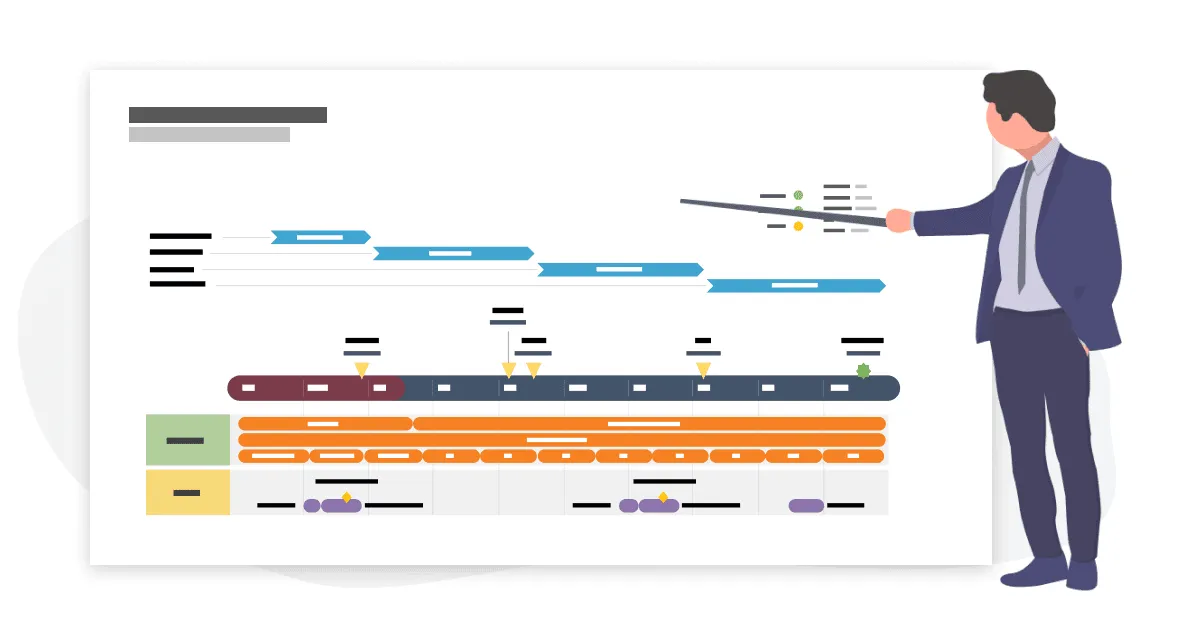
Timeband
The timeband illustrates the duration of your project from start to finish and usually includes important milestones and dates. The timescale can show years, months, weeks, and days, depending on the project’s time span.
Task list
Every project is broken into smaller units, allowing project managers to delegate tasks and responsibilities to the right people.The task list is found on the chart’s vertical axis and includes the description of each project task. Generally, the task descriptions are short and specific so that everyone involved in the project can easily understand what work needs to be done.
Project tasks
On a Gantt chart, tasks are represented as colorful horizontal bars and are displayed in the order they need to be performed. Each individual task has different durations represented by the bar’s length and different start and end dates. To illustrate the progress made for a project activity, task bars usually include percent complete.
Milestones
These represent crucial events within your project, such as kick-off meetings, deadlines, reviews, and deliverables. Milestones act like checkpoints helping you split the project into manageable stages, track progress, and make sure everything is on schedule. You can use different symbols to illustrate milestones, from the classic diamond symbol to flags, stars, arrows, and even simple squares.

The step-by-step guide to reading a Gantt chart
As we mentioned above, each Gantt chart presents a project’s story. In this section, we’ll show you exactly how you should read the chart so that the story makes sense for you and the rest of the team.
Let’s say you’ve just started working on a new project and all activities were planned and scheduled using a Gantt chart. We’re going to use the Gantt chart template above as our example.
Here are the main steps you need to follow to properly read a Gantt chart:
- First, look at the project tasks presented in the Gantt chart and pay attention to how they are separated into stages using deadlines. In our example, we have a task list on the left side of the chart and a series of deadlines represented on the timeband using different symbols to highlight each type of event.
- Check the project timeband to see if there are any milestones coming soon and then look at the work that needs to be completed by that date. Based on our example, there’s a kick-off meeting happening right at the beginning of the project, followed by the approval of the course plan.
- Take a look at the start and end dates and the duration of the tasks that need to be performed in each project stage. This way, you get to know what task should have already started, how long each activity should take, and if there are any tasks that overlap.
- Last but not least, keep track of progress by regularly updating the chart. This step ensures that what you’re reading on the chart is accurate. To increase the visibility of progress for tasks, you can edit the chart to show the completion percentage for each activity or use specific colors to show if a task is completed, in progress, or delayed. Check out our other resources on how to update your project plan when dealing with changes.
Ready to create your own Gantt chart?
New things are always intimidating at first. The same goes for creating and reading Gantt charts.
However, if you want to half the learning curve and save time, you can do so by using a Gantt chart software. Office Timeline offers both an online tool and a PowerPoint add-in so that professionals can create visually appealing Gantt charts, roadmaps, and timelines directly in PowerPoint in the shortest time possible.
Check out our Gantt chart template gallery and more Gantt chart examples you can use to plan your projects and turn complex information into easy-to-understand project visuals. To start customizing these templates, including the one mentioned in the previous section, you simply have to go and go and install the Office Timeline free 14-day trial version. Before you go, don’t forget to check out Part 1 of our Gantt chart 101 blog series for more information on what is a Gantt chart and why it’s important.
Project management tips and tricks
Tagged With:
Gantt chart 101Turn project data into professional timelines
Get the advanced features of Office Timeline free for 14 days.
