Gantt chart 101 – Part 3: What to include in a Gantt chart
Learn what elements you need to include in a Gantt chart to efficiently plan, schedule, and manage projects and communicate updates to stakeholders like a pro.

Henry Gantt’s invention, the Gantt chart, together with the rapid technological advancement of the 21st century, brought about a much-needed revolution in the world of project management.
So it’s no wonder that now it’s hard to imagine project management in a world without Gantt charts, where we don’t have this powerful visual tool to help us plan and schedule project tasks, assign resources and track progress.
Plus, few project managers can resist the allure of modern feature-rich Gantt chart software, especially when it offers a wide range of customization options, seamless import of data, user-friendly drag & drop updates, and ready-made Gantt chart templates that clients and executives can easily understand.
However, to leverage Gantt’s chart powers to the fullest, project managers need to know what to include in their charts so that each stakeholder gets a comprehensive view of the workload of a project and how tasks are progressing. And that’s where we come in to help you create impressive project visuals that communicate the right information in the best format.
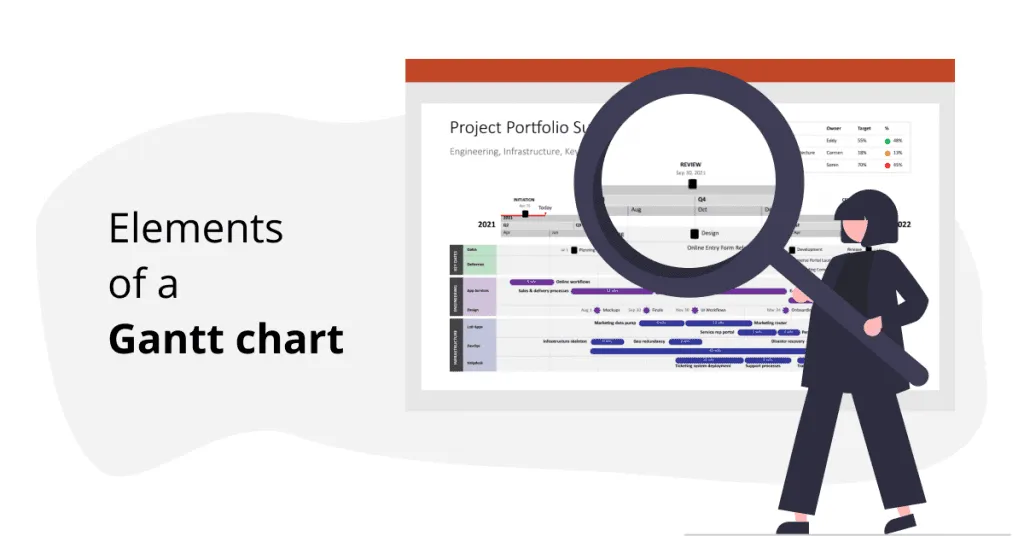
In this third segment of our Gantt chart 101 introductory series, we’ll show you what essential elements shouldn’t miss from your Gantt charts using one of our pre-designed templates as an example.
6 important features every Gantt chart should have
Everyone from project managers to team members, execs, and clients can use a Gantt chart to see at a glance the project schedule with all the tasks that need to be completed along with their start and end dates, who is responsible, the resources used, their current status and important milestones.
But that is possible only if the relevant information is properly illustrated in the chart using the right elements. After all, no one wants to read a chart that’s overly complex or cluttered with unnecessary details.
That being said, let’s take a closer look at the Gantt chart template below:

We chose this specific template because most companies have multiple programs and projects running in parallel at all times, thus requiring swimlanes and sub-swimlanes to show an overall perspective of their project portfolio.
Simply put, a project portfolio summary allows you to prioritize access to resources for those projects that help you achieve your strategic goals.
Based on this project portfolio template, here are the must-have features of a Gantt chart and what they represent:
1. Timeband
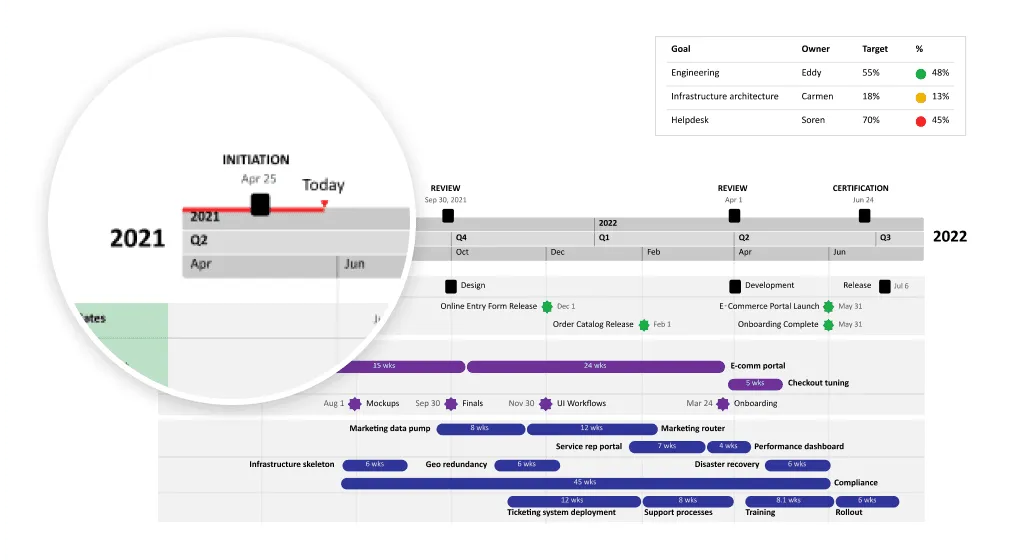
The timeband is displayed on the horizontal axis of your Gantt chart and represents your projects’ timeframe from day one until the final delivery deadline.
You can choose to use more than one timescale, which enables you to simultaneously schedule tasks across weeks, months, quarters, or years and keep track of both long-term and short-term projects in one place. Also, you can add a ‘Today’ marker to display the current date or highlight the elapsed time directly on the Gantt chart’s timeband.
2. Swimlanes and sub-swimlanes
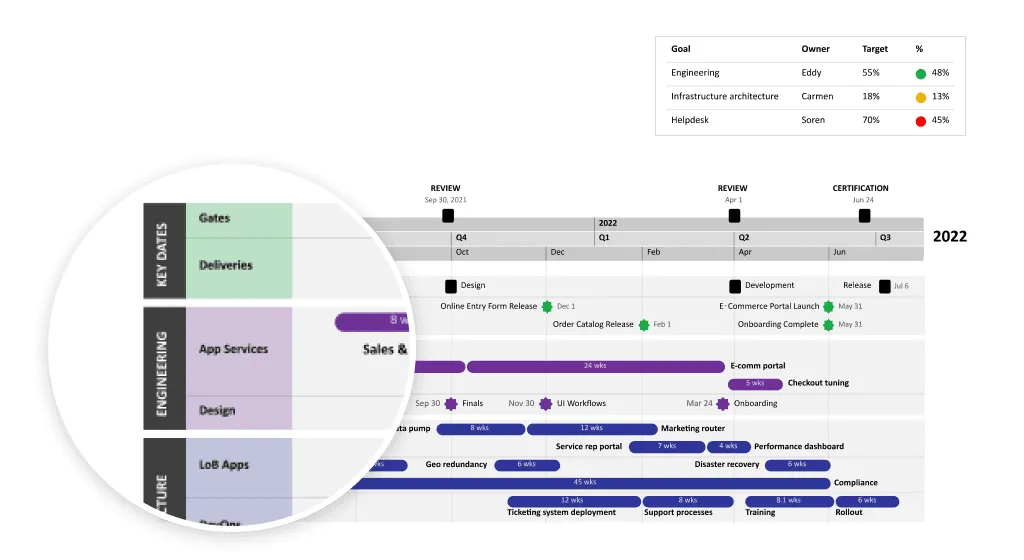
These horizontal rows help you divide tasks and milestones on the chart using color coding and consistent visual elements. Swimlanes enhance the structure of your Gantt chart and eliminate overlapping, making it easier to read and comprehend. That’s why each lane needs to have a relevant headline to clearly define the program or project illustrated.
Sub-swimlanes are used to display programs with multiple projects or multi-phased projects inside a swimlane. These sub-sections allow you to visually organize your project portfolio to effortlessly show team members, executives, and other stakeholders the status of your programs and progress made across individual projects.
3. Task bars
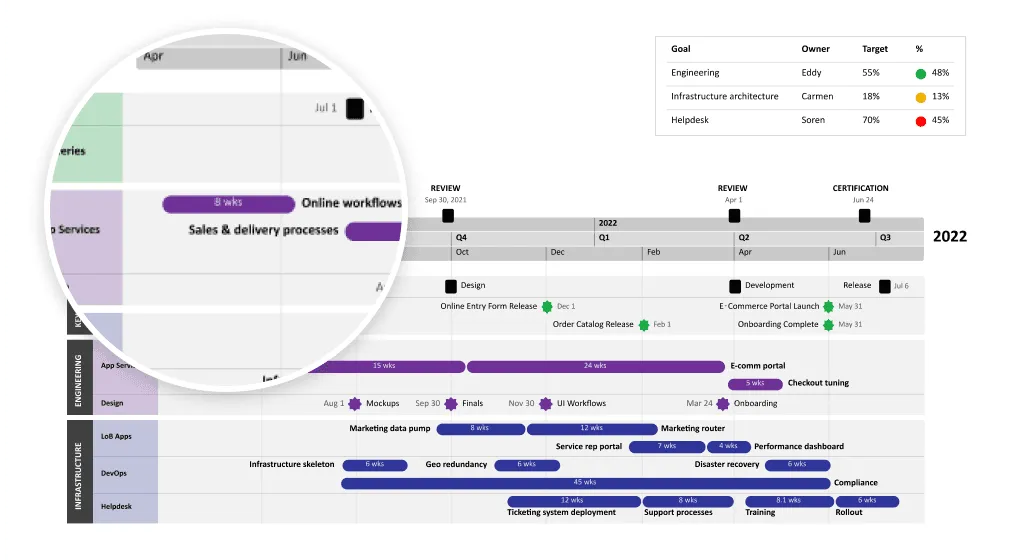
Task bars are a crucial element of your Gantt chart, representing the tasks scheduled for each stage of a project or program. Each task bar has a different length showing its duration, which can also be added to the bar itself, and different start and end dates.
To group interrelated tasks within a swimlane, you can simply color-code them. We recommend you remain consistent when choosing the shape of the task bars to keep a clean layout.
4. Milestones
These represent important dates within your projects or programs, such as reviews, deadlines, releases, and deliverables. Milestones allow you to check if the project is on the right track and spot road blockers that might cause delays.
You can display milestones within a separate swimlane like the Key Dates lane in the chart above, inside a sub-swimlane, or directly on the timeband. There are various symbols you can choose from when adding these events to your Gantt chart, starting from classic stars and diamonds to flags, arrows, and squares.
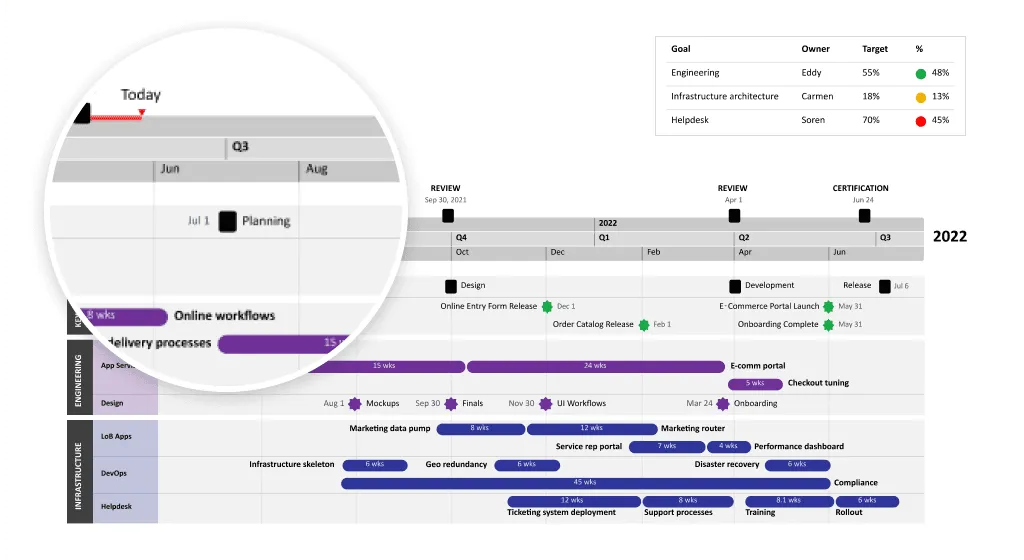
5. Progress
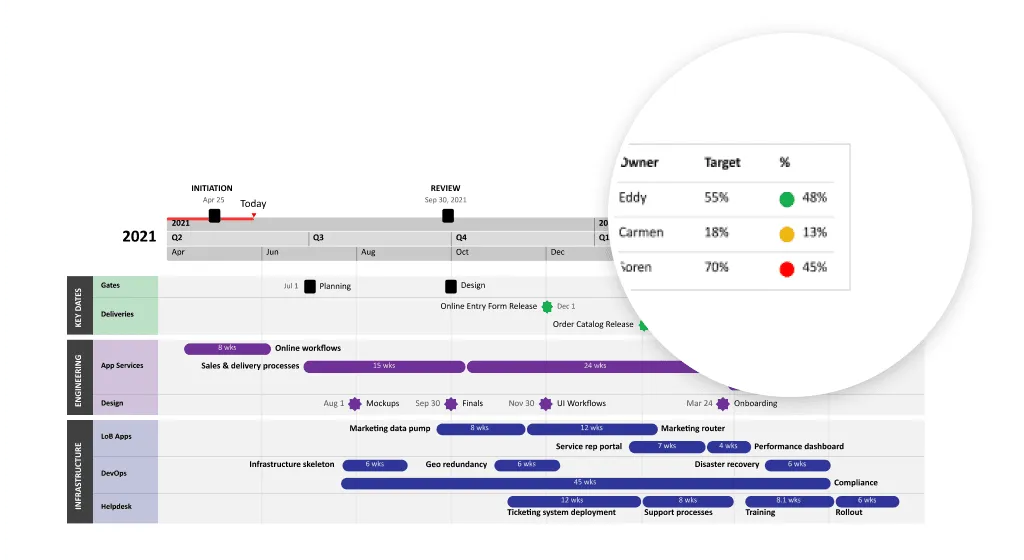
Progress shows how much of the project workload is already completed. You can display task progress on your chart by adding percent complete, either as a bar shading or as actual numbers next to your task.
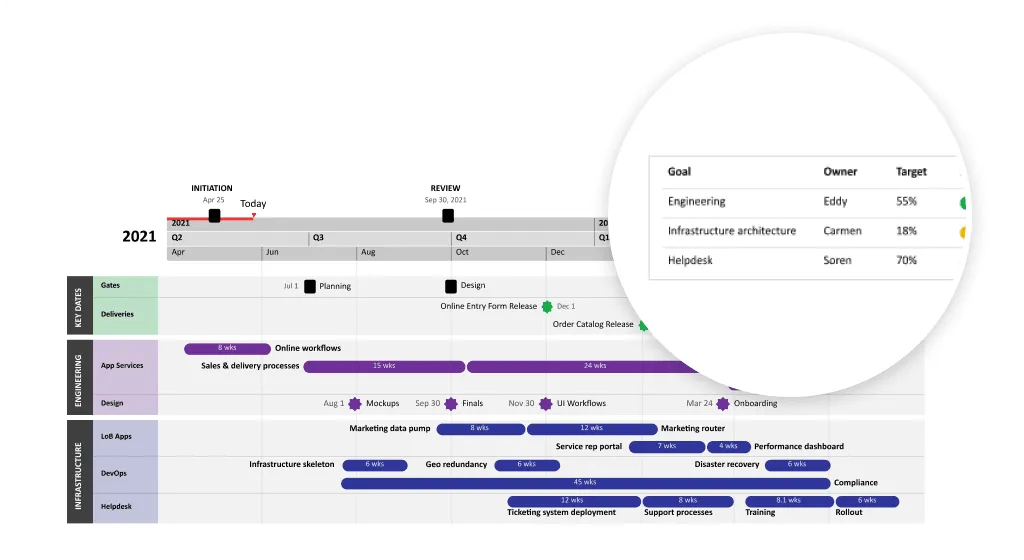
However, we also suggest creating a separate table when it comes to showing the overall progress for the different programs within your project portfolio. This way, you can add the completion percentage for each project/goal and use standard traffic lights colors such as red, amber, and green to highlight if work is progressing as planned or if there’s been a delay.
6. Resources
Each task and project has a person or team assigned, ensuring the work is done on time and within budget. Adding the resources on your Gantt chart improves team collaboration, making it easier to know who to talk to for regular status updates or in case of a review meeting.
To prevent your chart from getting cluttered, we recommend displaying who’s responsible for an activity/ group of activities somewhere above or below the diagram.
Creating a stunning Gantt chart is simple
With the right tool, that is.
Office Timeline helps you to beautifully organize your programs, projects, and tasks in one PowerPoint slide and turn complex information into easy-to-follow Gantt charts in just a few minutes.
Don’t forget to explore our gallery for more Gantt chart examples you can easily use to plan and schedule project workloads. If you want to customize any of these templates, including the one mentioned in this article, simply go and install the Office Timeline free trial version on your computer.
Project management tips and tricks
Tagged With:
Gantt chart 101Turn project data into professional timelines
Get the advanced features of Office Timeline free for 14 days.
