Create and share Gantt charts for free—right from your browser
Easily create, collaborate, and update Gantt charts online. Keep your project visuals clear and current with the web’s most intuitive Gantt chart maker.
![[object Object]](https://img.officetimeline.com/uploads/assets/presentation_be98f7c98d.svg)
![[object Object]](https://img.officetimeline.com/uploads/assets/web_2108527fce.svg)

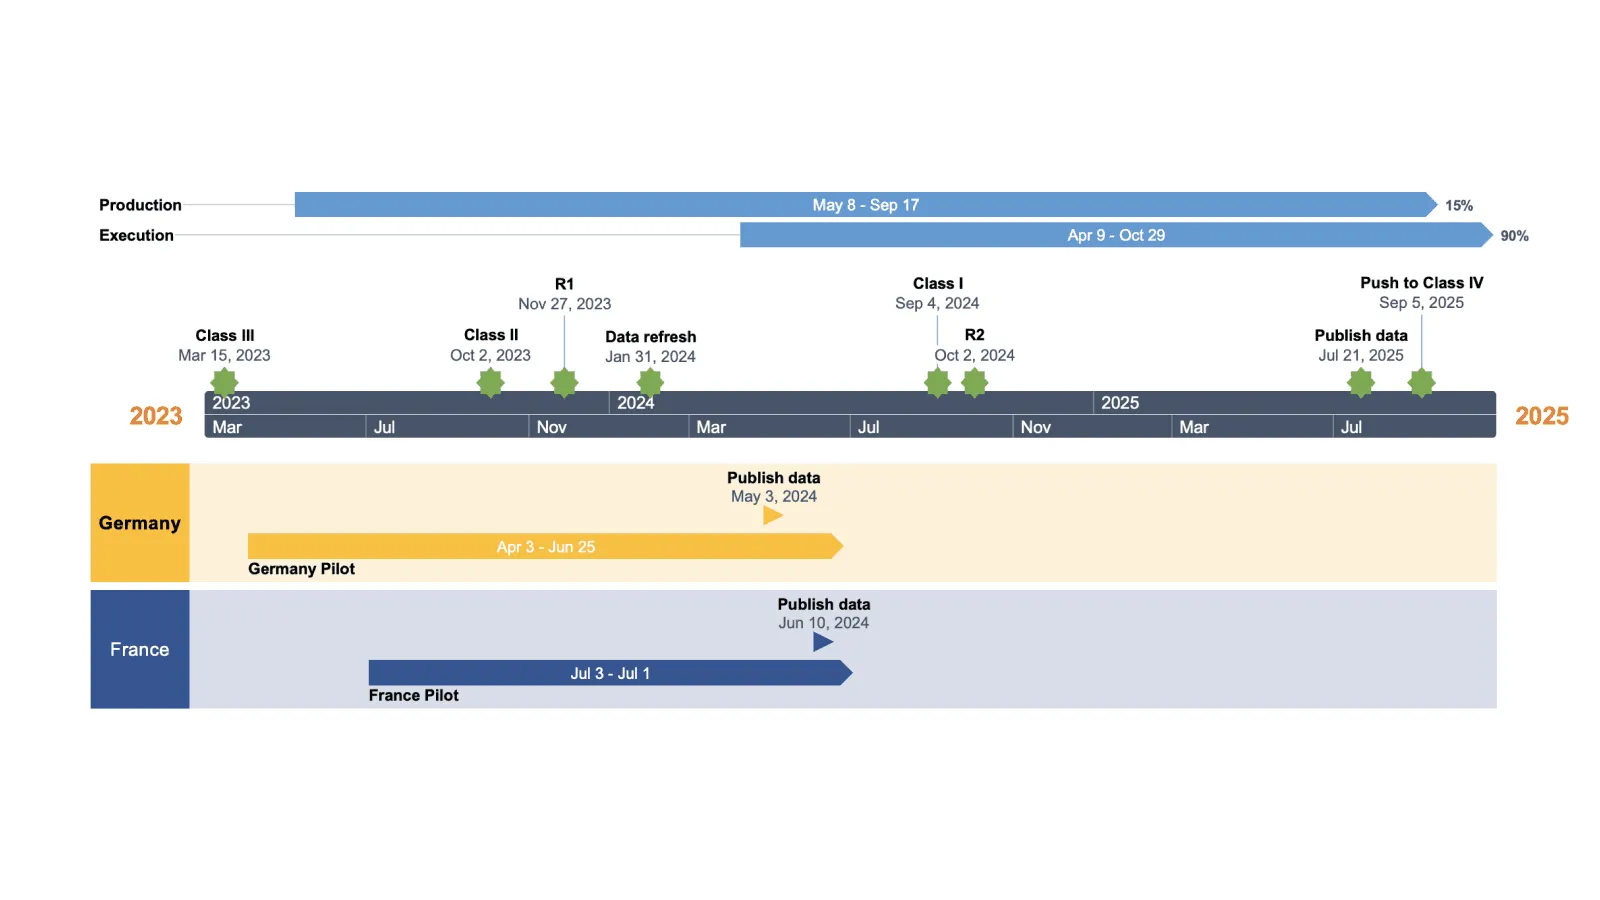
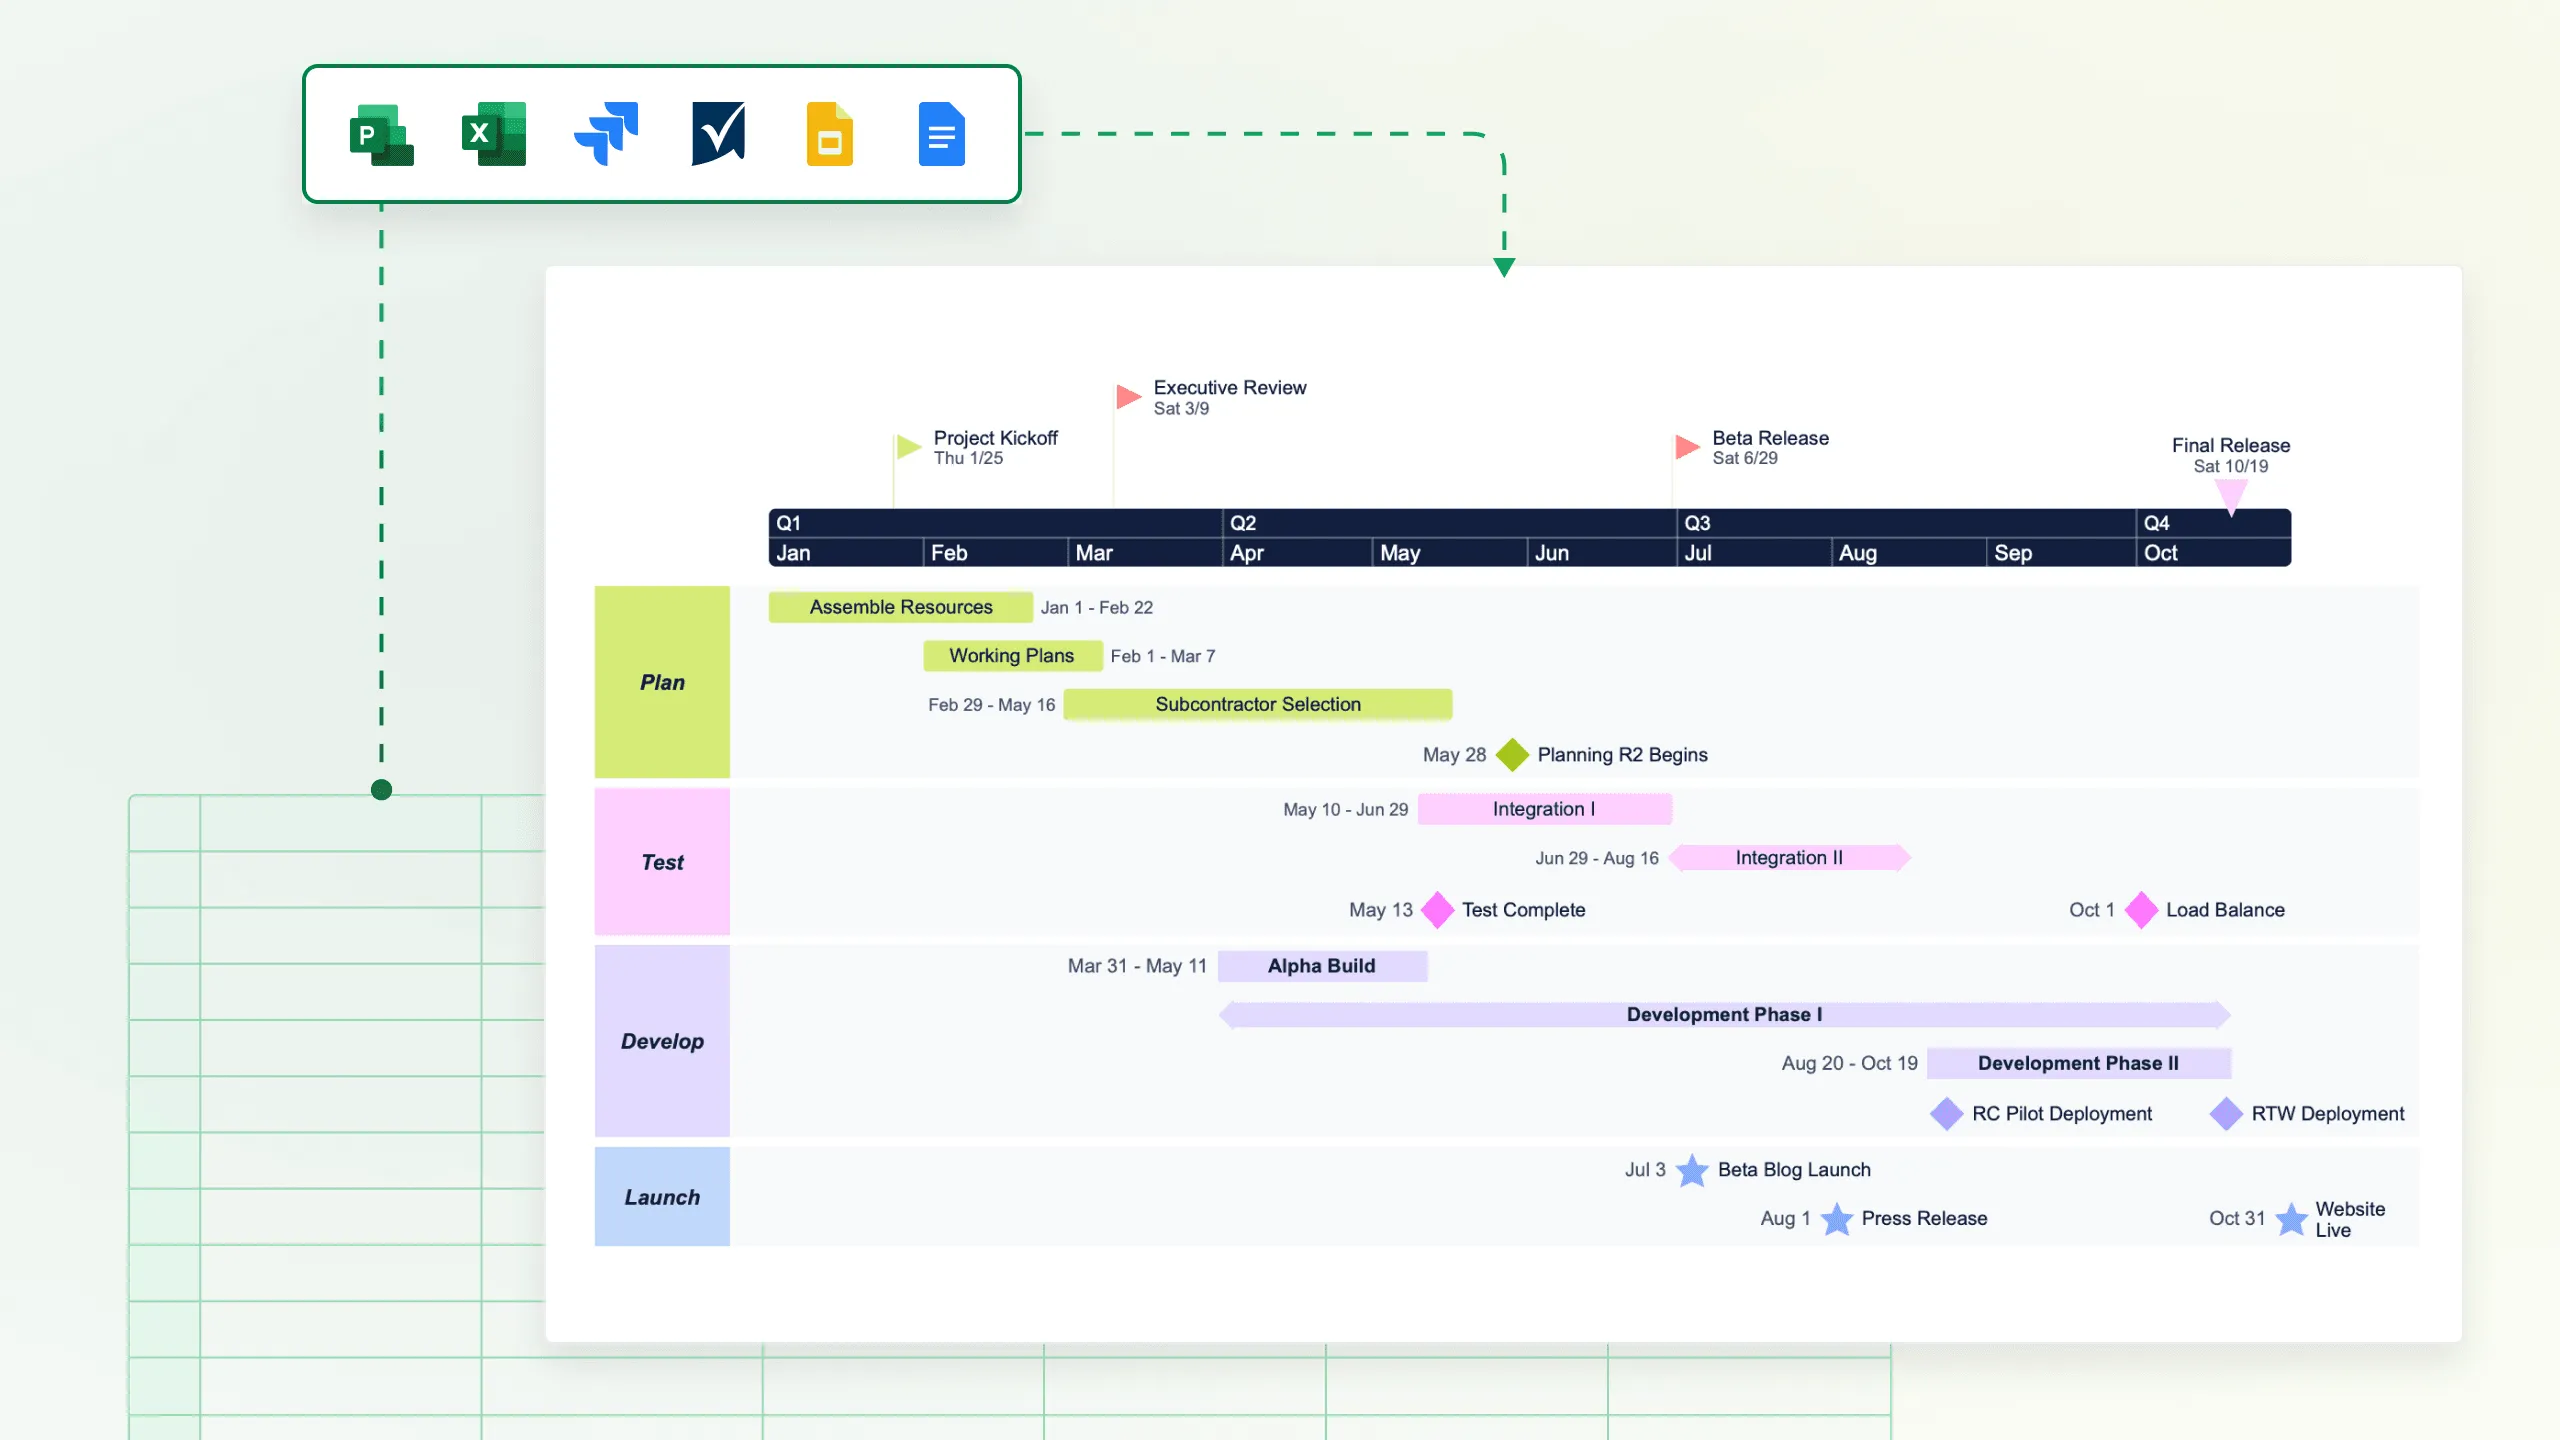
Made withOffice Timeline Online

Made withOffice Timeline Online

Made withOffice Timeline Online

Made withOffice Timeline Online
Quick. Simple. Visual.
- Office Timeline Online has simplified our project management immensely. I manage a team of service designers who are not usually experts in project management, but the highly visual interface and ease of use has made managing our projects a breeze. We cannot imagine using any other project Timeline tool that is as easy and beautiful.
 Yvonne TranSenior Design Strategist, Booz Allen Hamilton
 - Office Timeline Online provides me with a really quick way to create and maintain PowerPoint timelines from the web. I use it to make executive timelines for presentations to our VPs. The bright colors and distinctive shapes make it easy for them to quickly understand what’s at stake, and my slides always stand out.
 Éric Hervé, PMPProject Manager, Major Canadian Media Company
Easy online Gantt chart generator for your project visuals.
Engage your stakeholders with clear, simple Gantt charts and timelines. Office Timeline Online is a free, accessible Gantt chart and timeline maker that helps you communicate visually.
Build online Gantt charts and roadmaps that are easy to understand for everyone – clients, teams, and managers.
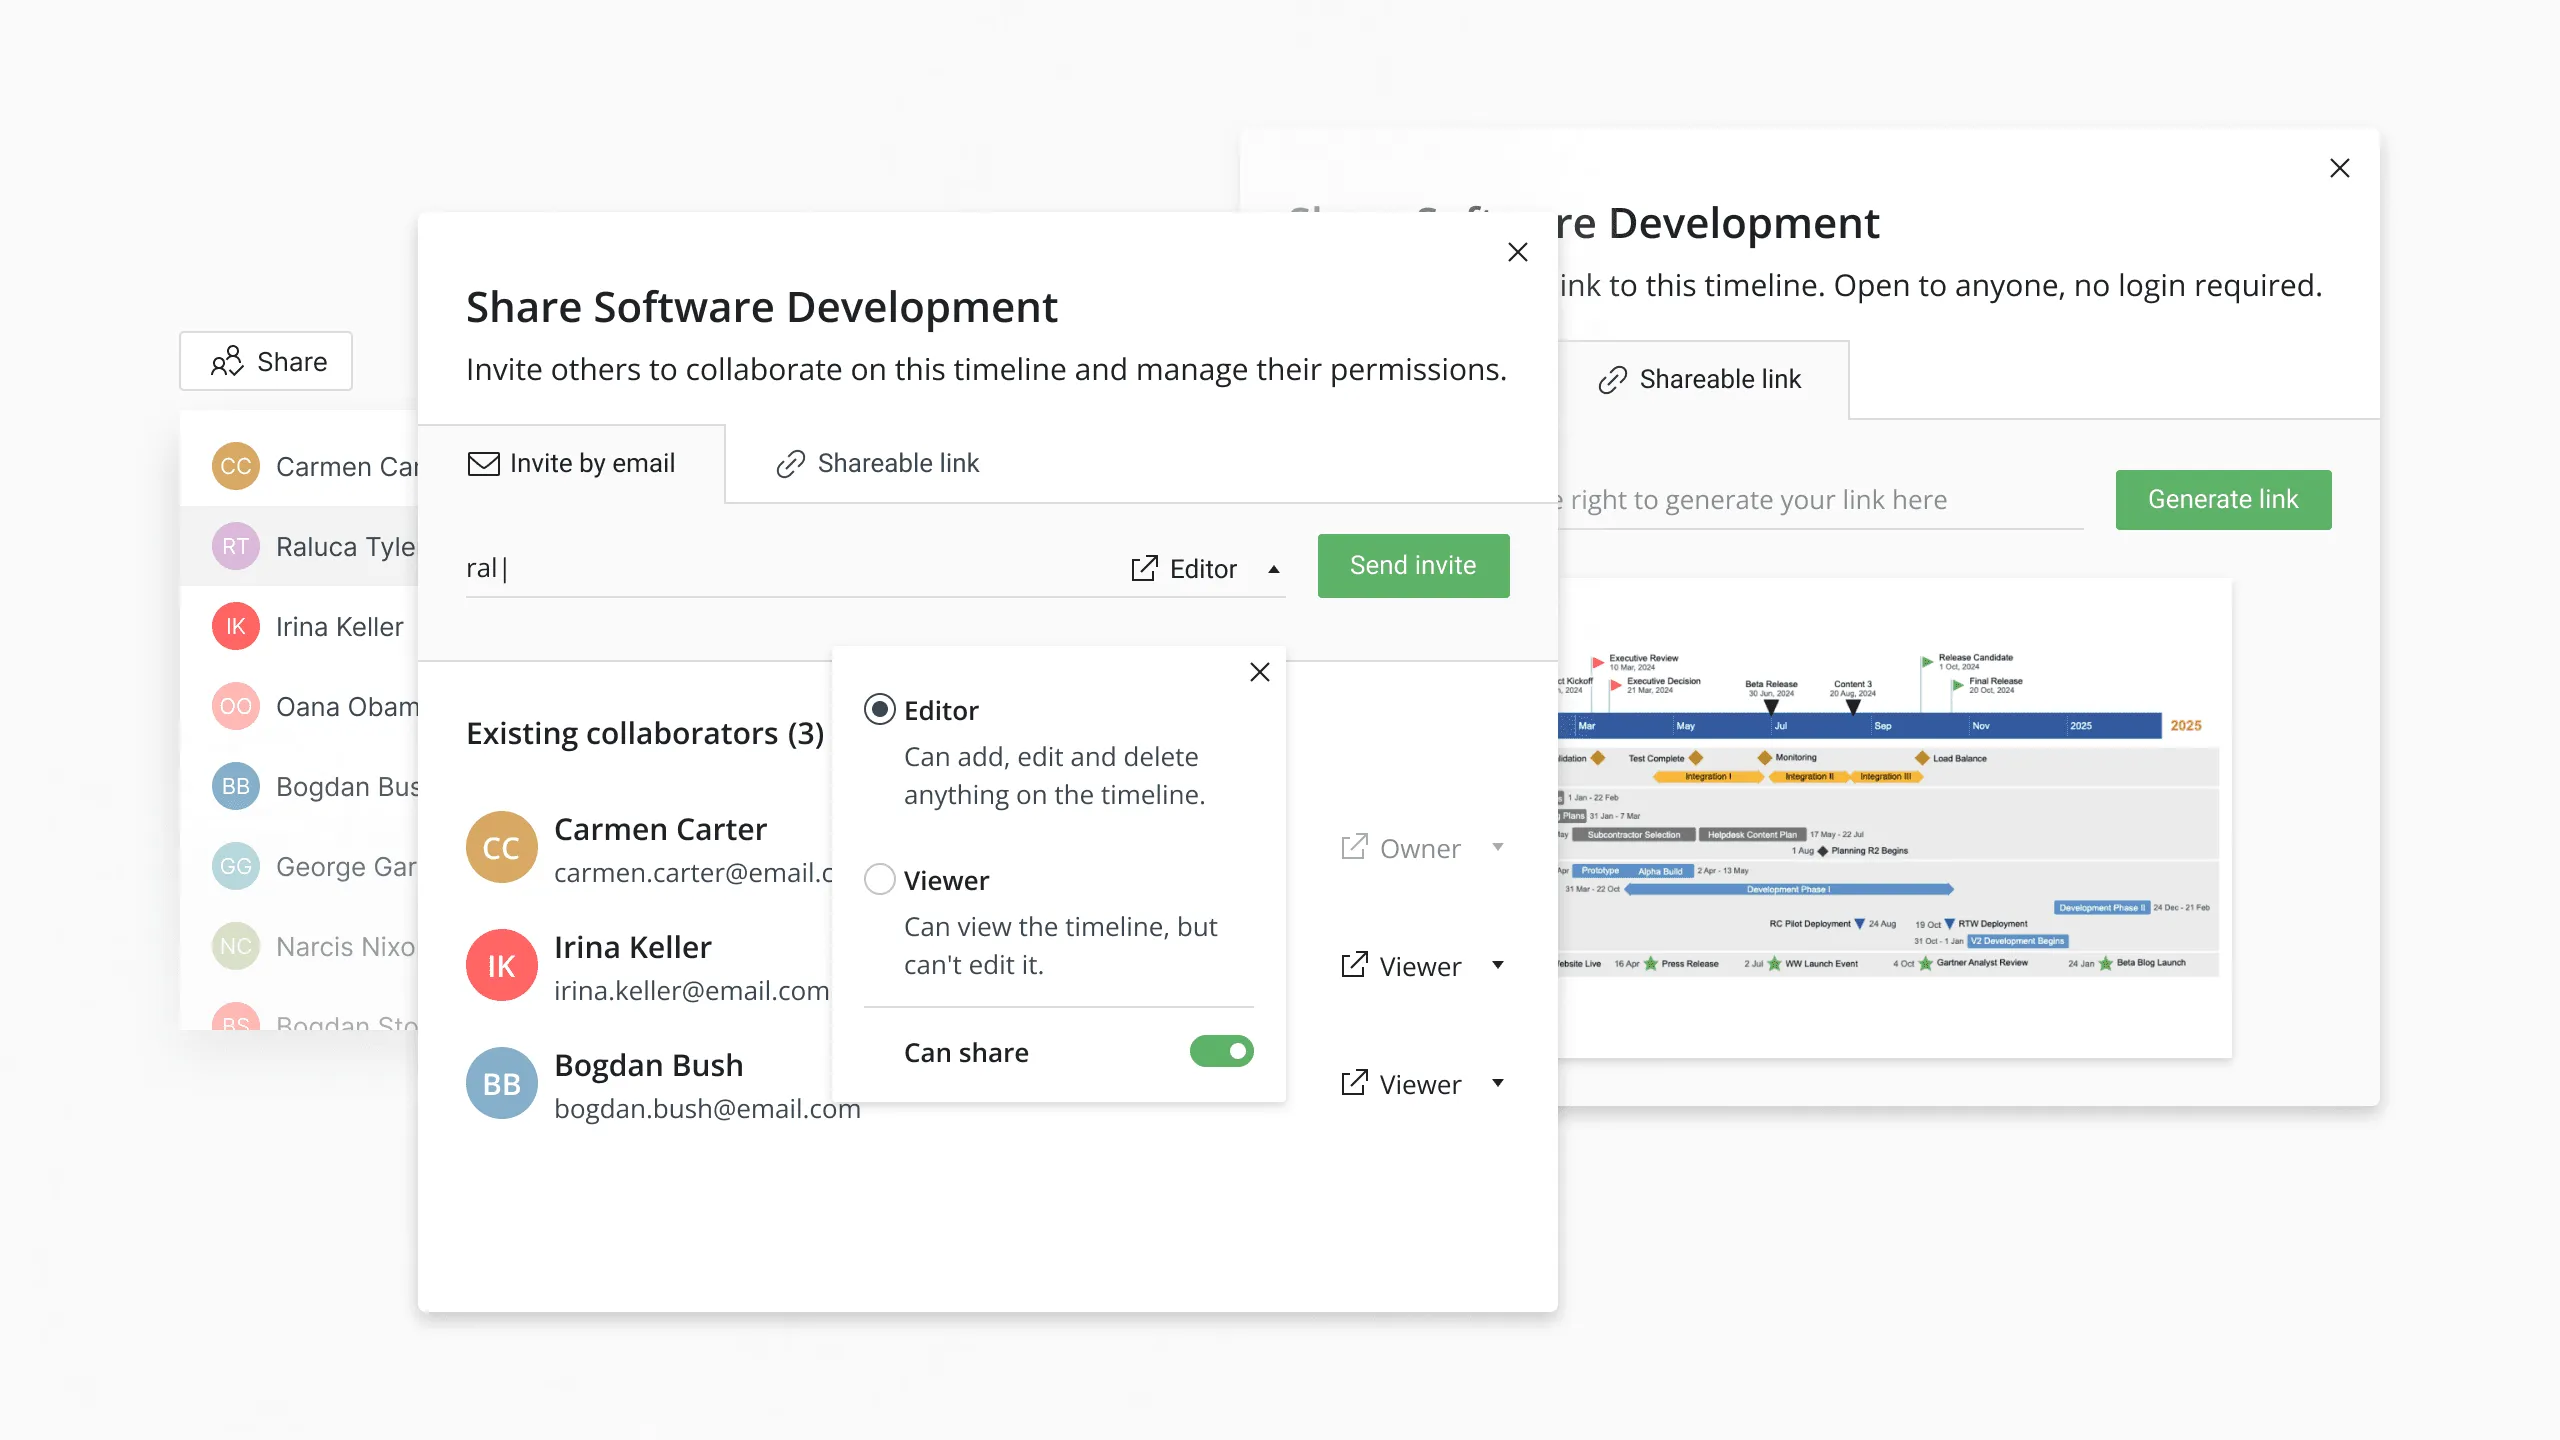
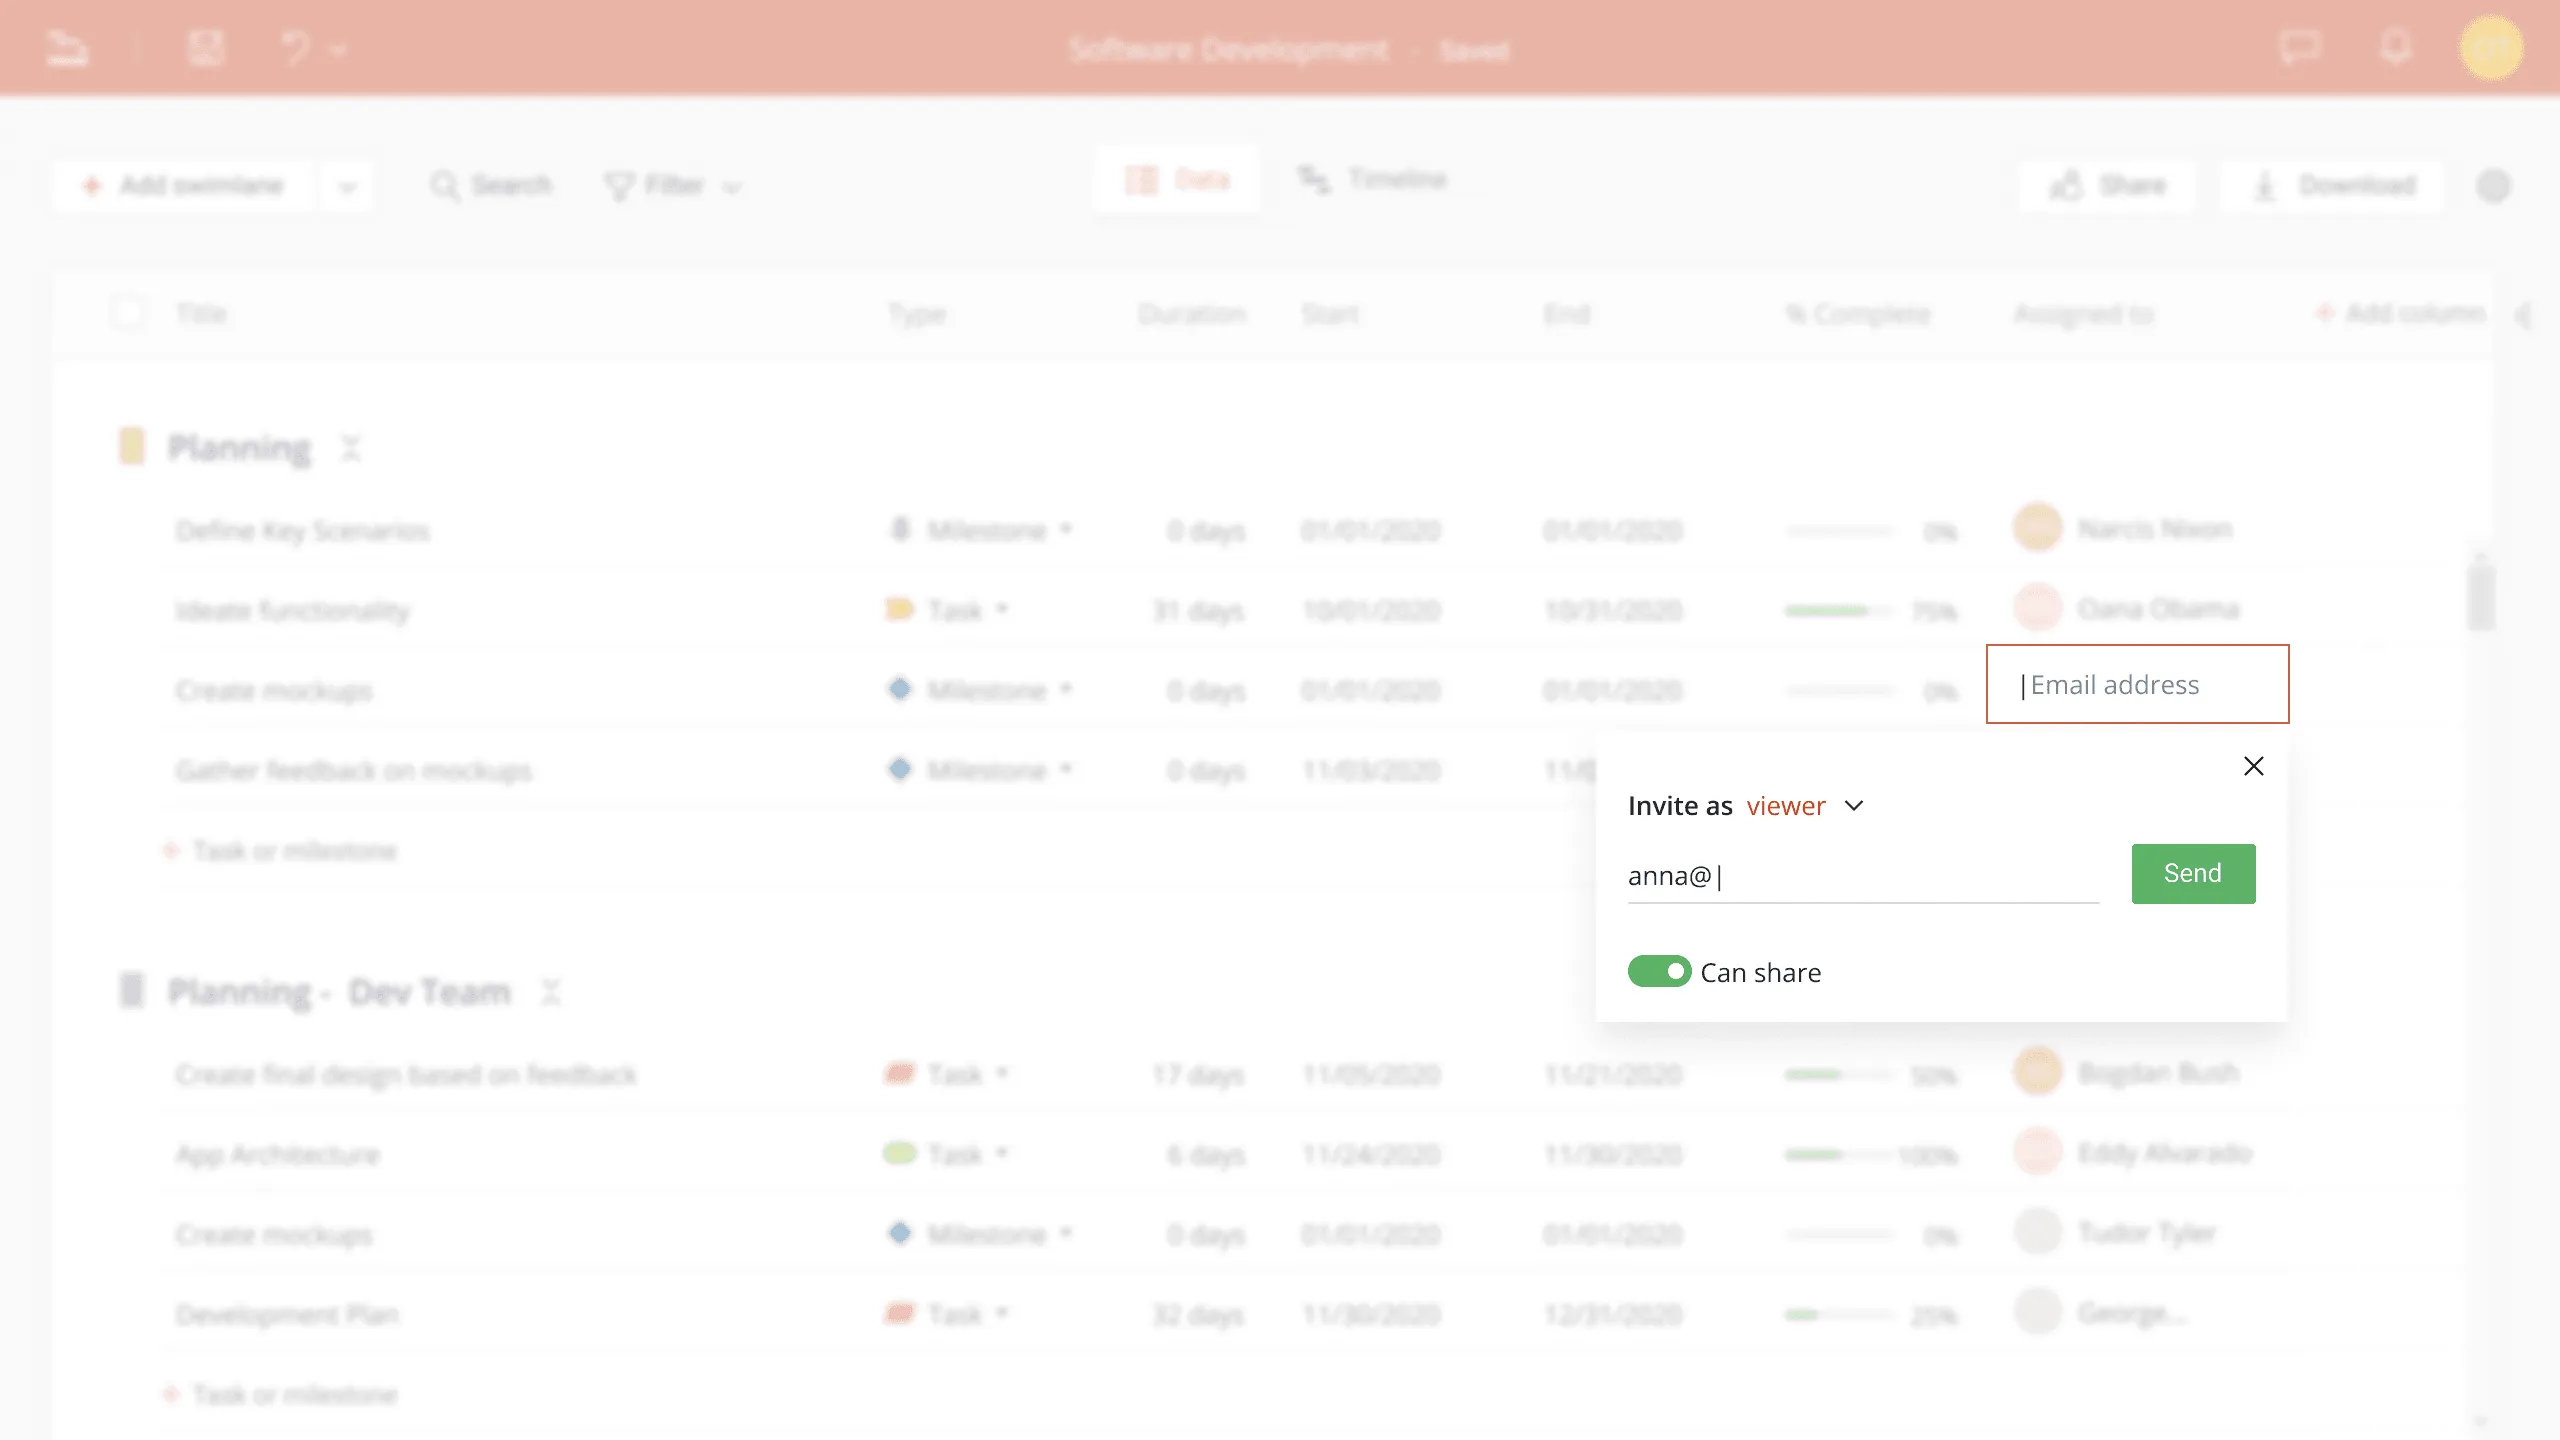
Share and collaborate on the web effortlessly.
Our online Gantt chart maker makes teamwork simple and secure. Share a view-only link or invite others to edit in real time — keeping everyone aligned and eliminating the need for back-and-forth updates.
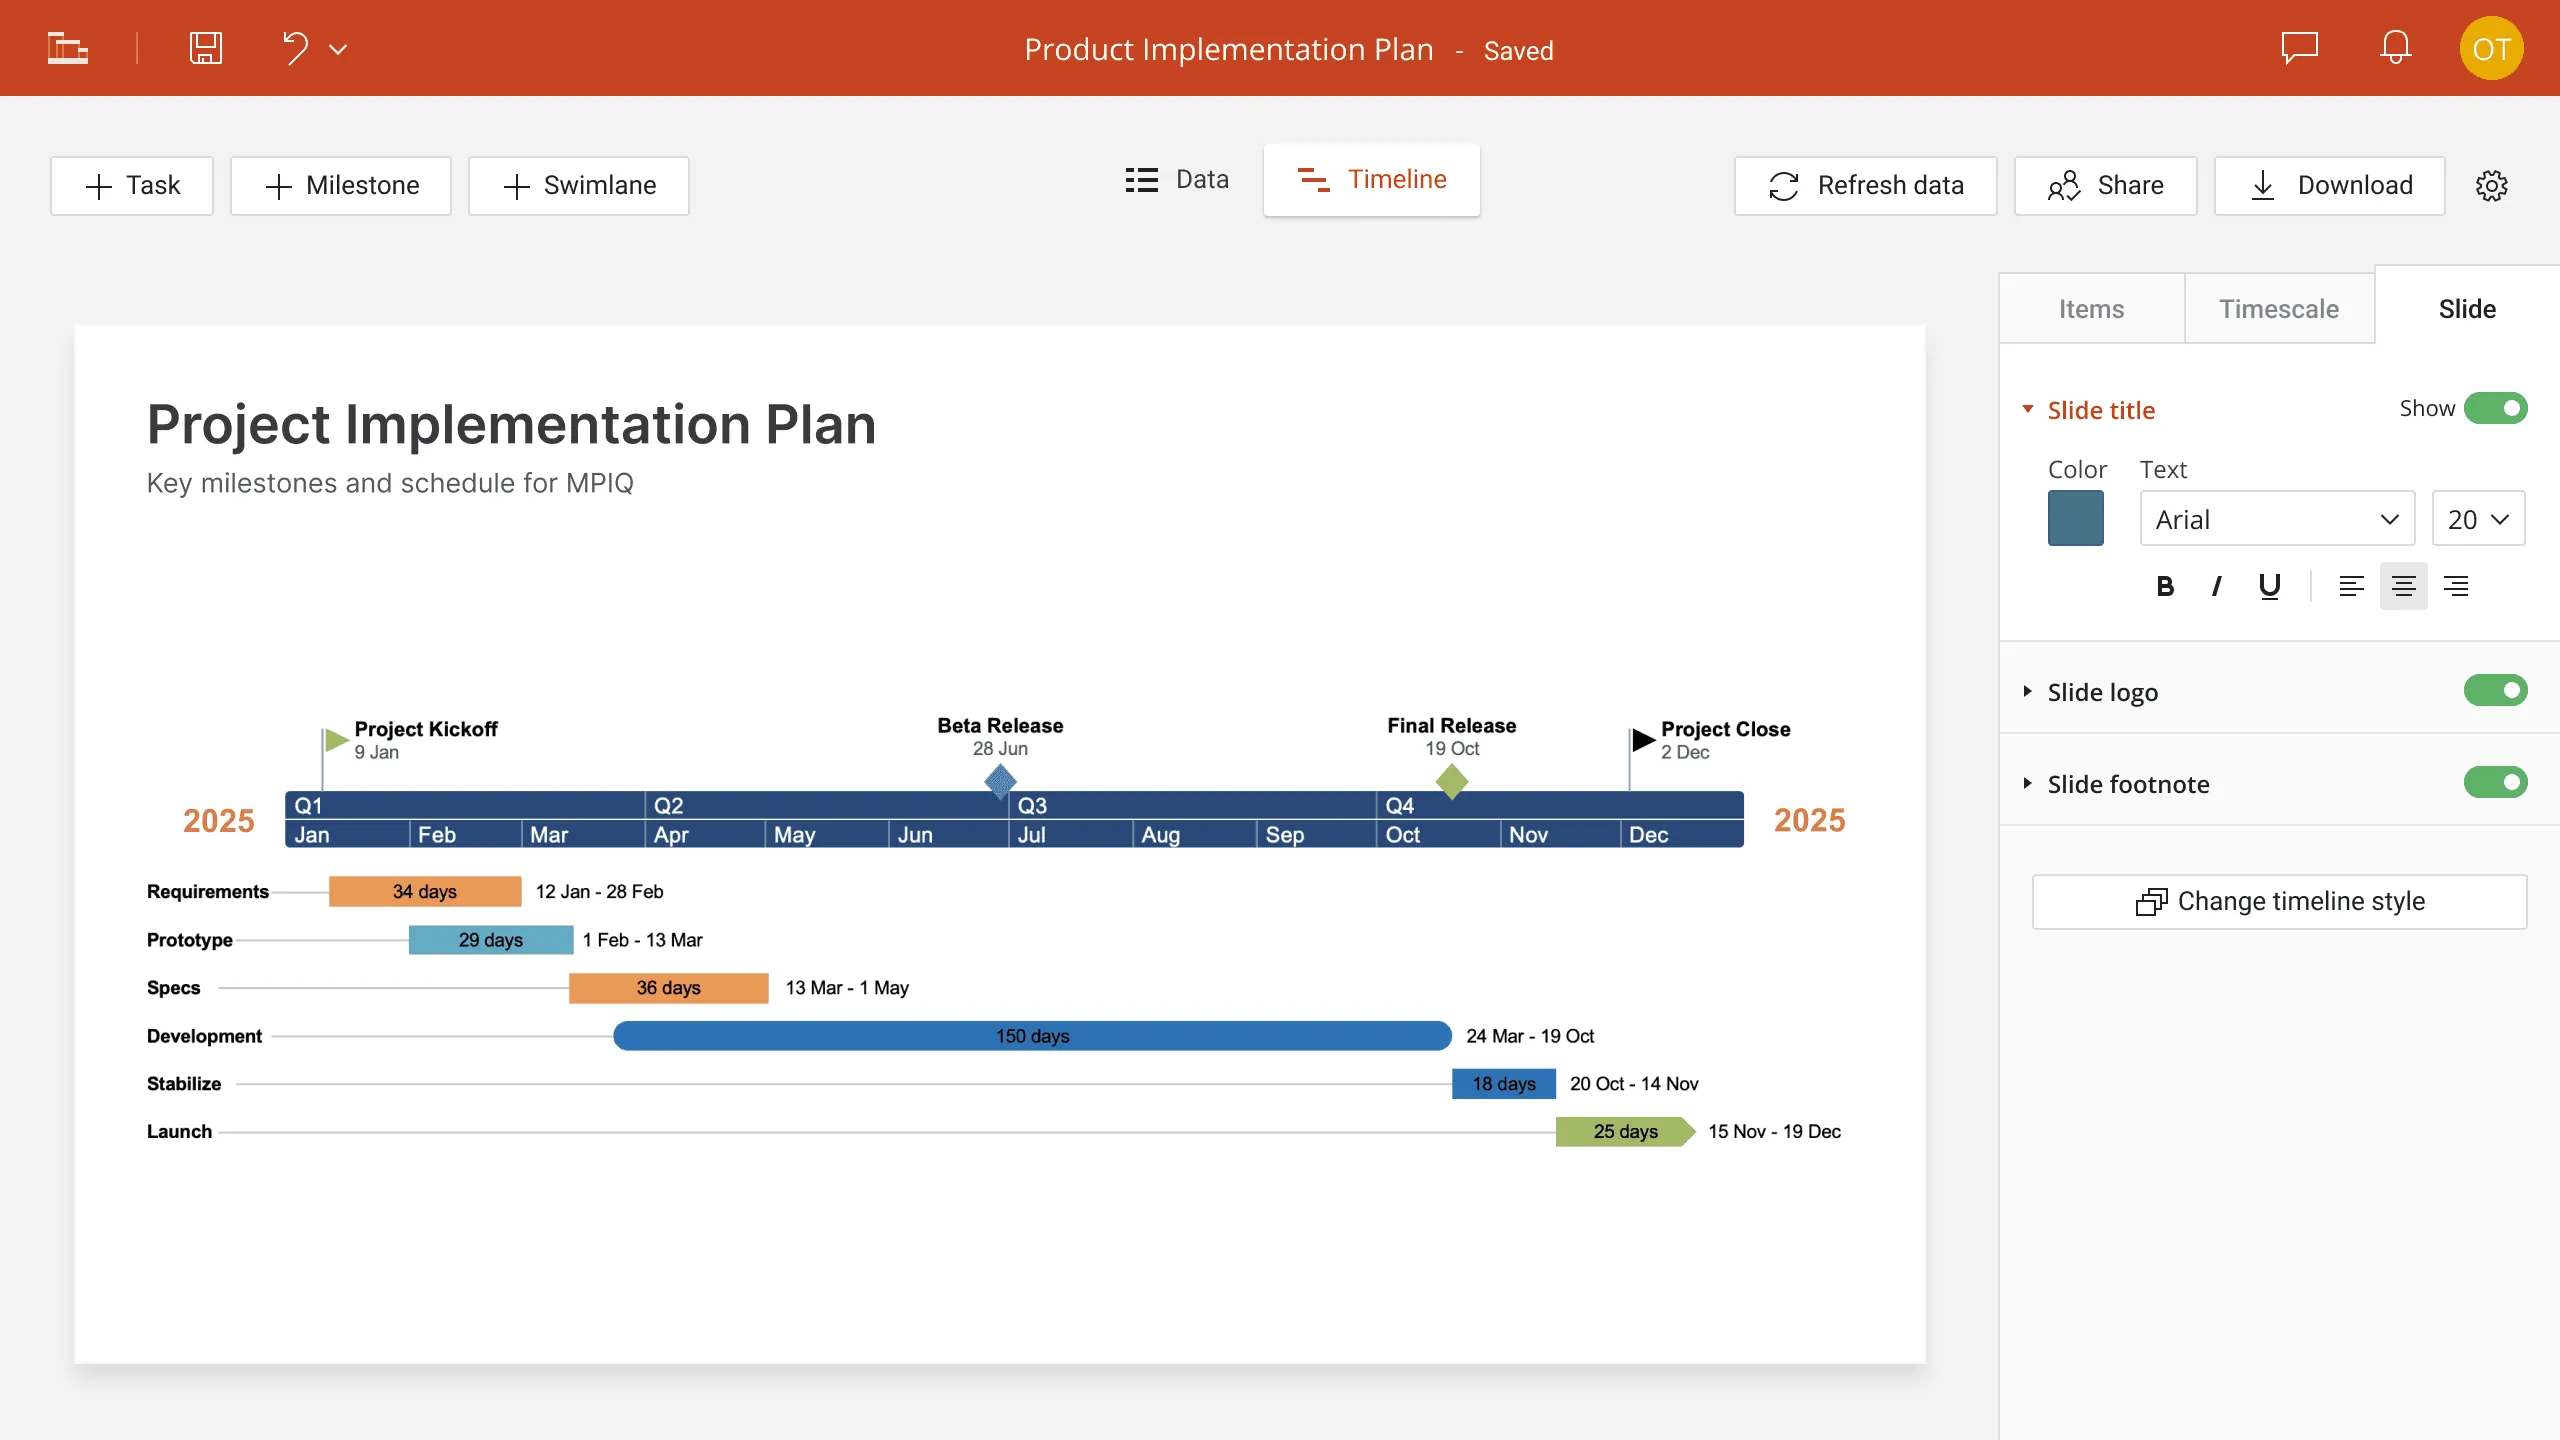
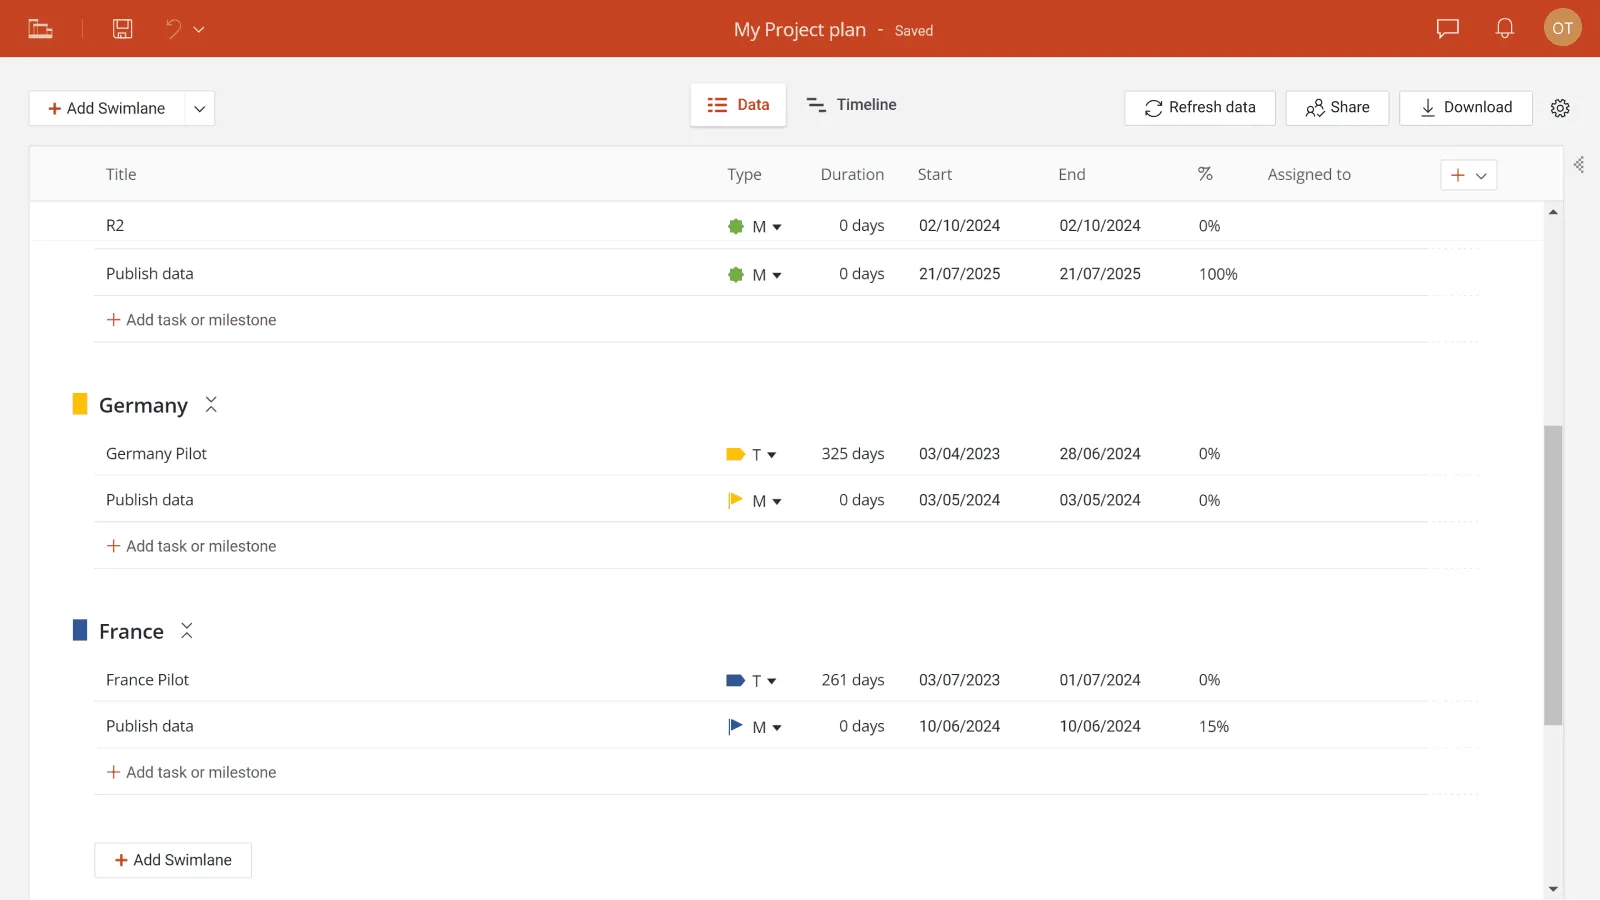
Keep your team aligned and coordinate your work more efficiently.
Assign individual tasks and milestones on your Gantt chart to help team members understand what they should be working on. Get better visibility into your team’s assignments and optimize performance.
Create timelines online with the #1 Gantt chart maker.
Use the web app to build and update clear, professional Gantt charts—right in your browser. Create Gantt charts online from anywhere to keep your team aligned and your plans on track.
Effortless project management integrations
Import project data from Microsoft Project®, Excel®, Jira, and Smartsheet to keep your Gantt charts accurate and up to date. Export native PowerPoint slides or insert Gantt chart images into Google Slides to share the latest project visuals with your team. Save time and improve project tracking with always-current, shareable visuals—all from your browser.
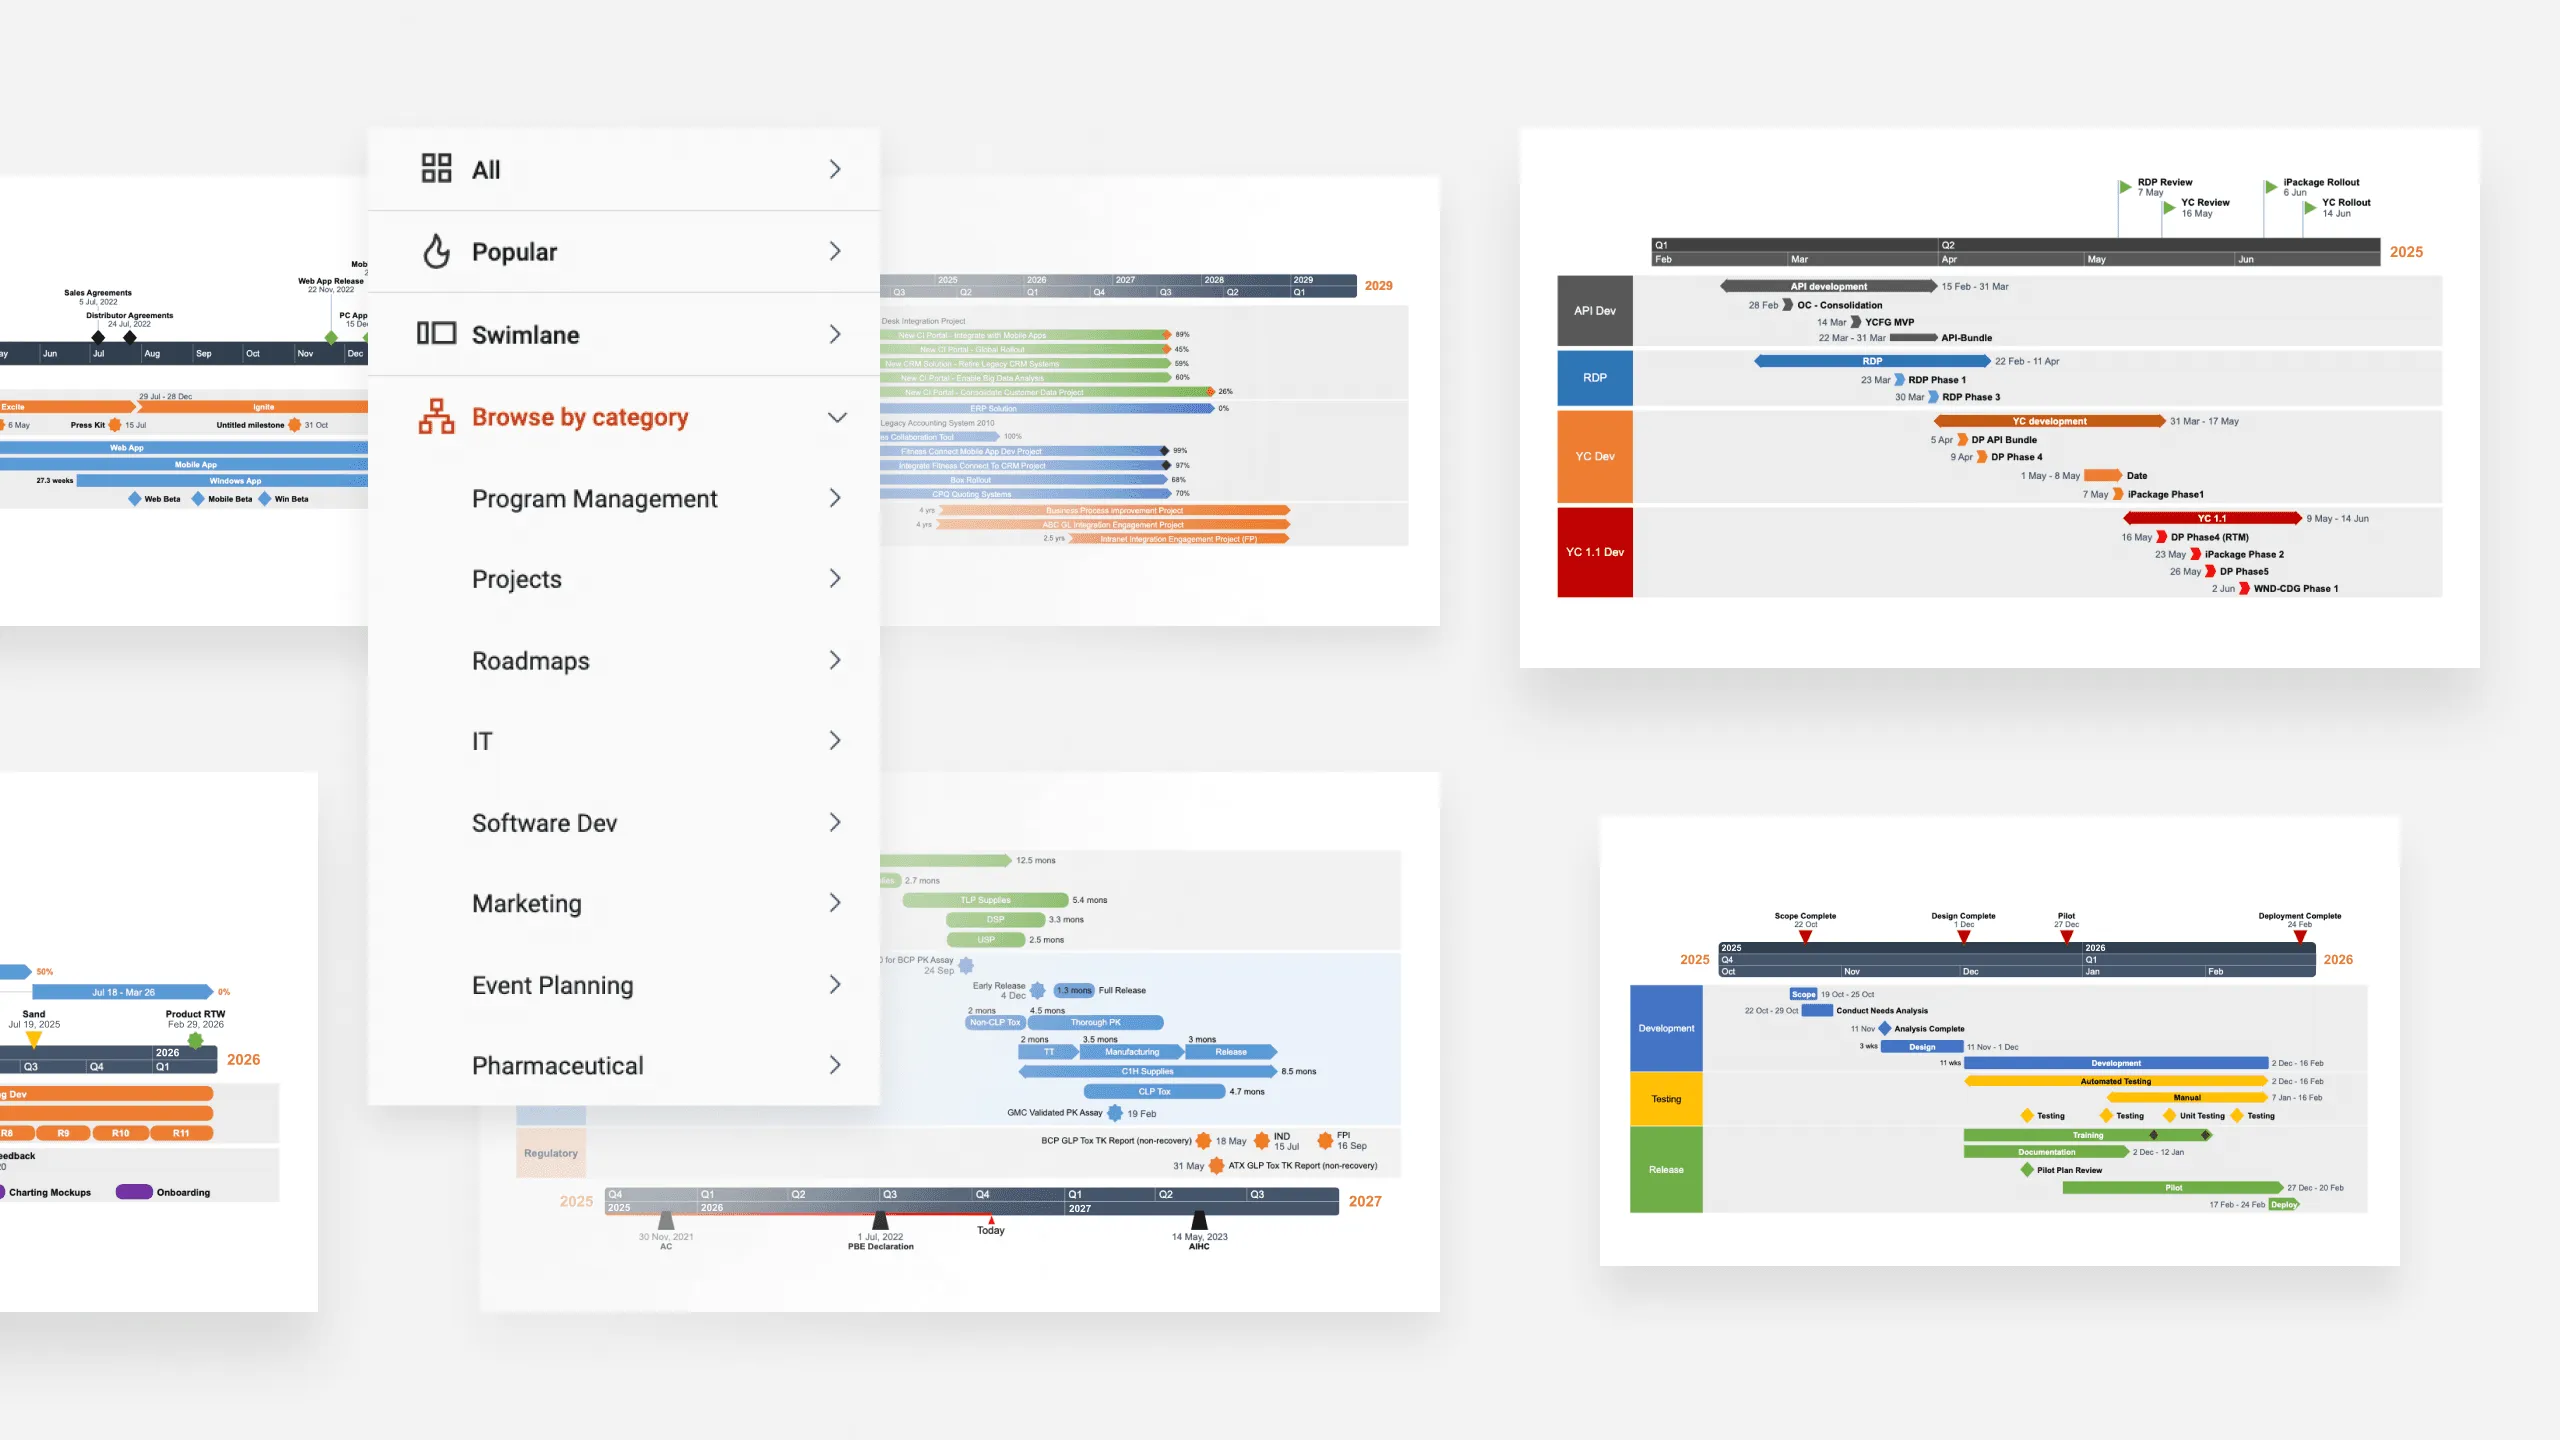
Kickstart your project planning with ready-made templates within your web Gantt chart creator.
Choose from a variety of ready-made templates for any project type - from swimlanes and roadmaps to IT and pharmaceutical timelines. Each template helps you create professional visuals in just minutes.
Compare Office Timeline Online plans
| Free | Premium | |
|---|---|---|
| Formatting | ||
| Create Swimlanes | ||
| Add milestones inside Swimlanes | ||
| Show multiple timescales | ||
| Editing | ||
| Drag & drop tasks and milestones | ||
| Add notes | ||
| Branding | ||
| Access to templates | ||
| Upload logo | ||
| Add slide title and footnote | ||
| Watermark-free timelines | - | |
| Collaboration | ||
| Unlimited collaboration | - | |
| Assign tasks to team members | ||
| Save timelines in the cloud | ||
| Create folders | ||
| Export options | ||
| Download timelines as PowerPoint slides | - | |
| Download as image (PNG) | - | |
| Download as Excel file | - | |
| Integrations | ||
| Import & refresh Jira data | * | |
| Import & refresh Excel data | * | |
| Import & refresh Project data | * | |
| Import Smartsheet data | * | |
| Insert & refresh timelines in Google Slides and Docs | ||
| Import Google Sheets data | ||
| Support & updates | ||
| Unlimited free updates | ||
| Technical support | - | |
| Price (1-year subscription, billed annually) | Free | |
Frequently asked questions about Gantt charts
Using the Gantt chart framework, it becomes considerably easier to achieve these objectives:
- Understand complex data by viewing it as a linear time progression;
- Schedule the concurrent workload of multiple teams across the project lifecycle;
- Untangle intricate timelines and arrange events in chronological order;
- Bridge the knowledge gap between technical teams and execs.
As a minimum, the best software should include these features:
- Access to multiple templates;
- Import from external data sources;
- An intuitive interface and simple controls.
To help you make an informed decision, check out a comprehensive list of the 10 most popular Gantt chart makers.