Gantt chart 101 – Part 4: When to use a Gantt chart (and when not to)
Learn when to use Gantt charts for your projects and when it’s best not to. Create amazing project visuals that impress your audience with our user-friendly Gantt chart maker.

The key to delivering successful projects on time and under budget is knowing when to use Gantt charts and when it’s better to opt for another project management tool.
If you want to display project tasks against a timeline and get a quick view of how your project unfolds from start to finish with every milestone and deadline in between, the Gantt chart is your best choice.
Not only does this tool help you manage complex projects efficiently, but it also allows you to deliver progress updates to clients and executives in the most engaging possible format. We’ve already covered how to use Gantt charts for your projects in more detail in one of our latest blogs, so make sure you go and check that out. In this fourth section of our Gantt chart 101 series, we’re going to discuss when you should use a Gantt chart and when you shouldn’t.
When to use a Gantt chart in project management
To give you a brief overview of the main benefits of a Gantt chart, you can use this tool to effortlessly turn complex projects into manageable tasks and create schedules that clearly illustrate what needs to be done, when, and what the next milestone is.
Moreover, Gantt charts allow you to you regularly update key stakeholders on current progress and improve team collaboration. Now, let’s take a look at the scenarios where you can leverage the benefits previously mentioned:
1. When you have to make a presentation to stakeholders
It’s no secret that clients and executives appreciate professional-looking project visuals that provide them with a big-picture overview of the whole project. Not to mention project charts that help them avoid death by boredom.
So if you have a presentation coming soon, including a Gantt chart slide is a must. Apart from simplifying complex project data, Gantt charts allow you to efficiently organize that information using multiple timescales, color-coded task bars, swimlanes, and milestones.
If you’re interested in learning more on this topic, check out this article about the do’s and don’ts of creating a Gantt chart for your PowerPoint presentation.
2. When you need to create a report for the executive team
At certain points in the lifecycle of a project, you’re going to have review meetings where the actual progress is compared to the original plan, uncovering potential issues and roadblocks.
To prepare for such a meeting, you’ll have to provide executives and other stakeholders with a status report that reviews your project’s performance up to that moment. For this, you can use a Gantt chart to create a baseline for your project, which will serve as a starting point for comparison when reporting on progress.
Moreover, the visual nature of Gantt charts will help your project team better understand if everything is on schedule or if there are deviations from the initial project plan that need to be addressed.
3. When you’re pitching to a new client
Let’s imagine you want to reassure a new client of your ability to help them achieve their goals and deliver high-quality products.
If you want to make a good impression, you need to build a beautifully designed pitch deck that provides them with an overview of your business and services and highlights previous successful projects. One of the best ways to impress your client and convince them you can bring their idea to life is to include memorable visuals, such as a Gantt chart when displaying your company’s roadmap.
Moreover, since pitch desks are on the shorter side, Gantt charts can help you condense your information and turn it into easy-to-understand slides.
Easy Gantt chart maker
Create Gantt charts in seconds with the Office Timeline add-in for PowerPoint
When NOT to use Gantt charts
Like any other project management tool, Gantt charts have their limitations and cannot be used for every single aspect of managing a project. Here’s when you shouldn’t use a Gantt chart:
1. When you’re in the discovery phase
The role of the discovery phase is to define the context of a project and determine strategic objectives, key stakeholders, scope, and limitations.
At this stage, where you’re still trying to grasp project phases, tasks, deliverables, and deadlines, using a Gantt chart can only lead to you having to redo it at least one dozen times to get everything right. And going through that is not only frustrating but also time-consuming.
Therefore, we recommend you start working on your Gantt chart when you already have a clear picture of your project’s timeline and workflow, including all the tasks to be completed with their start and end date and estimated duration, milestones, and deadlines.
2. When you have to manage the details of your project
What you must keep in mind is that the Gantt chart offers you an overview of your project’s schedule while displaying only the required level of relevant project information. This way, whether you’re presenting that information to your team or clients and executives, your audience can easily follow and comprehend your chart. If you introduce more details than necessary, you risk creating a Gantt chart that looks cluttered and is nearly impossible to read. Plus, your presentation will be received with confused or annoyed stares in the best-case scenario.
Our advice: Keep your Gantt charts simple by adding only those elements of a Gantt chart that must be there. Also, use a project management solution that allows you to manage all the remaining details of your project, like MS Project, Excel, Smartsheet, or Wrike. Then, when it’s time for the project review meeting, you can use a PowerPoint add-in like Office Timeline that imports your project data straight into PowerPoint.
3. When you’re managing your resources
Despite being a great tool to display the timeline of your project and schedule tasks, a Gantt chart falls short when it comes to resource management.
The main reason for this is that while each bar in the chart shows a task’s duration, it doesn’t depict the level of resources required to complete that task. For example, a task with a shorter bar takes less time to complete, but it can involve more costs in terms of the team members working on it and the equipment used.
To ensure that you have complete visibility over your project resources, we suggest you look for a resource management tool that can help you keep track of resource availability and avoid delays and use a Gantt chart tool instead when you need to show an overview of your project in executive meetings.
4. When you want to see the scope and costs of your project
When managing a project, you must keep in mind the triple constraint, also known as the project management triangle: time, scope, and cost. The three elements are interrelated, meaning that a change in one dimension will also affect the others.
Going back to the Gantt chart, this type of visualization tool only illustrates the time coordinate. While it does a great job at that, it fails to provide a comprehensive view of your project due to the lack of scope and financial details.
That’s why we recommend you choose another method to manage the scope and cost dimensions and keep projects on the right track. Or you can create a Gantt chart on a slide and use the rest of the slide space to include high-level information about other important aspects.
To Gantt chart or not to Gantt chart
Gantt charts are a crucial element when it comes to planning, scheduling, and keeping track of project tasks. However, you first need to know when it’s the best moment to use them to unlock their amazing powers.
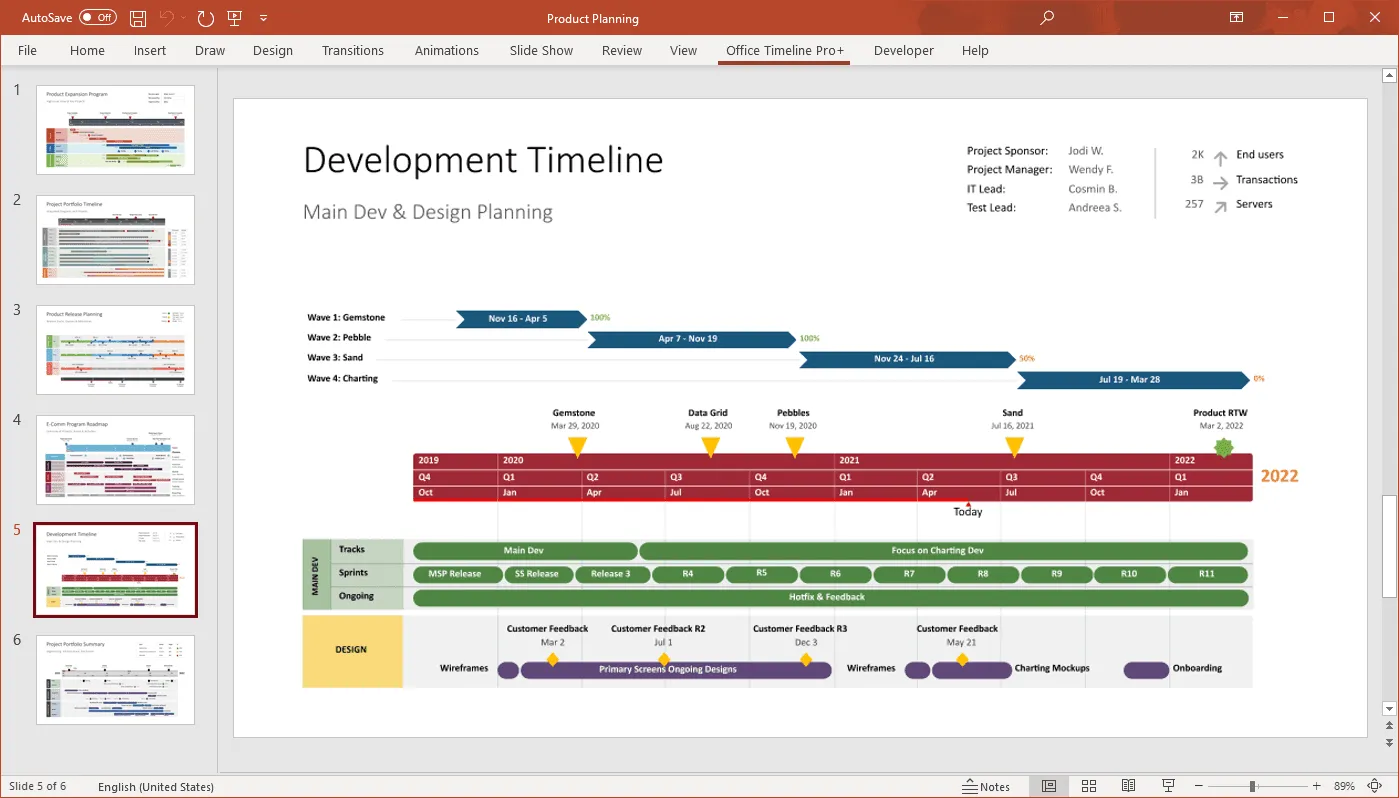
If you want to boost those powers, you can do so with the help of a Gantt chart software. Office Timeline is an online tool and PowerPoint add-in that can be used by both Gantt chart beginners and experienced professionals to create visually appealing and easy-to-read Gantt charts, roadmaps, and timelines.
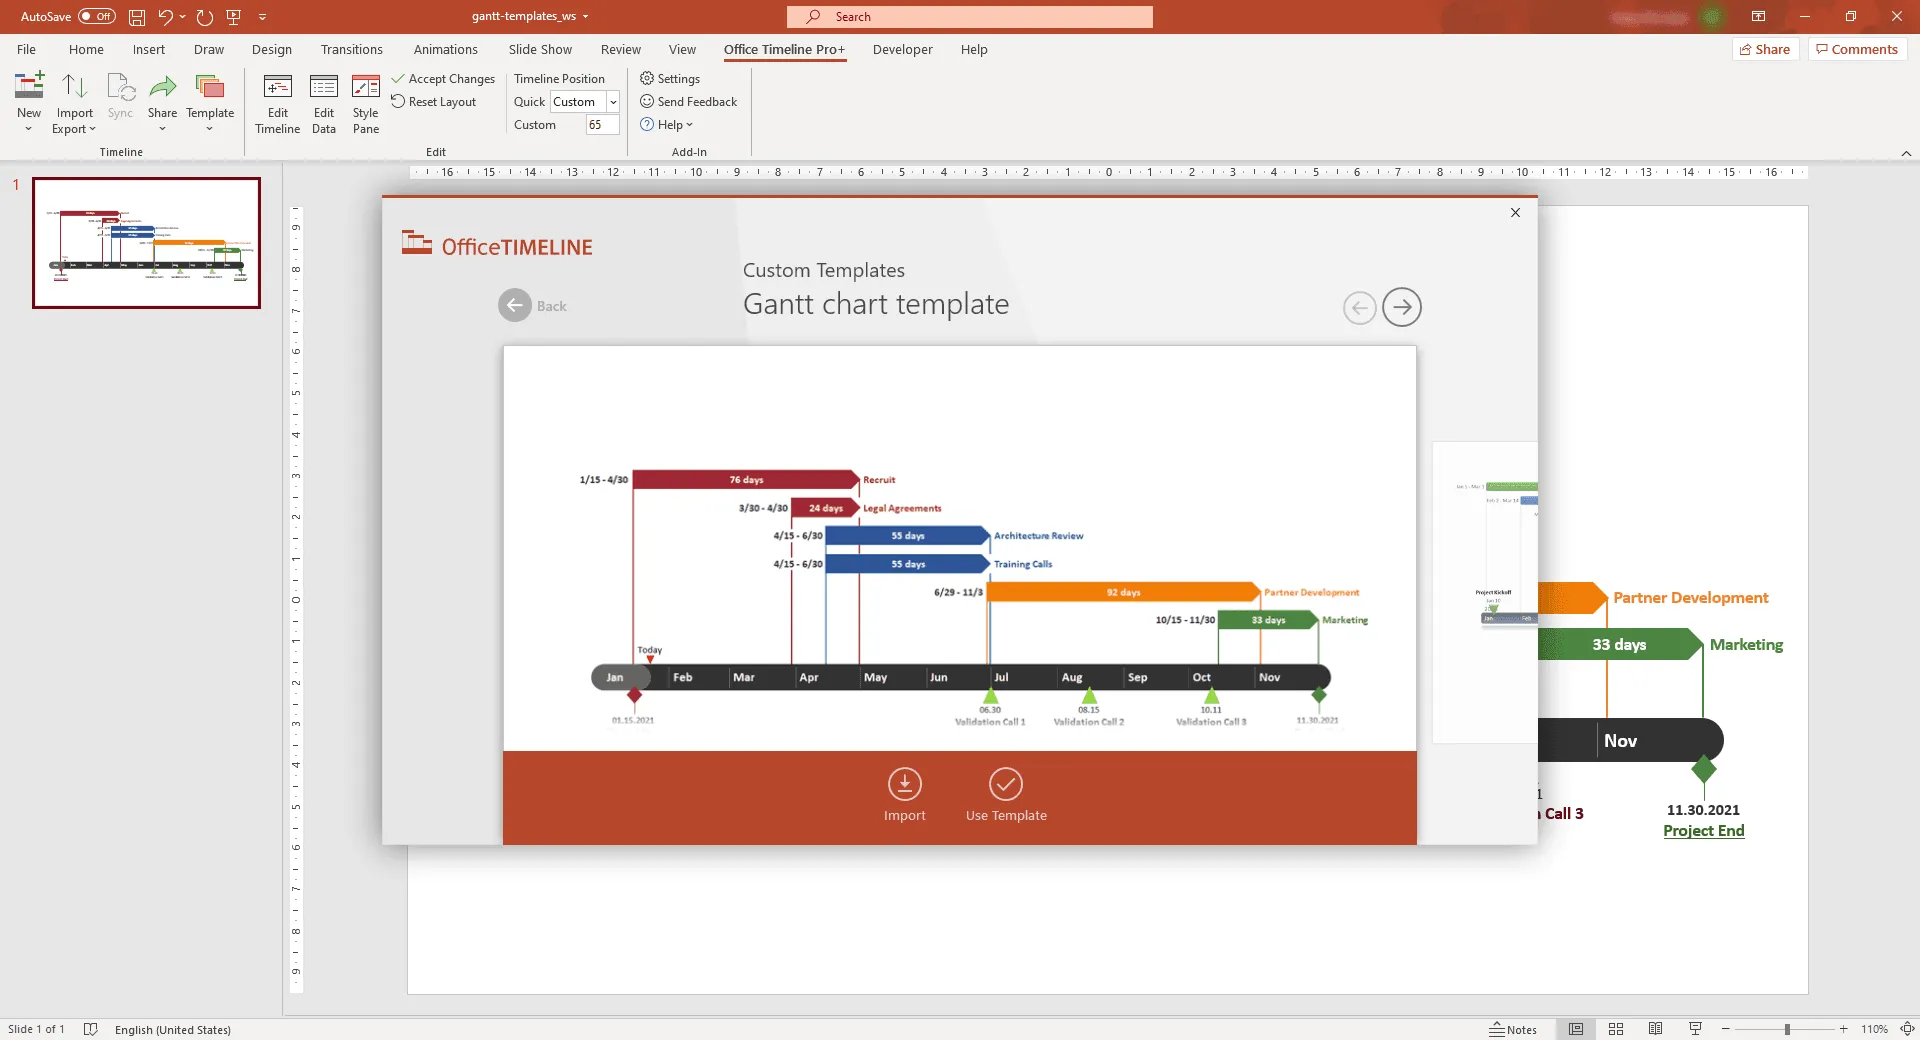
Thanks to our extensive collection of Gantt chart templates and user-friendly drag & drop interface, you can make beautiful, presentation-ready Gantt charts in PowerPoint in just a few minutes. To customize any of our pre-designed Gantt chart templates, simply go and install the Office Timeline free trial version on your computer.
Project management tips and tricks
Tagged With:
Gantt chart 101Turn project data into professional timelines
Get the advanced features of Office Timeline free for 14 days.
