Overview
A milestone chart helps project or program managers, stakeholders and team members to visualize and easily track the progress of a project. Illustrating planned significant events that are scheduled to occur at a certain time, a milestone chart allows for corrective actions to be taken if the project is falling behind and, thus, ensures that efforts successfully stay on target.
Learn more about what a milestone chart is and how it can be used in project management with the help of our Q&As below. We’ve also included here a free downloadable milestone chart template that you can customize to build a clear, professionally looking visual mapping of your project.
What is a project milestone chart?
A project milestone chart or milestone schedule is a visual display of important events (also known as milestones) that make up the planned course of a project’s timeline.
What is the typical format of a milestone chart?
The usual format of a milestone chart is that of a timeline that uses various symbols (squares, diamonds, circles etc.) to separate a project schedule into major phases. It typically contains a horizontal timescale for the whole project’s life cycle along which milestones, their descriptions and due dates are shown vertically.
Through this simple yet clear type of display, milestone charts provide essential information about planned and actual completion dates of a work schedule.
How do you create a milestone chart?
Here are the basic steps you need to take in order to create a clear project milestone chart:
- Identify major milestones – think of all the key achievements you want to reach along your project timeline. Milestones act as checkpoints that mark shifts in a project’s development or the completion of important tasks.
- Set dates for each of your milestones – estimate the dates when your milestones are expected to be completed.
- Create your milestone chart from a timeline template like the one provided here.
Alternatively, you can learn how to make a timeline or a milestone schedule using various office tools like Excel or PowerPoint with our step-by-step tutorials.
What are project milestone examples?
Examples of project milestones include:
- the beginning or completion of a particularly critical activity;
- equipment deliveries;
- approval dates;
- press releases;
- hiring staff;
- contract signings etc.
What is a milestone template?
A (project) milestone template is any pre-built timeline chart that gives a predefined format to your list of milestones. Milestone templates are useful because they:
- Save you time and effort since you don’t have to start from scratch in creating a milestone chart.
- Enable you to clearly visualize the outline of your project.
- Act as a guide and reference map for those who are new to your project.
Using and updating the Milestone Chart Template
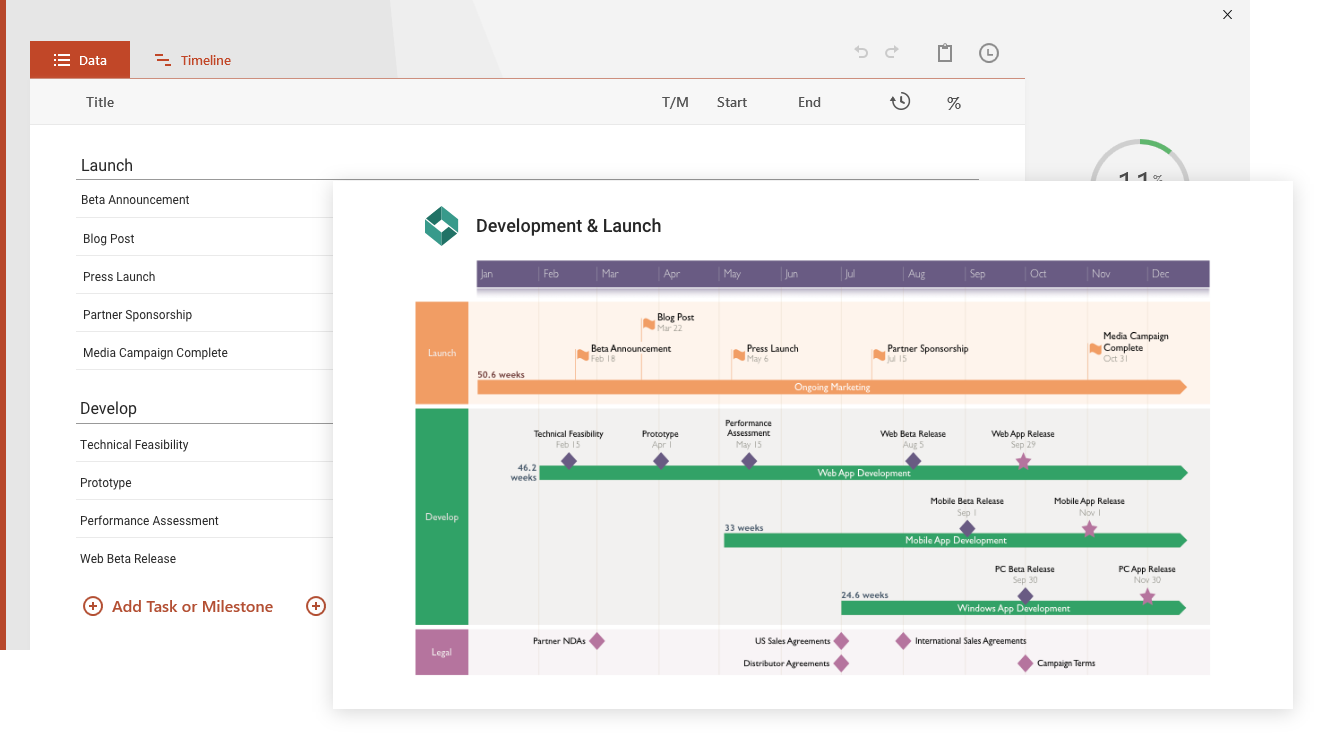
Use the milestone chart template as a simpler way to illustrate, schedule and report your project. A milestone chart will provide a snapshot of your project for important presentations and communications with management or customers. This particular sample is a downloadable PowerPoint template so you can use the familiar application to easily change the milestone chart for any purpose.
Milestone charts can be used to illustrate the key events, objectives and targets of any project or plan. This makes the milestone template an excellent tool for planning projects or managing programs where visualizing the key components need to be displayed in chronological order on a time schedule. The free milestone chart template should be used for top level reviews. It was made for reporting to management and clients, or any audiences who should not be overwhelmed with the detailed minutia of a plan or project.
Since milestone charts provide a summary view of a project, they are easier to communicate than other complicated project charts made from long lists of tasks. Milestone charts are also excellent planning tools because they show key events on a timeline culminating in the completion of the plan.
Planners can use the free project milestone template to visualize the sequence of events they need to achieve, from which they can build more comprehensive plans for reaching each milestone. The timeline can be updated with your own milestones by manually adding them to the template with PowerPoint.
The milestone chart template was created with the milestone chart maker from Office Timeline. Office Timeline is a free plug-in for PowerPoint users. Using its free 14-day trial, you can create a simple milestone chart or even add tasks and multi-level swimlanes, if necessary. The Office Timeline add-in will quickly edit the styles, shapes, colors and design of any of the objects on the milestone chart.
Frequently Asked Questions about milestone charts
Let’s answer some frequently asked questions when it comes to creating milestone charts.
What is a Critical Path in project management?
The Critical Path (CP) is a project management term that refers to the sequence of tasks that are mandatory for the completion of a project. On a timeline, it is visually represented as a line connecting tasks and milestones that are part of the CP. Here’s an example:
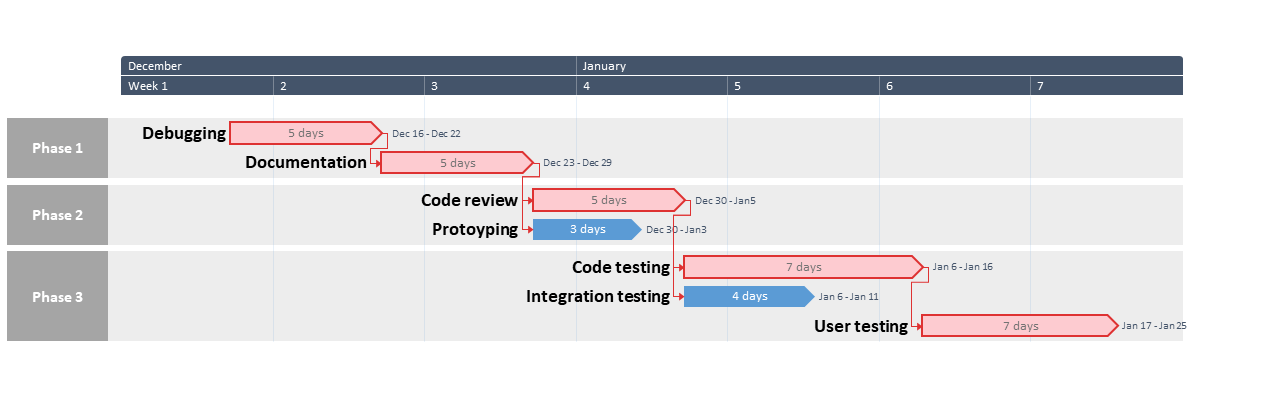
The total duration of these tasks determines the project’s timespan. If any task on milestone on the Critical Path is delayed, so is the project’s completion date. The job of determining which tasks and milestones are part of the CP falls to the project manager. You can find out more in our comprehensive guide about what Critical Path is and how to use it.
What is critical path analysis?
Critical path analysis constitutes a technique frequently employed in project management to map out the tasks and milestones on a project timeline that are essential for the completion of a project. For this purpose, the project manager (PM) must determine the time interval necessary to finalize all the aforementioned activities, and the dependencies that exist between them. Since in most scenarios critical tasks will have dependencies, any delay to one of them will also add to the total duration of the project.
What is total float in project management?
Total float, also known as ‘slack’, is applicable in projects that rely on the critical path method to plot out the most efficient path forward. In these scenarios, the project manager defines the critical tasks and identifies dependencies between them. The total float refers to the maximum amount of time a critical task can be postponed without impacting the project’s end date. To calculate maximum float, a PM will subtract the latest possible completion date of a task from the earliest estimated time of completion, while also keeping in mind dependencies downstream.
What are deliverables in project management?
Deliverables are the specific outputs of objective-driven work within a project’s scope. Another way to put it would be to say that they are the results of activities planned and conducted as part of the ongoing project. On a timeline, deliverables can be represented as:
-
Tasks: when the deliverables are the result of a completing a certain process, for example.
-
Milestones: when the deliverables are more similar to crossing a threshold.
It’s important to note here that, while a deliverable can be marked with a milestone on graphics like Gantt charts or timelines, not all milestones represent deliverables. Milestones typically indicate the completion of a project phase and transition into the next one, but not every project phase requires a tangible result in the form of a deliverable.
What are examples of deliverables?
Broadly speaking, there are three main categories of results that we refer to as deliverables in project management: documentation, tangibles, and intangibles.
-
Documentation
The original plan of the project, charter and even the business case can be regarded as deliverables. In addition to these, any document in the form of a status, budget or progress report, in some cases even meeting minutes, fall under the category of deliverables.
-
Tangibles
These are the concrete project outcomes, in form and substance. Examples of tangible deliverables include a new local dog park, a smartphone application or a new magazine.
-
Intangibles
Any result with a measurable outcome but of a more conceptual rather than concrete nature is an intangible deliverable. For instance, you could use an incident response plan template to make sure your company completes its mandatory security training program.
What are the 5 stages of project management?
Project management defines five main stages as a way of breaking down the lifecycle of most enterprises, as follows:
-
Initiation: the project is defined in broad terms, typically by a business case or feasibility study;
-
Planning: a goal setting method (typically SMART or CLEAR) is chosen, afterwards the scope is defined and finally the work breakdown schedule is created;
-
Execution: tasks and activities are carried out and the deliverables agreed upon are being produced;
-
Monitoring & control: key performance indicators are being tracked while the execution phase is ongoing;
-
Closure: deliverables are being handed over to the client, resources are released, final reports are being prepared and all activities related to the project are stopped.
For more information, check out our blog post on how to conquer the 5 Project Management life cycle phases.
What are the major deliverables for project closure?
Project closure typically represents the final stage of any project and is therefore the best time to be talking about deliverables. Assuming that we are referring to a standard closure, in the sense that the project did not fail or was terminated prematurely, the three main deliverables would be:
-
Wrap-up: all chores, documentation, stakeholder input and reports concerning the project;
-
Audit: an evaluation of the project’s success rate based on retrospective and causal analyses, to help identify and correct deficiencies for future ventures;
-
Performance evaluation: management evaluation of individual and team performance, potentially with input on the part of the customers and collaborators.
For more details, explore this 7-point checklist for project closure on our blog.
What is a milestone in project management?
Milestones are tools typically utilized on timelines, Gantt charts, roadmaps or swimlane diagrams to mark a turning point in the schedule. More specifically, they can signify the completion of a phase, the starting or the end point of the project, and virtually anything that must be highlighted along the way. If the role of tasks is to break the total work into manageable chunks, milestones are there to segment the project into distinct phases that are easier to schedule and execute.
What is a milestone on a Gantt chart?
On a Gantt chart, milestones are points set along the project’s timeline to determine progress and keep track of critical tasks. Defined correctly, the number of the milestones reached is directly proportional to the project’s completion percentage. On a Gantt chart, the milestones that are part of the Critical Path can help better partition phases or confer each phase its own slack. More uses for milestones include:
-
Enhanced project visualization: on a Gantt chart, milestones offer the viewer a high-level understanding of the key events, without the need to examine the tasks involved in each phase. Find out more about data visualization practices, tools and trends on our blog.
-
Determining bottlenecks and delays: milestones can also be used as progress markers for more minor events; doing so allows project managers to determine which team isn’t meeting which milestones, thus being able to address the issue before it impacts the entire schedule.
-
Mark accomplishments and provide motivation: aside from scheduling-related functions, Gantt chart milestones are great for keeping the teams excited about the work and will come in handy when presenting progress to stakeholders.
What is the duration of a milestone?
On visual representations like Gantt charts or timelines, tasks have a start date and end date, as they represent the duration of completing an activity or process. Conversely, milestones constitute events with no (zero) duration. They primarily have the role of marking an achievement or the completion of specific project phases.
Effectively track the progress of your project using our milestone chart template that can be easily customized in PowerPoint using the Office Timeline add-in’s free 14-day trial.