Workflows that involve multiple teams are usually complex and can be difficult to visualize. However, you can effectively map them out if you use a swimlane diagram. Also known as a cross-functional flowchart, this type of visual improves clarity because it distinctly groups the underlying sets of tasks from a process by teams/owners.
To help you out in your process/workflow-mapping endeavors, we’ve created this page where you will find instructions on how to manually build a swimlane diagram in Microsoft Visio. As a bonus, we’ll also present an easier and faster alternative which allows you to automatically build a cross-functional flowchart using the PowerPoint add-in from Office Timeline.
Which tutorial would you like to see?
How to manually make a swimlane diagram in Microsoft Visio
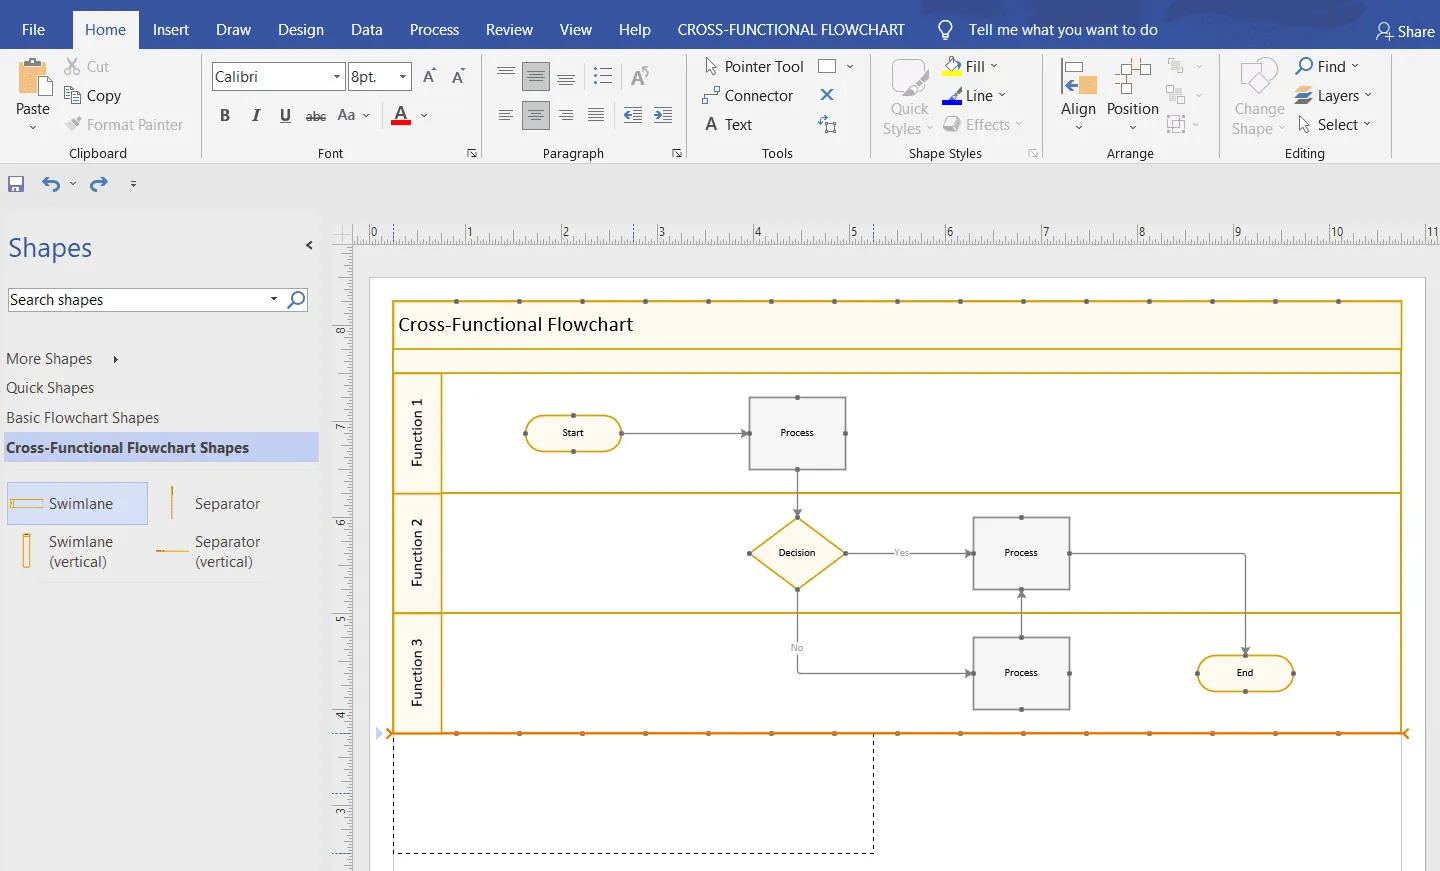
1. Select the flowchart type.
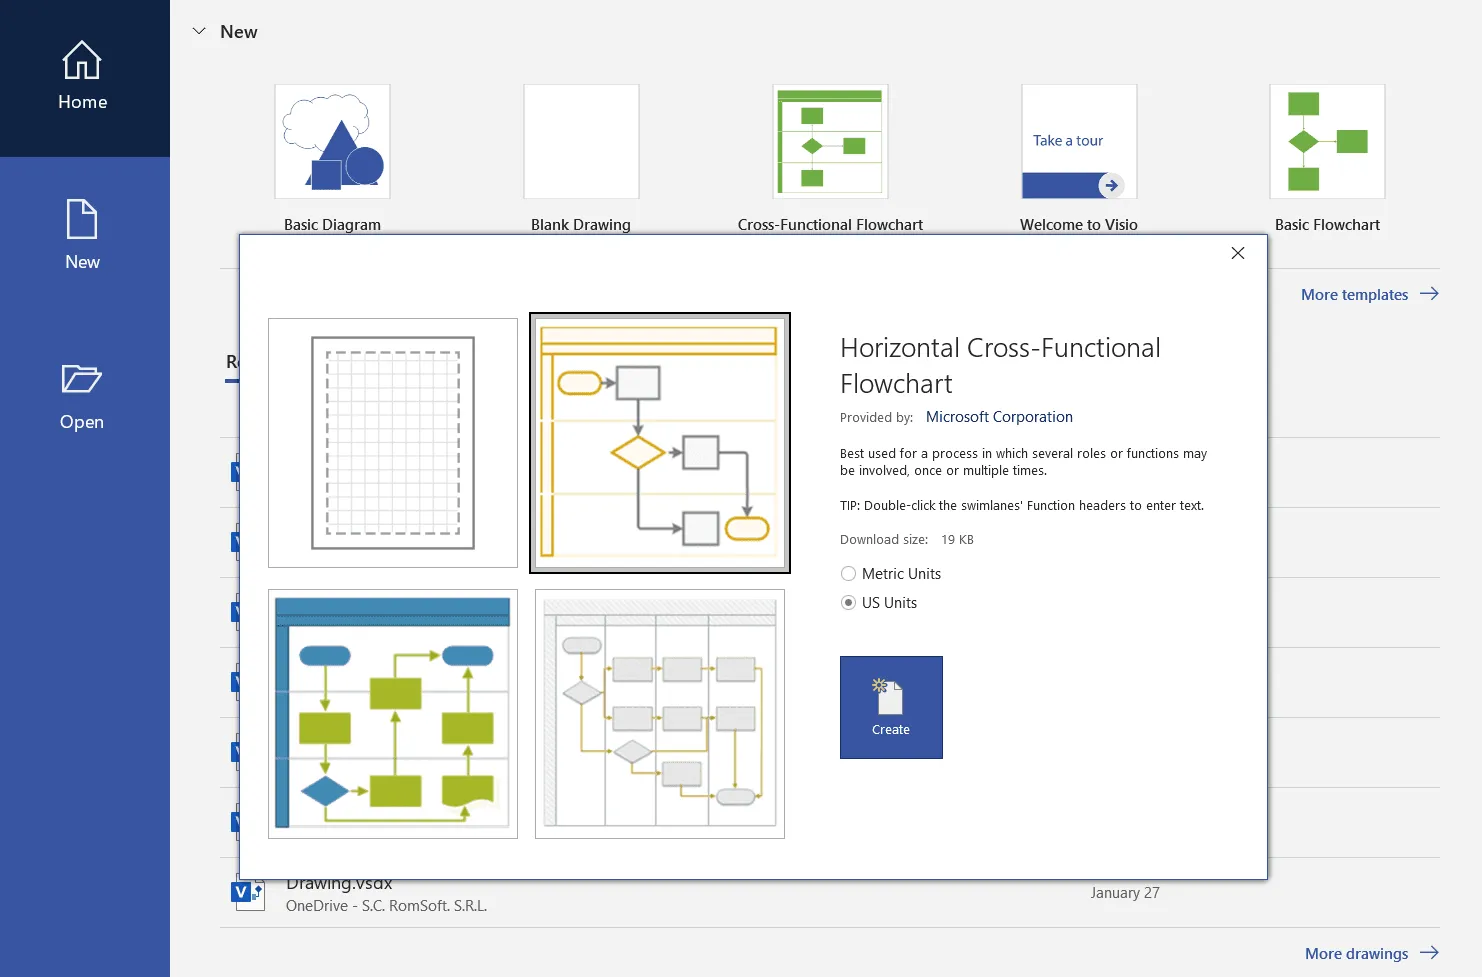
When you open Visio, you will immediately see a list of various charts and diagram templates. To start building your swimlane diagram, click on Cross-Functional Flowchart. You can opt for the horizontal or vertical orientation of the swimlanes. For this demonstration, we’ve selected the Horizontal Cross-Functional Flowchart option. Now the basic outline of your diagram is generated.
2. Add swimlanes.
From the Shapes window on the right, add as many bands as you need by dragging a Swimlane shape. Drop it onto an empty area of the diagram when you see the orange connection indicator appear in the place you want your swimlane to be.
To change the width of a swimlane, drag any of its separator lines (in our case, the horizontal ones). If you want to change the length of a swimlane, drag the end line (the vertical line on the right) until the container reaches the desired dimension. To move a swimlane and the shapes in it, you first need to click on the label bar until a grey highlight shows around the swimlane. Then, drag the swimlane and drop it when you see the orange connector showing at the location where you want to place it.
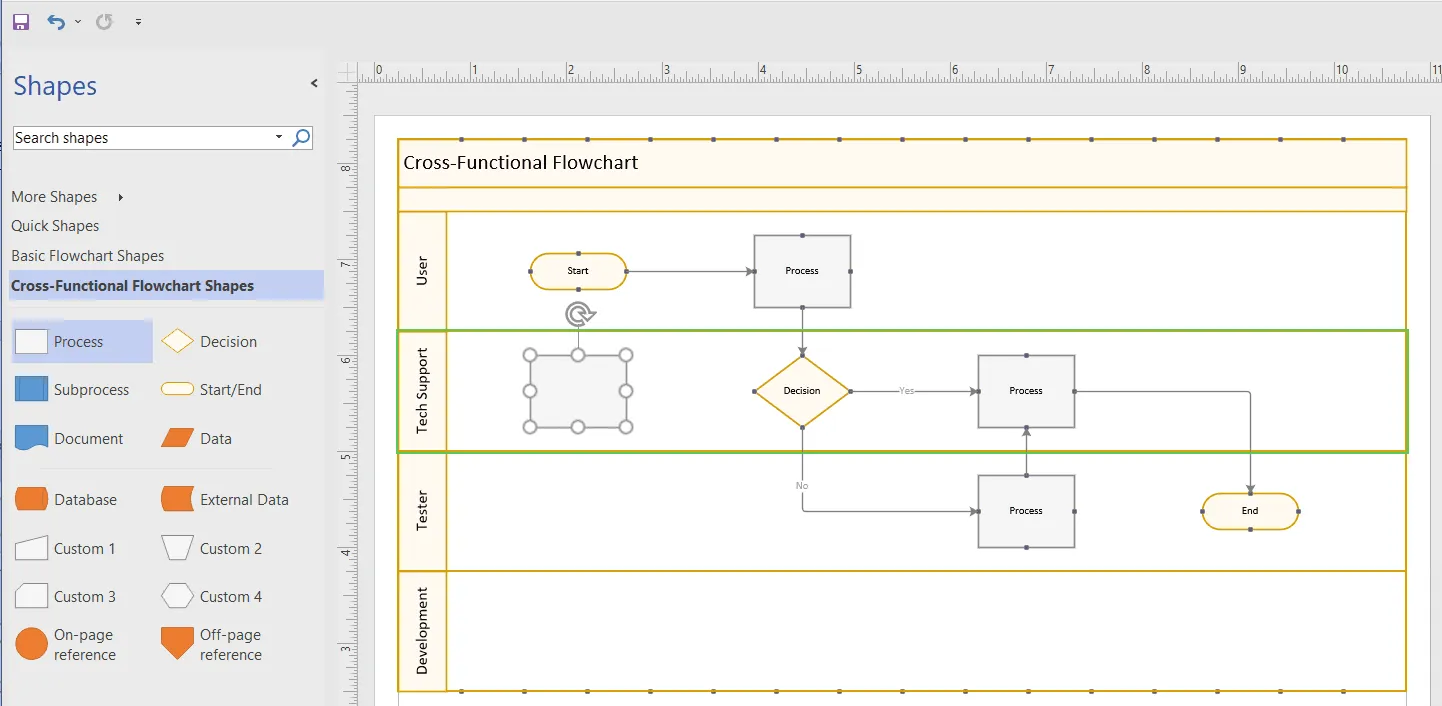
3. Label the swimlanes.
As you can see, the swimlanes of your Visio diagram have default titles (“Function [number]”). To rename any swimlane, simply double-click on its label bar and type in the new title, which can be the name of your teams, for instance. These labels will help you easily group your tasks (shapes) by owner (as shown in Step 4. below) and will allow you to see all the activities assigned to one particular team at a glance.
You can customize the text as needed: change size, color, or style using the options in Home > Font.
4. Add shapes to your swimlanes.
In the Basic Flowchart Shapes section on the left, choose the desired shapes for your process steps or elements and drag & drop them into their corresponding swimlane. When the shape is positioned correctly, the swimlane will be highlighted in green.
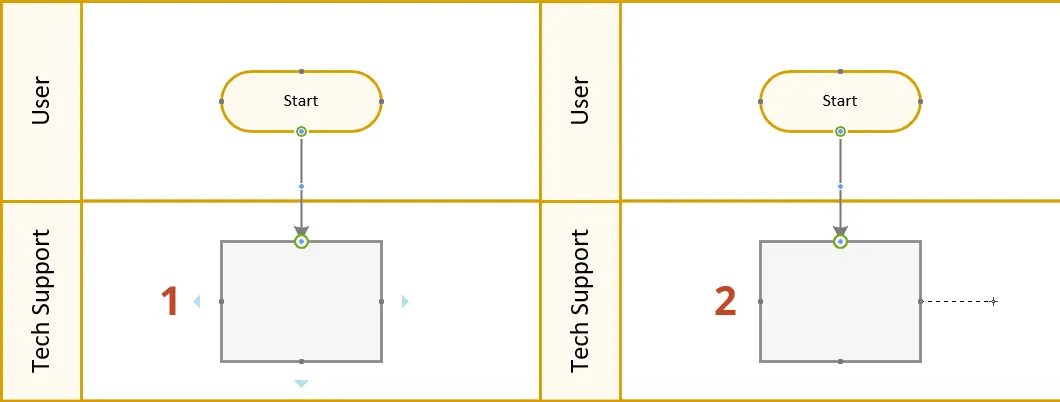
5. Add connectors to create a process flow.
To do this, click on any of the four arrows (Up/Down – Left/Right) that become visible upon selecting any shape and hover over it (see Figure 1 below). Then, use your cursor to draw a connecting line in the direction of another shape by pressing and holding either its left or right button and dragging the cursor towards the destination object (see Figure 2 below).
Tips:
- Double-clicking on an arrow will automatically draw a straight connector to the nearest shape found in the direction of the arrow.
- If you want to map out your process in more detail, you can use Separators from the Flowchart Shapes section to define stages.
6. Customize your swimlane diagram.
To customize fonts, use the formatting functions from the Home > Font section on the Visio ribbon. If you want to change the background of your diagram or further customize its colors, you can do so from the Design tab where you will find a variety of related options to choose from. In our example, we wanted to keep things simple and decided to modify only the overall theme of our diagram from Design > Themes, but don’t let that stop you from trying out the many alternatives available for the background and layout of your graphic.
Also, remember to add “yes/no” or “true/false” text boxes near the diamond (decision) shapes to indicate the possible outcomes of the process steps. To do this, go to Insert > Text > Text Box and position the text box next to the diamond shape. You can customize font (type, size, color) in Home > Font.
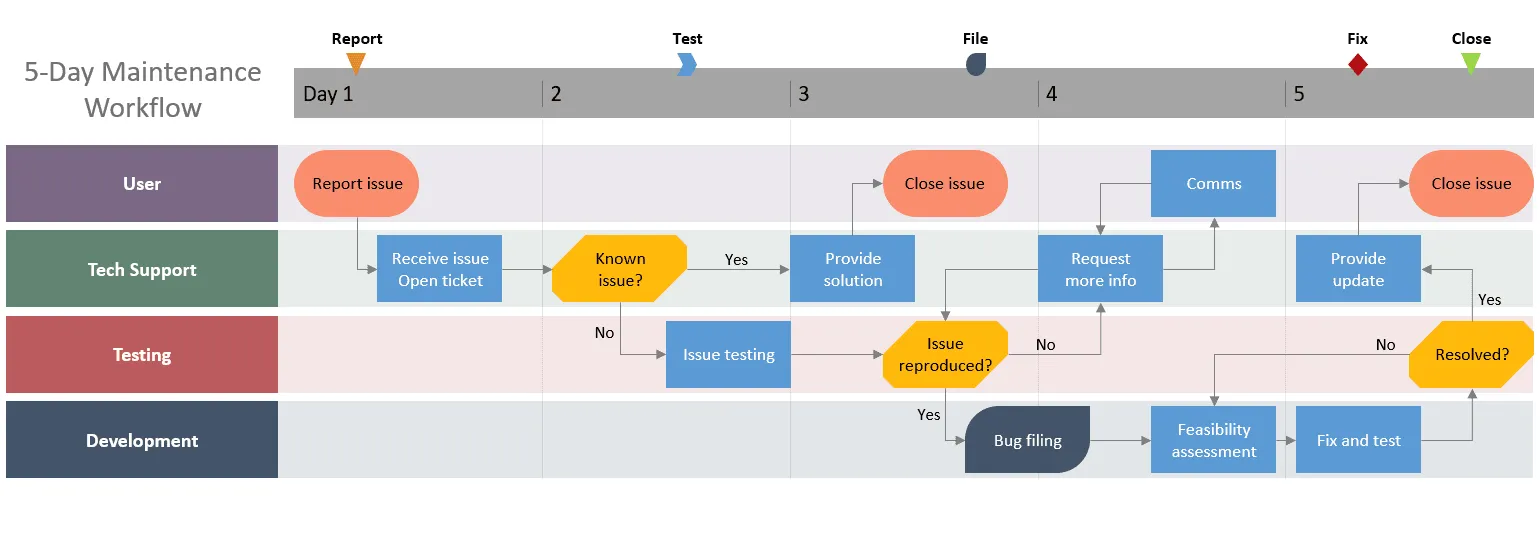
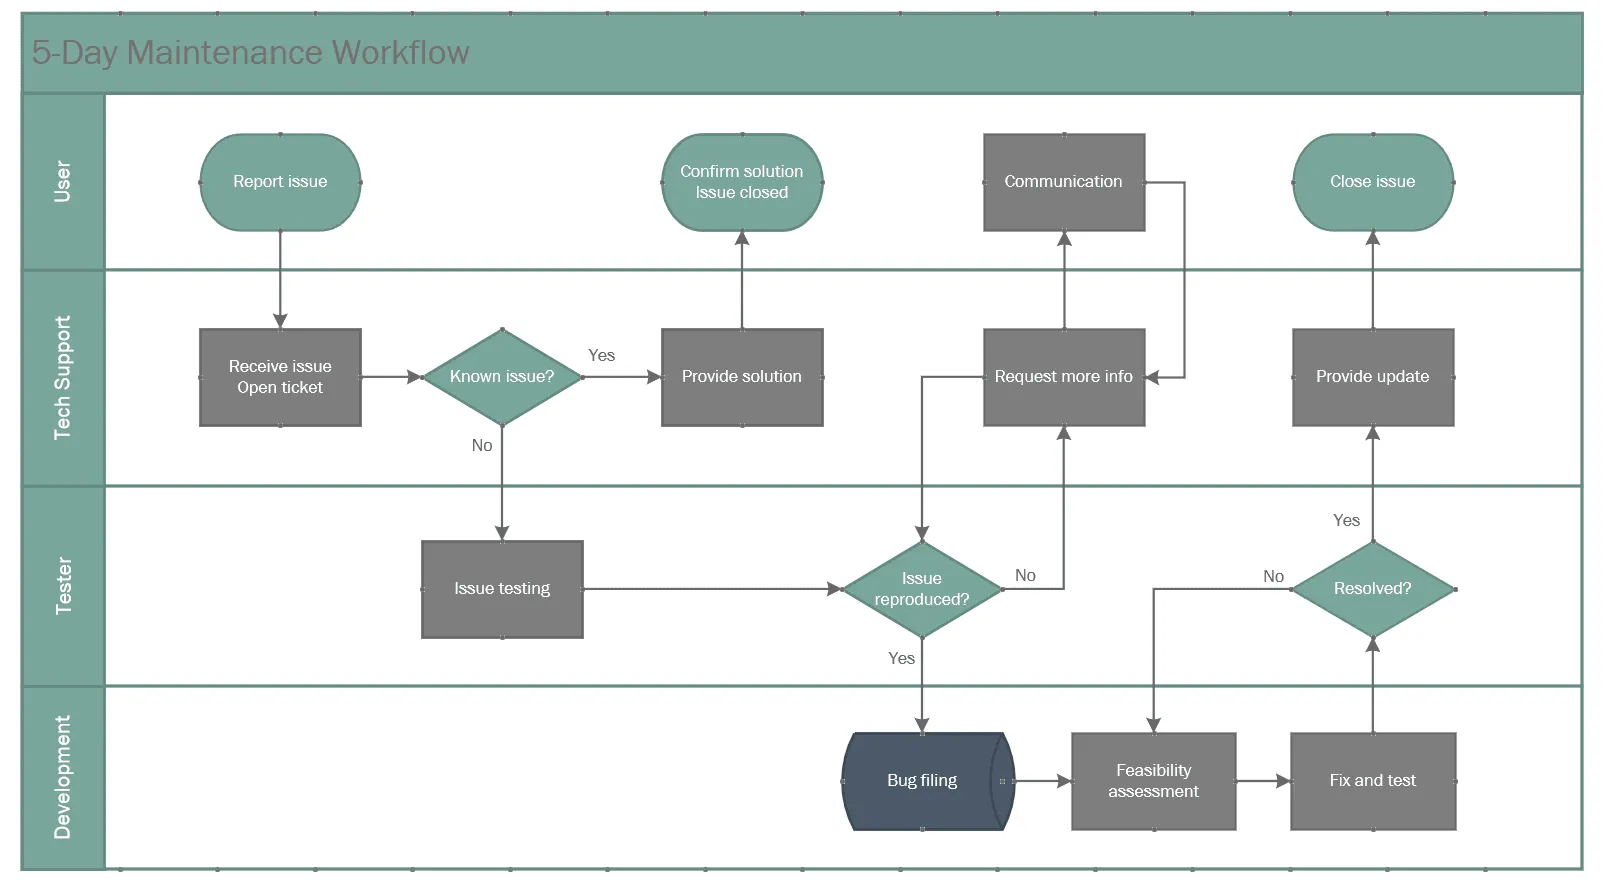
And here is how our swimlane diagram looks after customization:
Download manual Visio swimlane diagram
If you’d like to use the swimlane diagram created in this guide as a template to help you move faster, you can download the file below, free of charge.
Get this free swimlane diagram template
How to automatically create a swimlane diagram in Microsoft PowerPoint
Styling a cross-functional flowchart in Microsoft Visio takes a lot of time and effort in order to make it look sharp and fit for an executive presentation. Plus, if you want to include it in your meeting slides, you need additional steps like saving it as an image and afterwards importing it into PowerPoint.
To improve your efficiency in terms of both time and output quality, we’d like to introduce the Office Timeline add-in for PowerPoint as an alternative. The tool offers a wide library of ready-to-use templates that you can easily customize and update with just a few clicks, saving you considerable time and producing professional process-mapping visuals.
As a bonus, you also get to add a timescale to your cross-functional flowchart when using Office Timeline. This helps you effectively visualize the component items of your entire process flow against specific individual timeframes. The result: professional-looking swimlane diagrams that are easy to follow and simple to make.
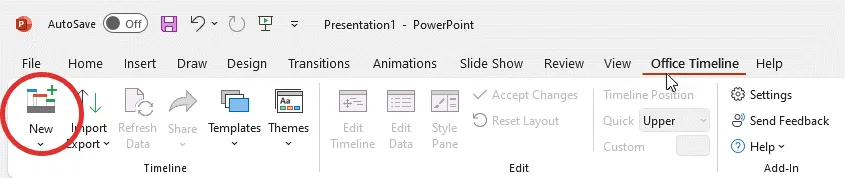
Let’s see the quick steps needed to automatically make swimlane diagrams with the lightweight PowerPoint add-in. First of all, you’ll need to install the free trial of Office Timeline. This will add a new tab to your PowerPoint ribbon.
1. Select a swimlane template and customize it.
a) Open PowerPoint and look for the newly created Office Timeline tab on the ribbon, then click on New.
Clicking on New will open the add-in’s template gallery. Scroll up to its Swimlane Templates section and pick the preferred sample to use as the base structure for your swimlane diagram.
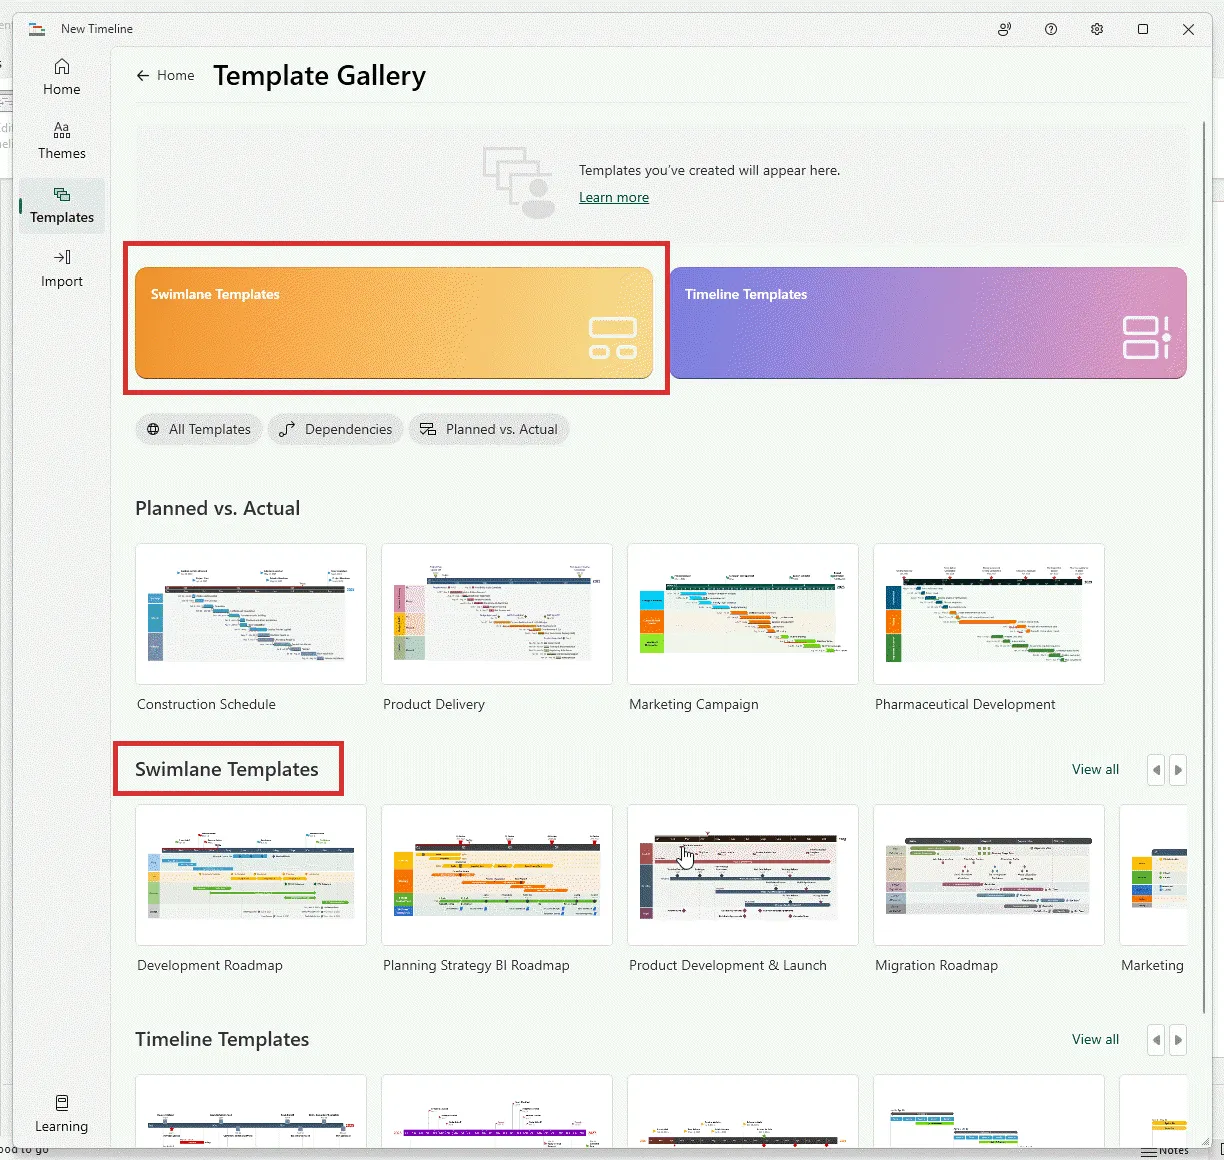
Double-click on the template you like and then select Create timeline in the preview window to open the add-in’s Edit Data wizard.
b) In the Edit Data pane, enter your own data instead of the existing items. There are two ways to do this: either by manually typing the new details in each individual entry (and adding/removing items as necessary) or by copy-pasting it from an Excel file.
c) Now you can also make a few customizations, such as change tasks/milestones shapes and colors.
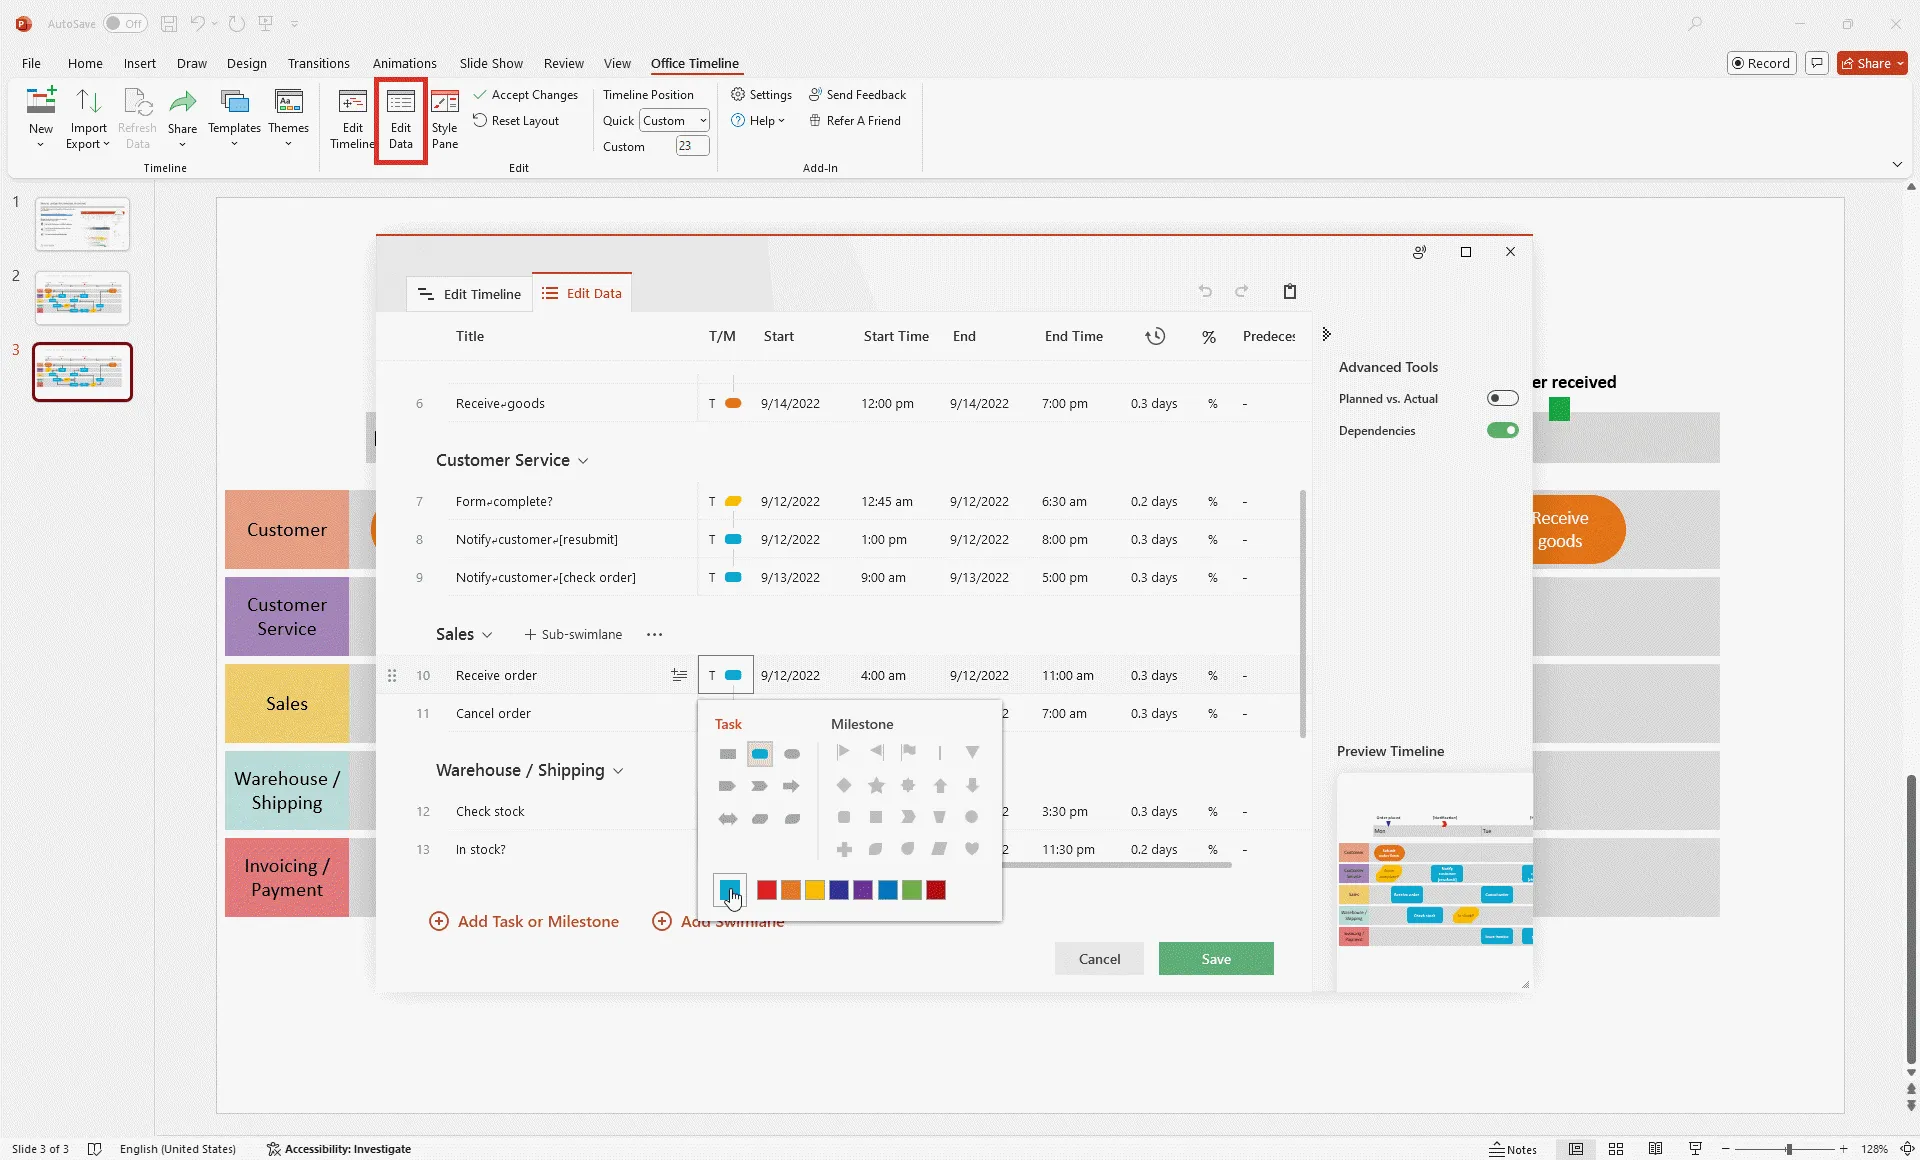
When ready, press the Save button. As a result, a new swimlane diagram will be instantly generated as a PowerPoint slide.
2. Add connectors.
Now that the process steps have been distributed inside their corresponding swimlanes, it’s time to add connectors to indicate the direction of your process flow. To do this, go to Insert > Shapes on the PowerPoint ribbon and choose the type of arrow you prefer. Then, start drawing the arrows as necessary, making sure that you drag and move the arrow ends until the connecting points turn green. This ensures that the connectors stay in place even when you reposition the associated shapes.
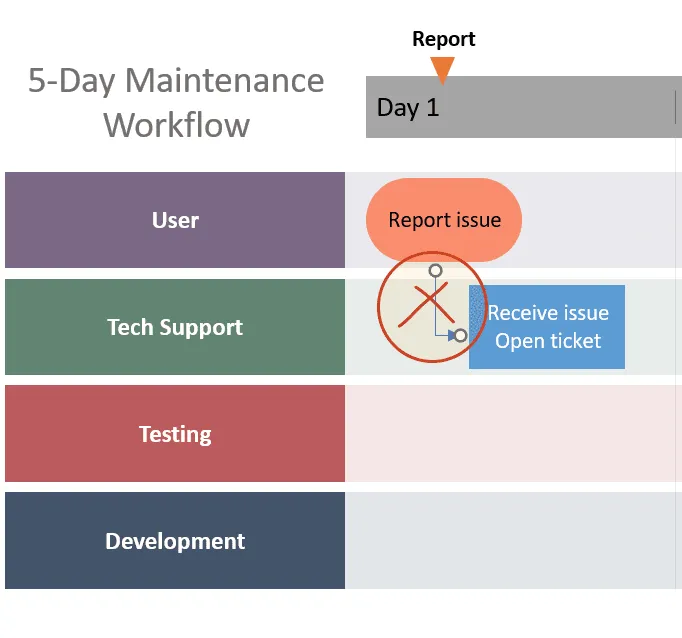
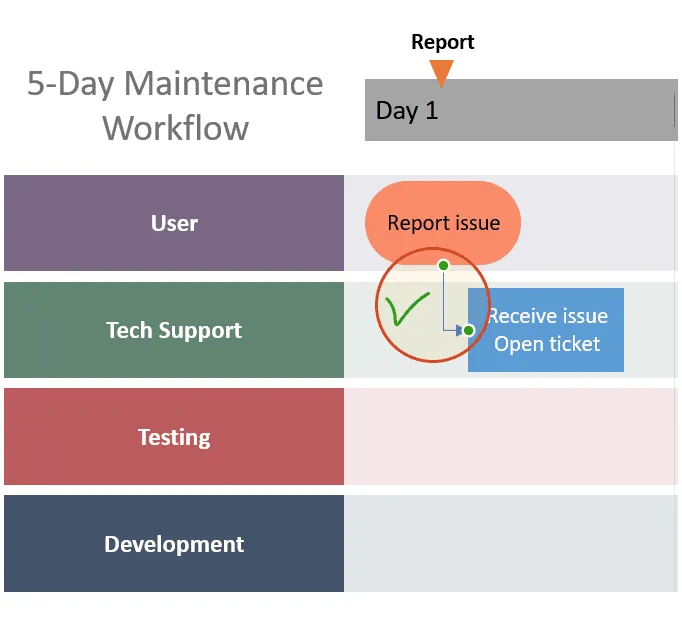
Then, use the PowerPoint controls to add Yes/No or False/True text boxes near the “Decision” shapes to illustrate the possible outcomes of the decision points.
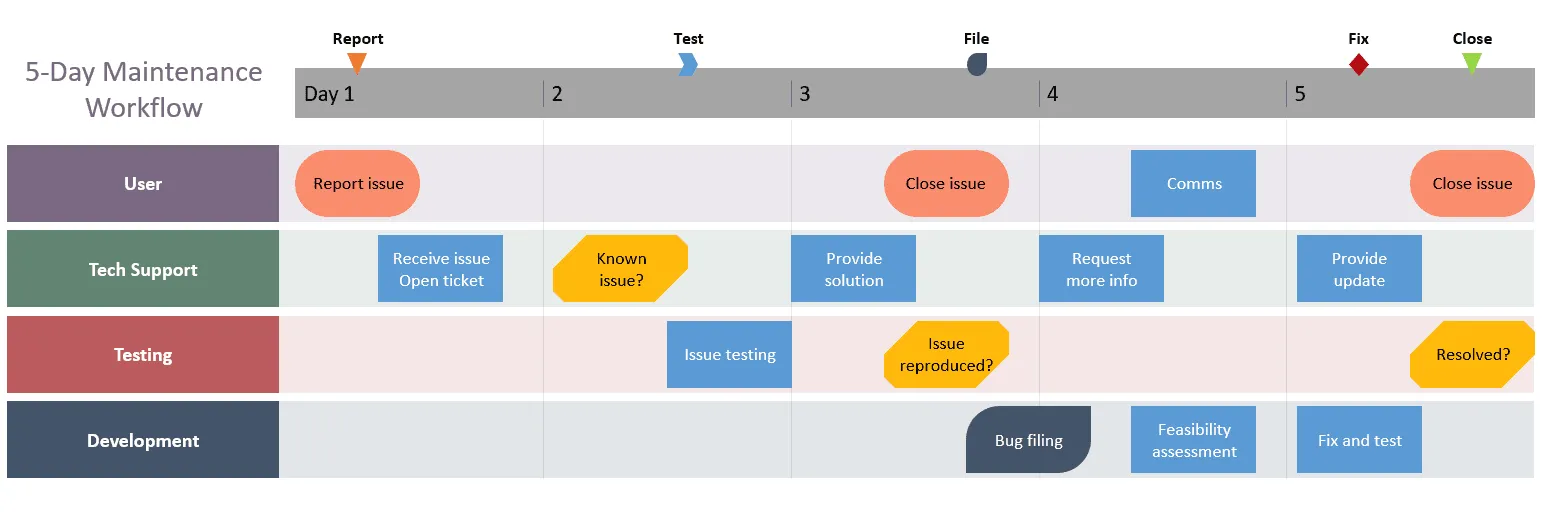
The newly created flowchart can be easily restyled or updated automatically with Office Timeline when your data changes. And here is how our swimlane diagram template looks after some styling and customization:

Download auto-generated PowerPoint swimlane diagram template
If you’d like to use the swimlane diagram created in this guide as a template to help you move faster, you can download the slide below, free of charge.
Get this free swimlane diagram template
FAQ about making swimlane diagrams in Microsoft Visio
Find out below the brief answers to the most frequently asked question on how to make a swimlane diagram with Microsoft Visio:
Here are the steps you need to follow to make a basic swimlane diagram in Microsoft Visio:
- Open Visio and select the type of process flowchart you want to create. For this, double-click on it from the template gallery.
- Define swimlanes. From the Shapes window on the right, add as many bands as you need.
- Label your swimlanes. Double-click on each swimlane label bar to start typing.
- Add process shapes to your swimlanes. Choose the desired process elements from the Basic Flowchart Shapes.
- Add connectors to create a process flow. Click on any of the four arrows (Up/Down – Left/Right) visible on mouseover and draw connectors in the direction of another shape.
Yes, there are three swimlane diagram templates that you can use to create your own cross-functional flowchart in Visio. To access them, go to File > New and click on Cross-Functional Flowchart, which will open a preview window featuring two swimlane styles to choose from (horizontal and vertical swimlanes, respectively). Pick the one you prefer, select the metric units if prompted, and start working on your new swimlane diagram.
To enjoy a larger variety of pre-formatted samples that can be easily customized and turned into unique, professionally-designed process flowcharts, check out our collection of free swimlane diagram templates or simply create your own with just a few clicks using Office Timeline.
