A clearly laid-out swimlane diagram is key to successful process implementation as it helps stakeholders fully grasp the roles and responsibilities involved in completing a given process. Business professionals who want to improve process execution between cross-functional teams can work with Google Sheets to make a swimlane diagram online for quick sharing and enhanced collaboration.
Google’s spreadsheet platform allows users to manually build a basic flowchart by inserting shapes that illustrate process steps into a formatted table. However, this can turn out to be painstaking when trying to map out more complex processes as the amount of editing work required to achieve a reasonable output can be very time-consuming.
Fortunately, creating such visuals online that are both more professionally looking and far less demanding in terms of customization and updating efforts can be easily done with dedicated swimlane diagram makers.
On this page, we will present you both options in detail – first, how to build a cross-functional diagram manually in Google Sheets, and then how to automate the full process using a web-based swimlane diagramming tool called Office Timeline Online.
Which tutorial would you like to see?
How to manually make a swimlane diagram online with Google Sheets
Having no swimlane diagram templates that you can readily customize, Google Sheets only lets you manually build a process flowchart from scratch following the steps below.
1. Enter the main process participants in Google Sheets.
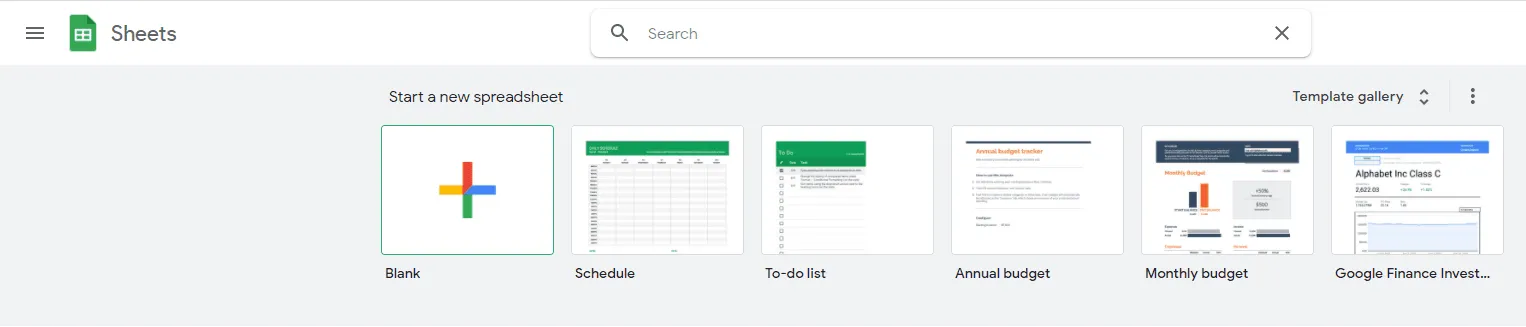
a) Open a new blank spreadsheet in Google Sheets.
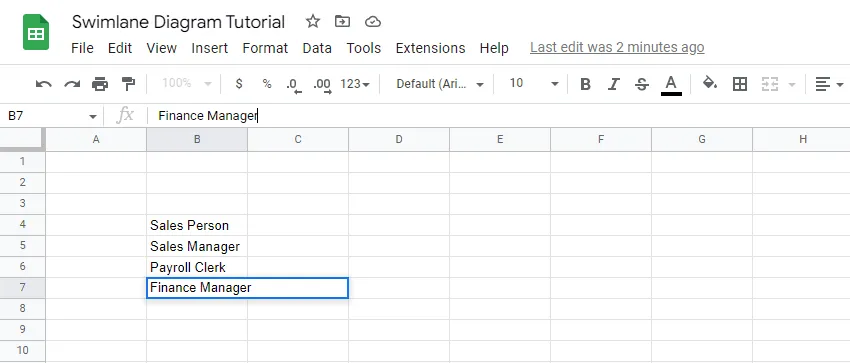
b) In the newly opened spreadsheet, enter the main participants (step owners/teams/departments) of your process in a column. These will act as the labels or titles of the swimlanes you are going to set up later. For the process we intend to illustrate, here is how we listed our major process participants vertically:
2. Set up separate swimlanes for your process participants.
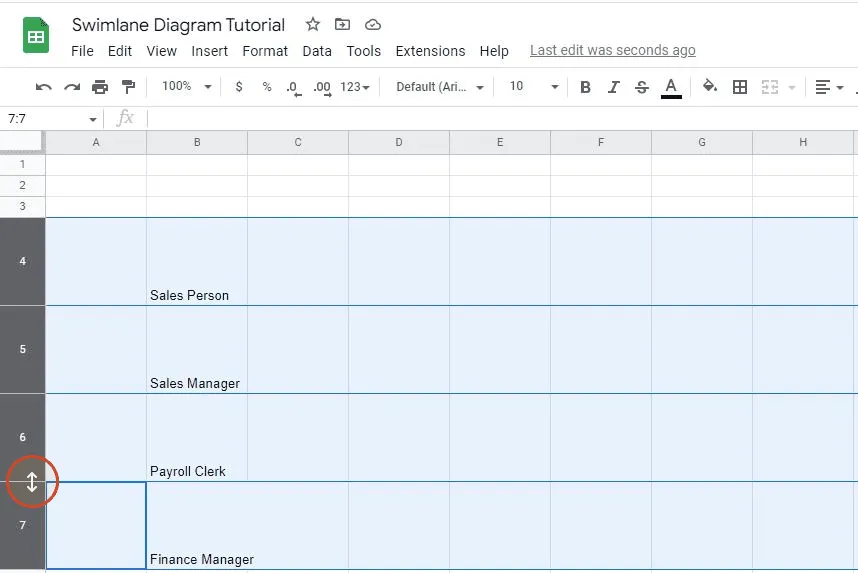
a) Adjust row width – select all your text-populated rows (keep CTRL pressed while clicking on each row’s numeric indicator), and then drag the up-down handle to increase their width as preferred. This will ensure that all the rows of your swimlane diagram will be equally sized.
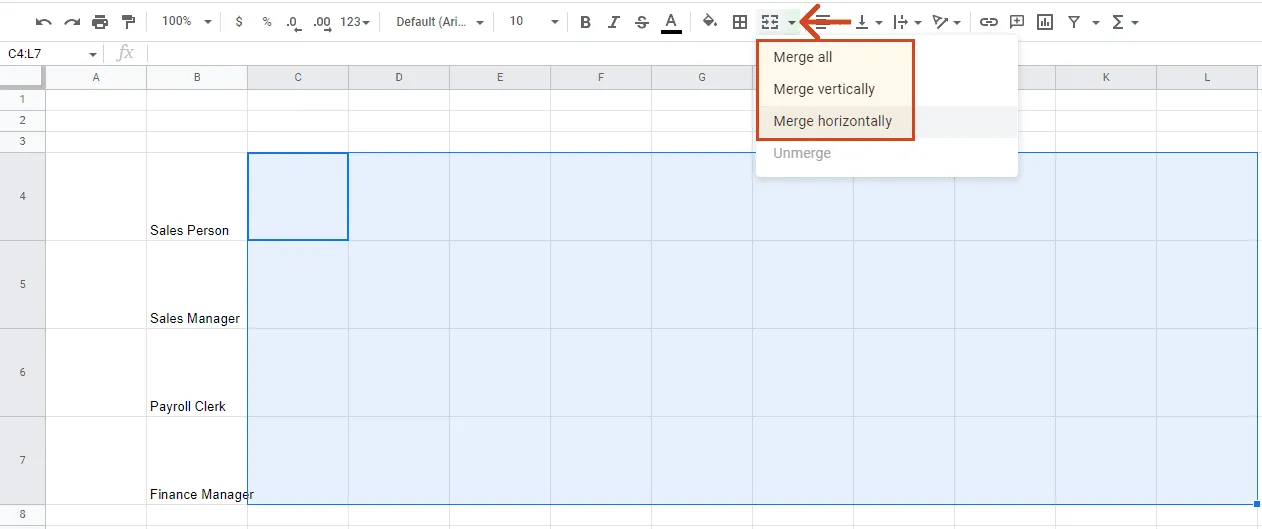
b) Horizontally merge cells for your data rows – select all the row cells you want to be contained within your swimlanes (click on the upper cell on the right of your first swimlane label and then press and hold while dragging the cursor over the rest of the ones you want to include in the graphic), then click on the downward arrow next to the Select merge type icon on the Tool bar and choose Merge horizontally from the menu that subsequently appears.
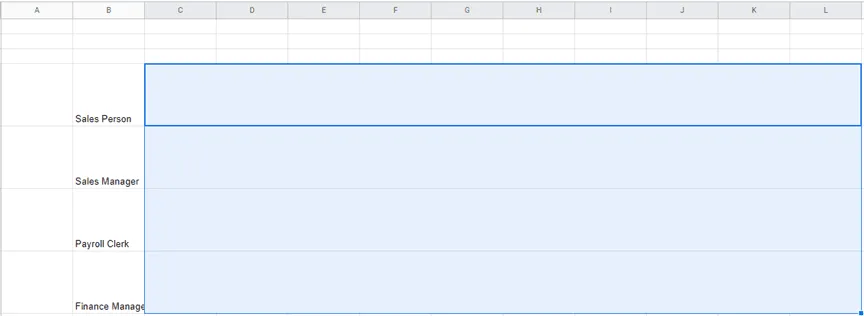
Once you perform the actions above, you will get a formatted area that looks like this:
c) Format swimlane headers (label cells) – at this point, you might also want to make some adjustments to your swimlane title column to improve its general layout. Here are a few formatting suggestions that you can apply to your swimlane label cells, after you select them all:
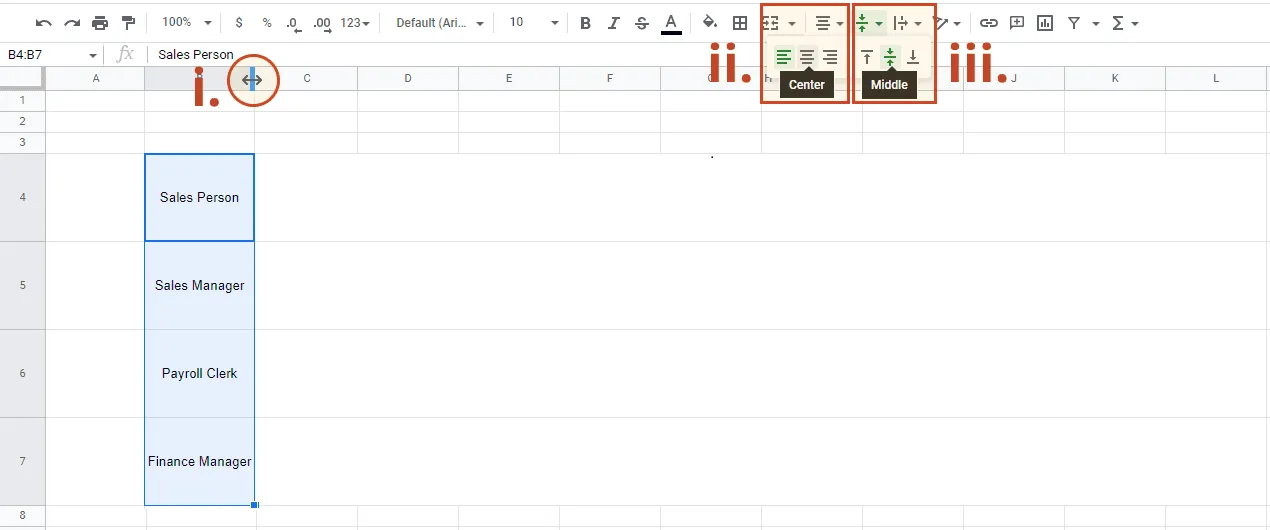
i. Adjust column width to ensure the swimlane labels are fully visible - drag the left-right handle at the margin of the column header to increase column width.
ii. Go to the Horizontal align icon on the Tool bar and select Center to move the text in the middle of the cell horizontally.
iii. Go to the Vertical align icon on the Tool bar and choose Middle to bring the text at the center of the cell vertically.
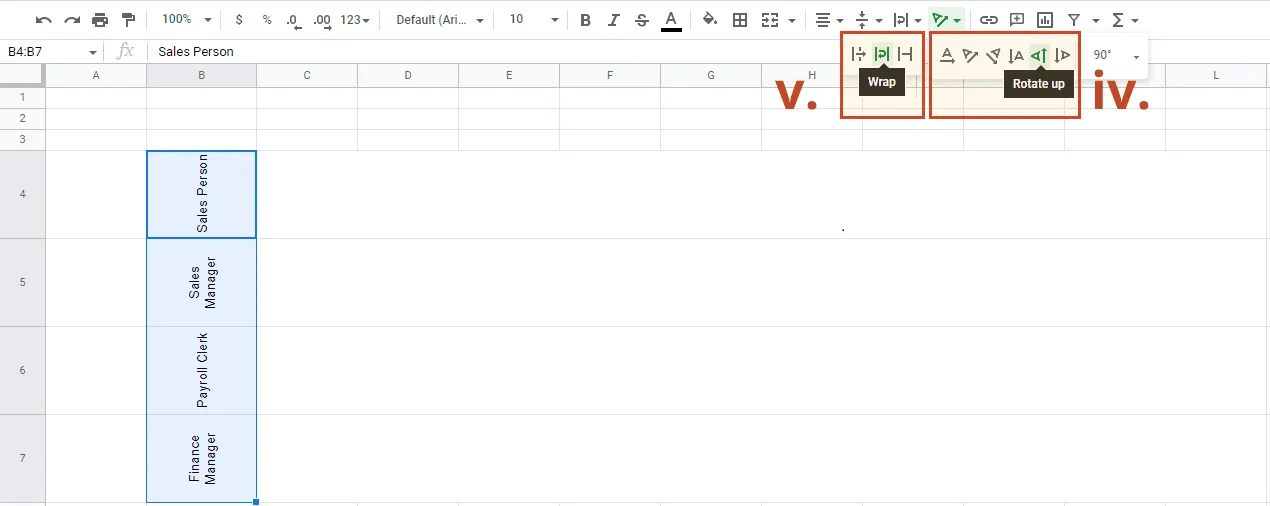
iv. Change text orientation (optional) – if you want to display your swimlane titles vertically, then go to the Text rotation icon on the Tool bar and choose the Rotate up option.
v. Wrap swimlane title text (optional) – should you re-orient your swimlane label text vertically (as explained above), you may also want to have it wrapped up so that it optimally fits to cell width. Thus, longer titles will be arranged on two lines, if necessary. To do this, select the Wrap option from the menu that appears after you click on Text wrapping from the Tool bar.
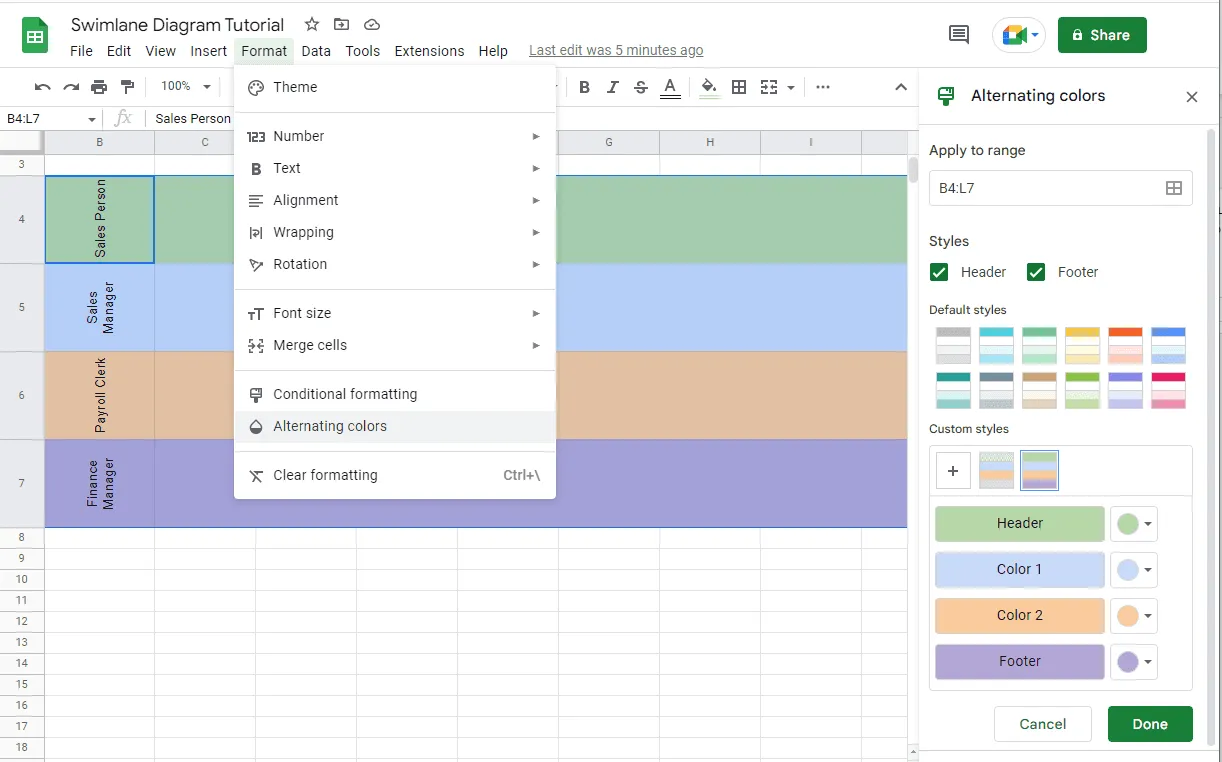
d) Apply alternating colors to your swimlanes for better demarcation – as a last step in setting up your individual swimlanes, we recommend that you color them in different tints to clearly delimit their boundaries. To do this, you first need to select all swimlanes (header section included), then go to the Format tab, and click on Alternating colors from the menu that shows up.
Next, a task pane will appear on the right side of your spreadsheet. Here is where you decide what color scheme you want to apply to your swimlane framework. You can either opt for one of the standard suggestions in the Default styles section or create your own color palette using the controls under Custom styles. When finished, click Done to save your choices.
In our case, we wanted to distinctly highlight each swimlane with a separate color and, thus, went for the latter option. Here is how our custom chromatic style looks like:
3. Build your flowchart.
Now that your swimlanes are ready, you can start mapping out the steps as assigned to their owner and show how these are connected to define your process flow. To visually represent this type of data, we will be using Google Sheets’ Shapes and drawing functions. Here is what you need to do:
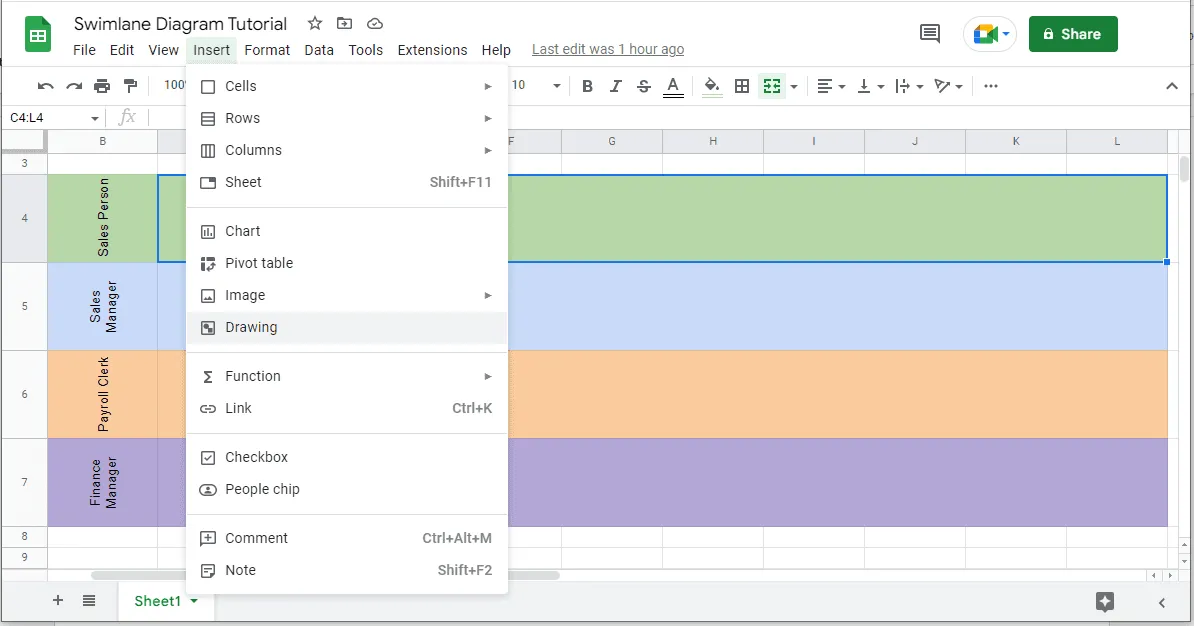
a) Select the swimlane that you want to populate, and then go to Insert → Drawing. This will open a separate dialog box where you need to perform the actions below.
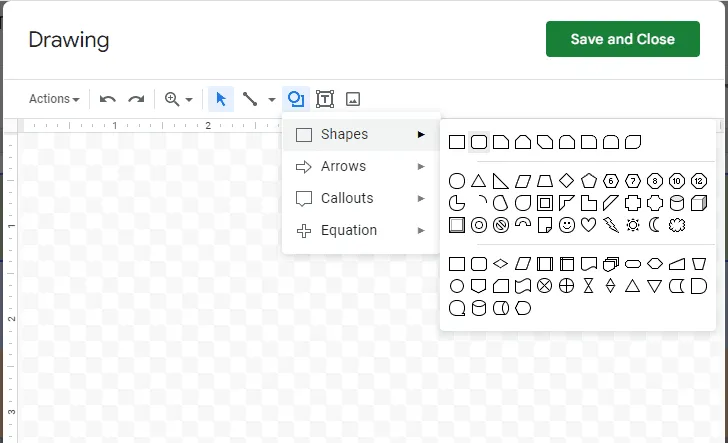
b) Select the type of shape you want to include in your swimlane from the option sub-menu that appears once you click on the Shapes icon from the top bar of the Drawing dialog box.
When choosing your shapes, you may want to observe the standard conventions in place, according to which rounded rectangles are used for the start/end points of the process, rectangles for process steps, diamonds for decisions, etc. In our example, we went for a rounded rectangle to mark the beginning of our process.
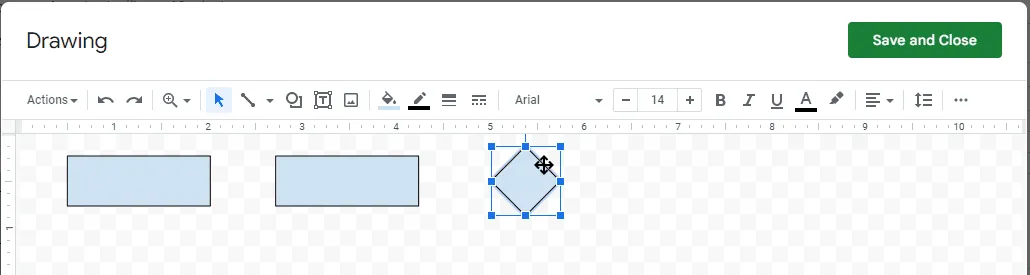
c) Draw the selected shape by placing the cursor in the intended position within the drawing area, dragging it to outline the shape and then releasing it to have the new object inserted.
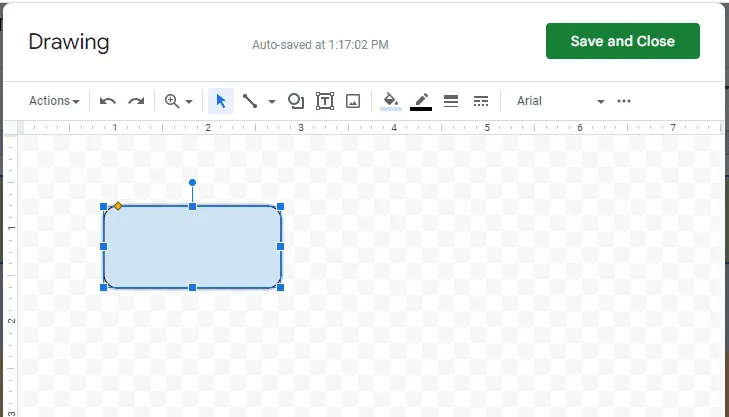
Repeat steps a. to c. above as many times as necessary until you’ve visually represented all items assigned to any selected swimlane owner. To simplify the drawing process, you can copy and paste an already drawn shape to illustrate steps of the same type. When ready, click Save and Close to insert the newly drawn objects into their corresponding horizontal band and to return to your spreadsheet. Don’t worry if the initial draft of your flowchart looks a bit in disarray, as the size, color and position of each object can be later adjusted (see next step).
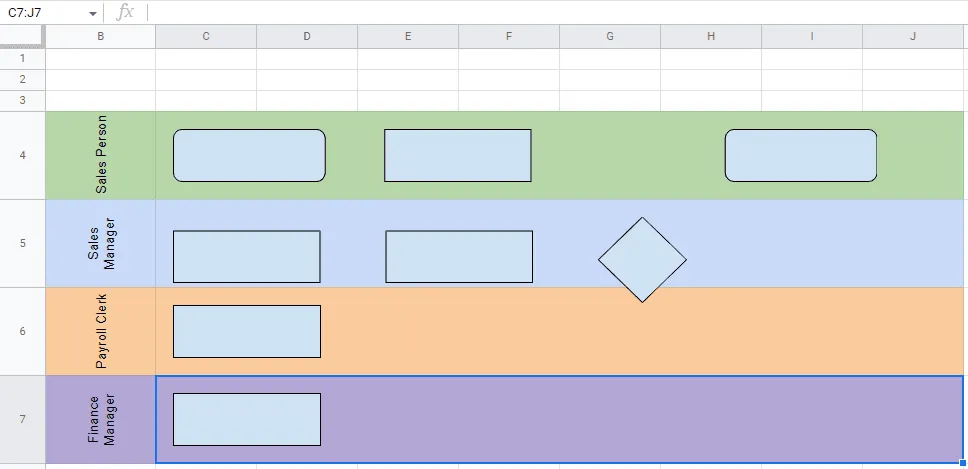
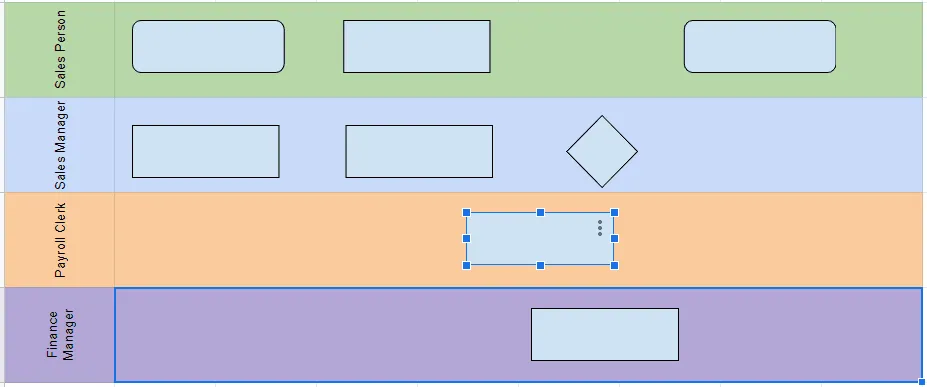
Here is how our basic swimlane diagram looks so far:
d) Adjust the size, position, and color of the swimlane-associated shapes to improve the layout of your flowchart. First, you may want to increase the width of your swimlane rows to maximize space.
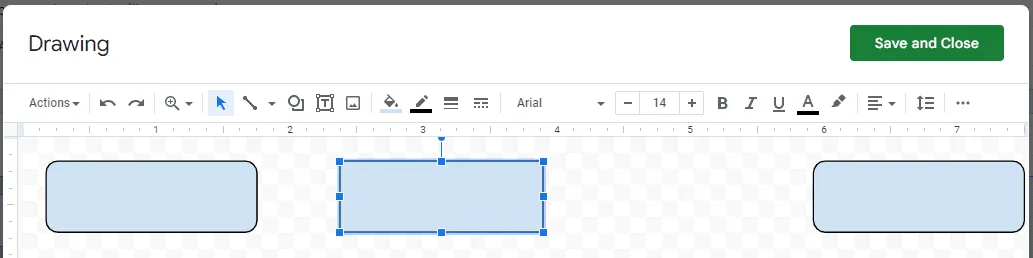
i. Changing shape size – re-open the Drawing dialog box by double-clicking on any of the swimlane shapes. Here, you need to select the object you want to modify, then drag any of the solid handle squares at the corners of the object to resize it to the desired extent. Remember to click Save and Close in order to have your changes kept and your swimlane diagram updated.
ii. Changing shape position – to reposition a swimlane shape, you have two options. For an item inserted along with others in the same drawing session, you need to select the intended shape while pressing and holding the cursor, then drag and drop it into the new position inside the Drawing dialog box. When the shape is drawn and inserted separately from other objects, then you can reposition it through drag & drop directly from the formatted area of your spreadsheet.
Take, for instance, the three shapes in our Sales Manager’s swimlane – we drew all of them in a single act, opening the Drawing dialog box only once. To reposition the diamond shape will thus require us to follow the first course of action.
However, the rectangles from both Payroll Clerk and Finance Manager swimlanes, which have been inserted separately, in distinct drawing instances, can be repositioned straight from the formatted area of our spreadsheet.
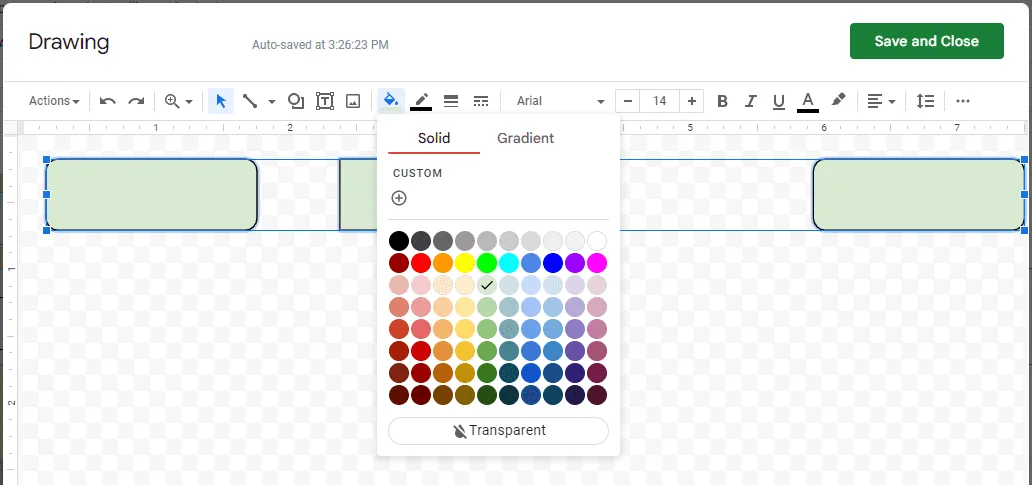
iii. Change shape color – to recolor any flowchart shape individually, re-open the Drawing dialog box, double-click on the intended item and use the Fill color menu from the top toolbar to choose a new shade. You can also apply the same color to multiple shapes at once, just make sure you select all of them first (CTRL + click). In our case, we decided to recolor all the constituent shapes of a swimlane with a tint similar to that of its header.
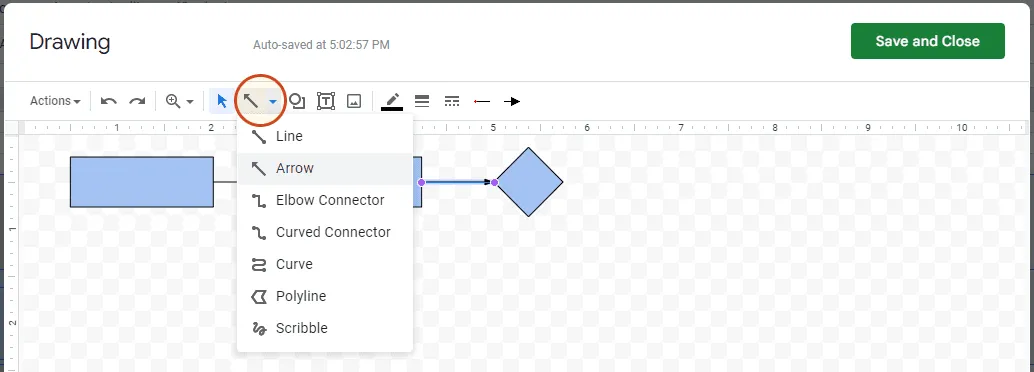
e) Insert connectors (arrows) to outline the direction of your process flow – double-click on any swimlane step sequence to open the Drawing dialog box, go to Select line on the top toolbar and choose Arrow from the menu that shows up. Then, draw an arrow from one shape to another and make sure the connecting points become colored, so that the connectors stick to the shapes when you move them around.
4. Format your swimlane diagram.
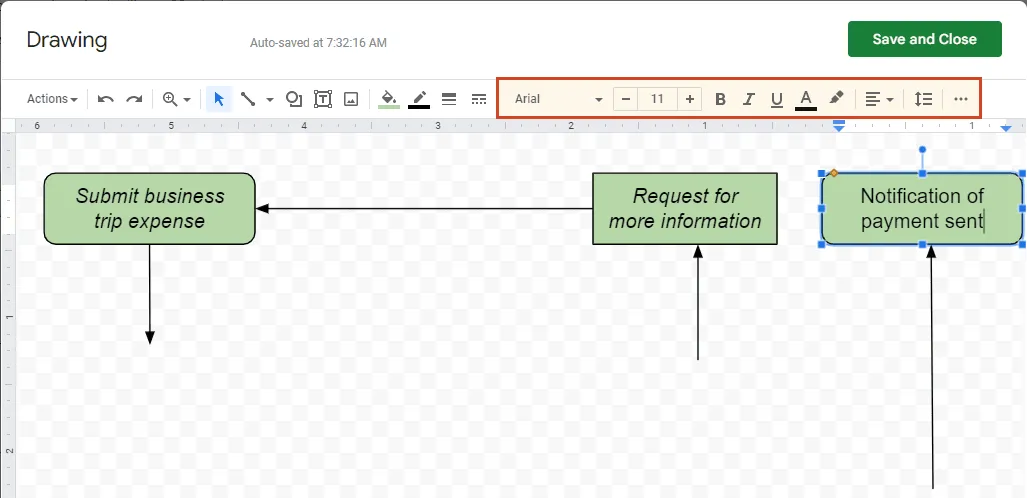
With the primary framework of your flowchart laid out, you can now proceed to including a few extra elements to make it more explicit and comprehensible. What you need to do in this respect is to add descriptions to the swimlane shapes to describe what each associated process step is about. Here is how you can label your flowchart items:
a) Double-click on any swimlane shape to open the Drawing dialog box.
b) In the Drawing dialog box, double-click once more on any flowchart shape and start typing the content of your description. Once you’ve entered your text, you can then easily customize its font, size, position, and color using the corresponding editing options from the toolbar at the top of the Drawing dialog box. Just make sure to select the description first (CTRL + A).
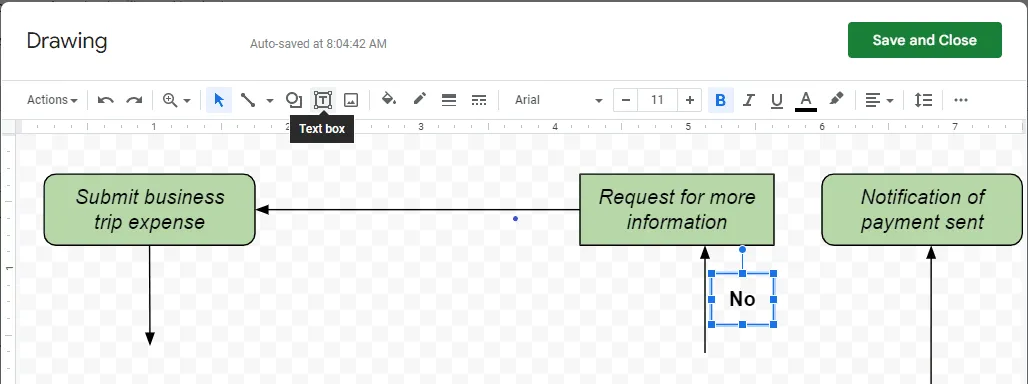
c) Add text details to flowchart shapes – next to the diamond shape (which represents a decisional step and requires a Yes/No or True/False type of response), you will need to indicate the possible paths that the process can take. This is done by adding text boxes in the vicinity of the corresponding connectors to provide the answer to the dual scenario raised by the diamond-shaped step. To insert a text box, open the Drawing dialog box, click on the boxed T icon on the top toolbar, drag the cursor within the drawing area to outline the box, and then release it to finalize the process. Similar to Step 4.b. above, double-click on the newly added object to enter your text and use the style options to customize the font type, size, color, and alignment of your text.
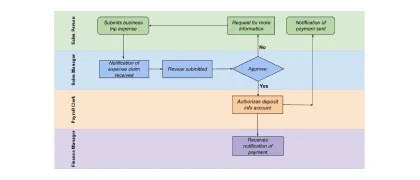
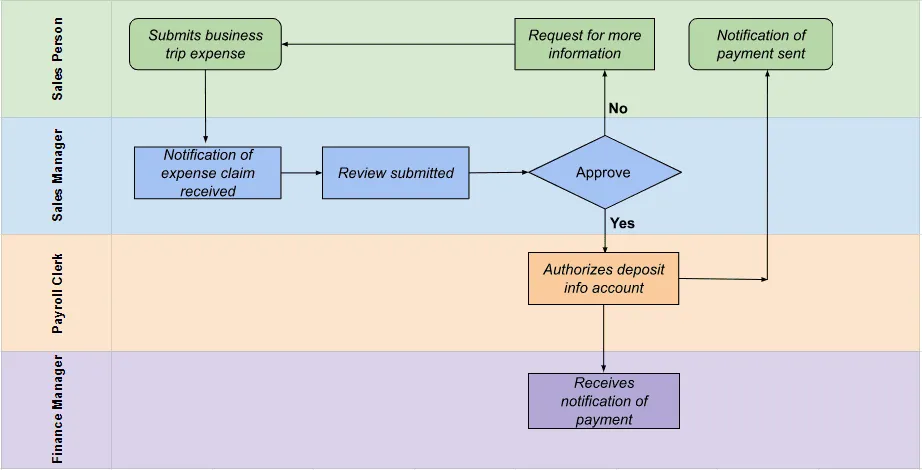
After conducting all the steps above and a few other overall edits (row width increased, text formatting for the swimlane headers and new color choices), here is how our final Google Sheets swimlane diagram looks like:
How to automatically make a swimlane diagram online with Office Timeline Online
As demonstrated earlier, manually creating a swimlane diagram online in Google Sheets can be done, but the formatting work involved is a challenge, especially if you need to frequently update your graphic or build more complex ones. Upon performing the step-by-step instructions of the tutorial above, users can agree that the lack of flexibility in properly editing and positioning individual flowchart items in Google Sheets calls for a better alternative.
If you want to make swimlane diagrams online more easily and with better results, you can do so using a specialized swimlane diagram maker such as Office Timeline Online.
Taking advantage of this web app’s intuitive interface and diverse range of customization options, you can automatically turn your data into professional, high-level visuals that can be quickly updated, shared, or downloaded as PowerPoint slides.
Jumpstart the process by accessing the free online tool and following the steps below. For advanced features like downloading or exporting your timeline, you will need the premium version of Office Timeline Online.
1. Select and edit a swimlane diagram template in Office Timeline Online.
a) Once inside the app, you can either click on Timeline from scratch from the web tool’s New tab or choose one of its templates to begin creating your swimlane diagram. In our case, we decided to work with a template to show you how swiftly your visual comes to life using this time-saving feature.
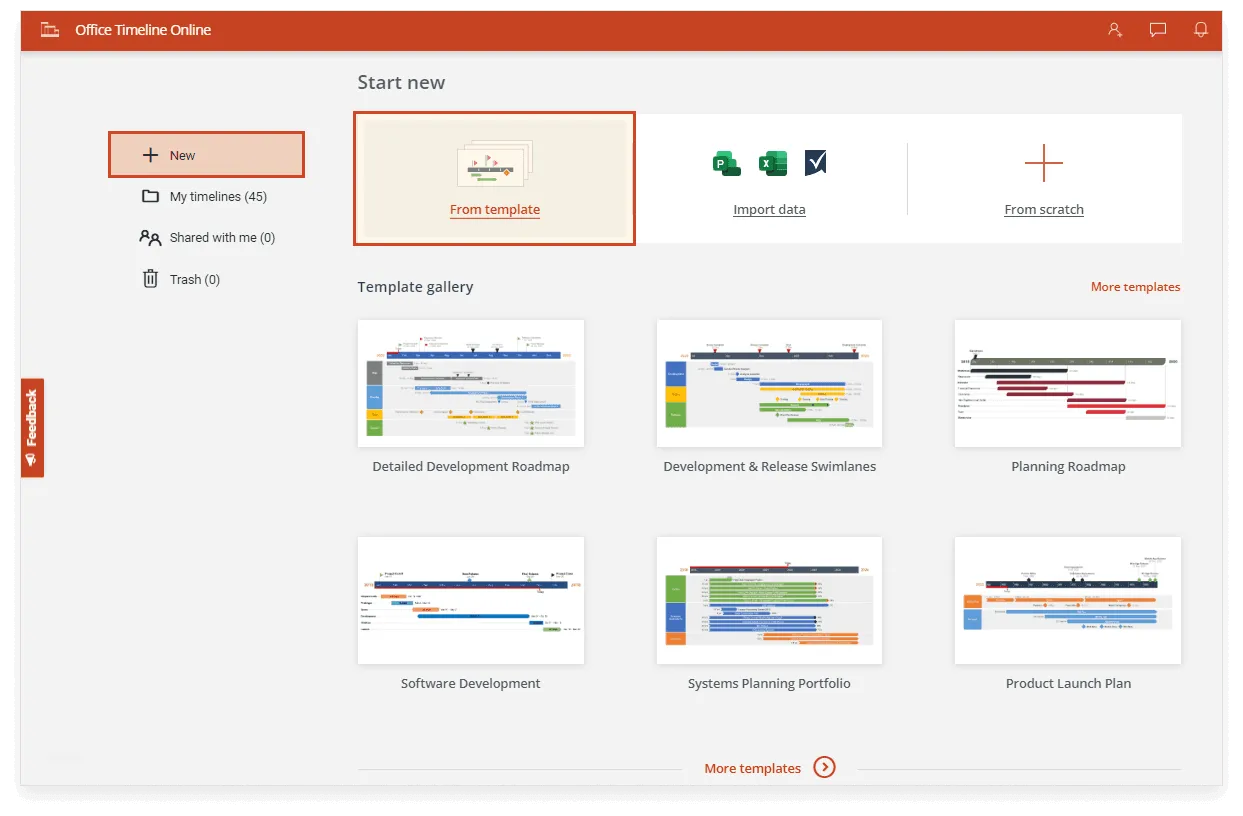
Clicking the From template button will take you to a separate view, where you can get access to the app’s full gallery of templates grouped by categories. Select the Swimlane section from the left-side navigation menu to bring up its related pre-built samples.
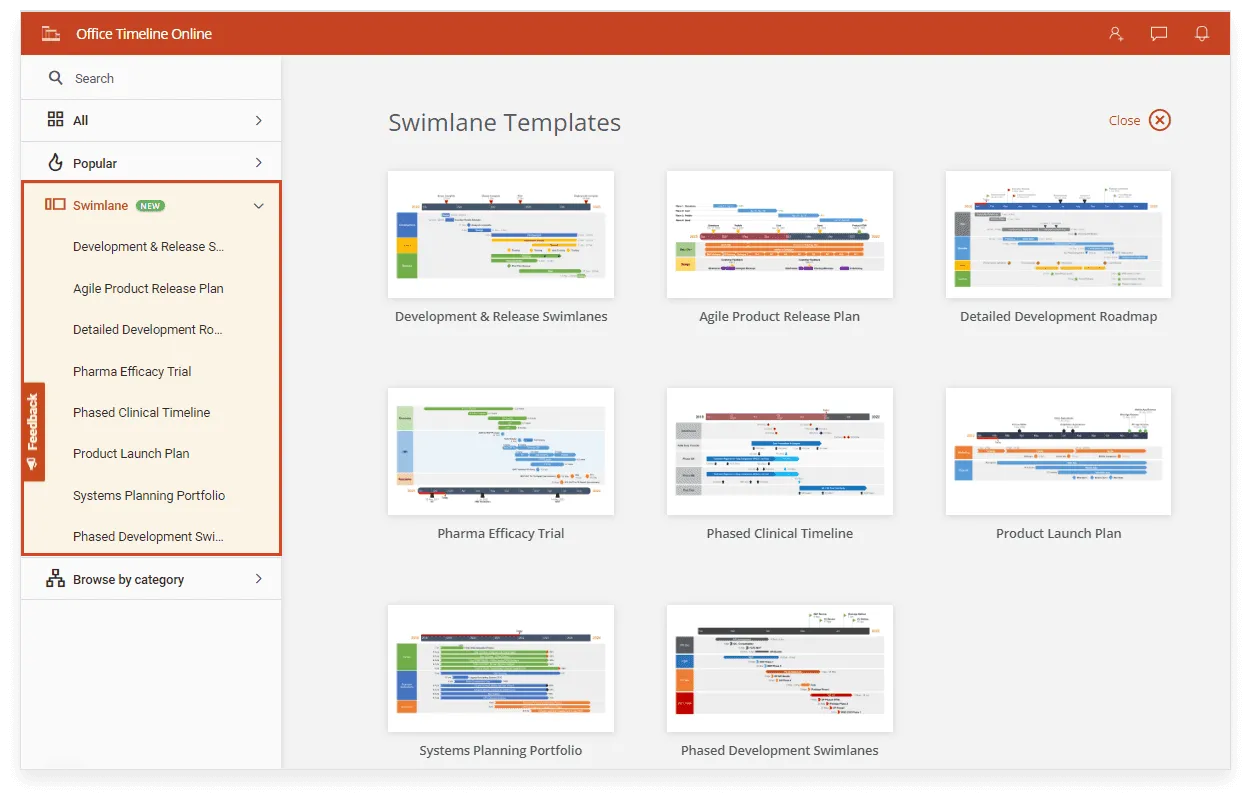
Select the template you like by double-clicking on it, then click on the Use button in the preview window. This will open the Data Entry wizard. For our swimlane diagram, we chose to work with the Phased Development Swimlanes template.
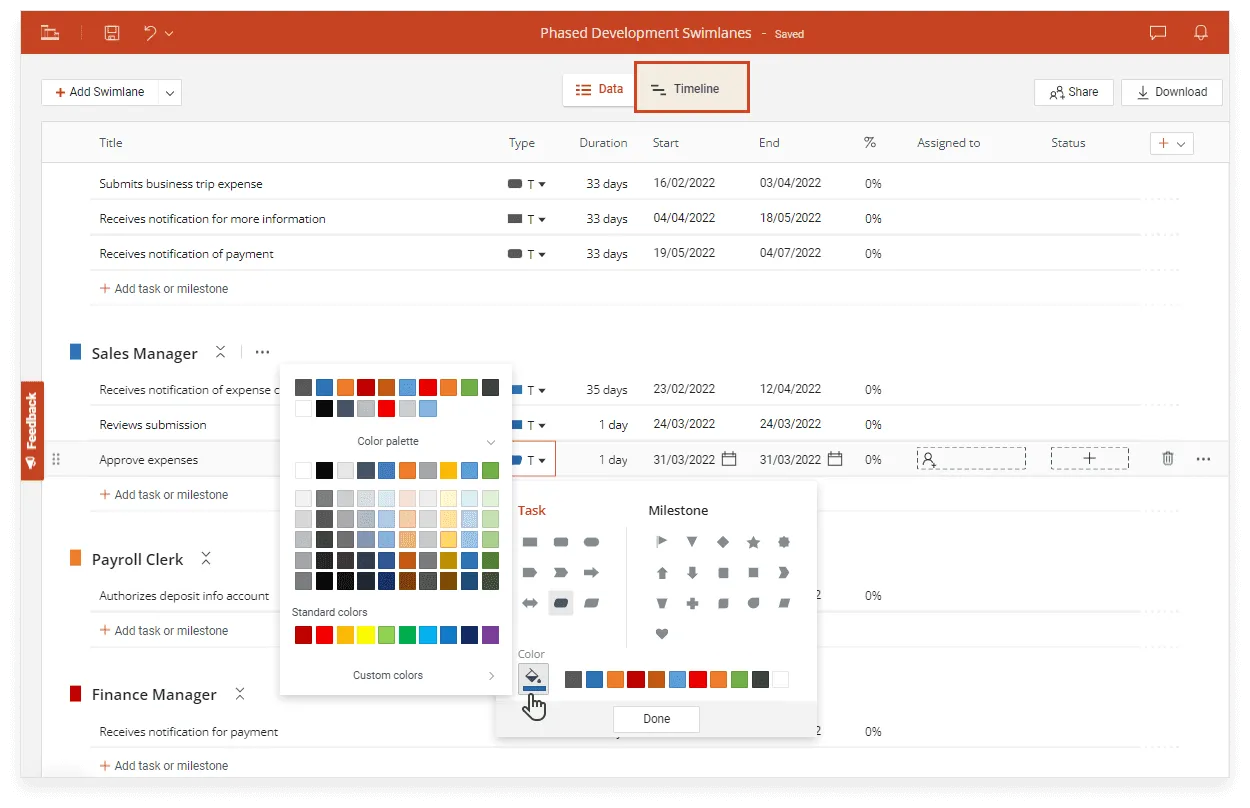
b) Inside Data View, replace the placeholder elements with your own after double-clicking on any of the existing entries and typing in your text. Now it is a suitable time to also make a few preliminary style choices, such as selecting the shape and color for each of the added items. Once ready, go to the Timeline View by clicking on the Timeline tab above the data list.
2. Customize and update your swimlane diagram with ease.
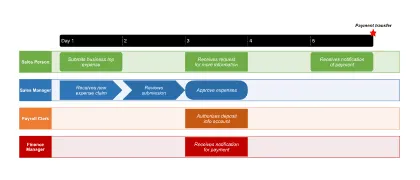
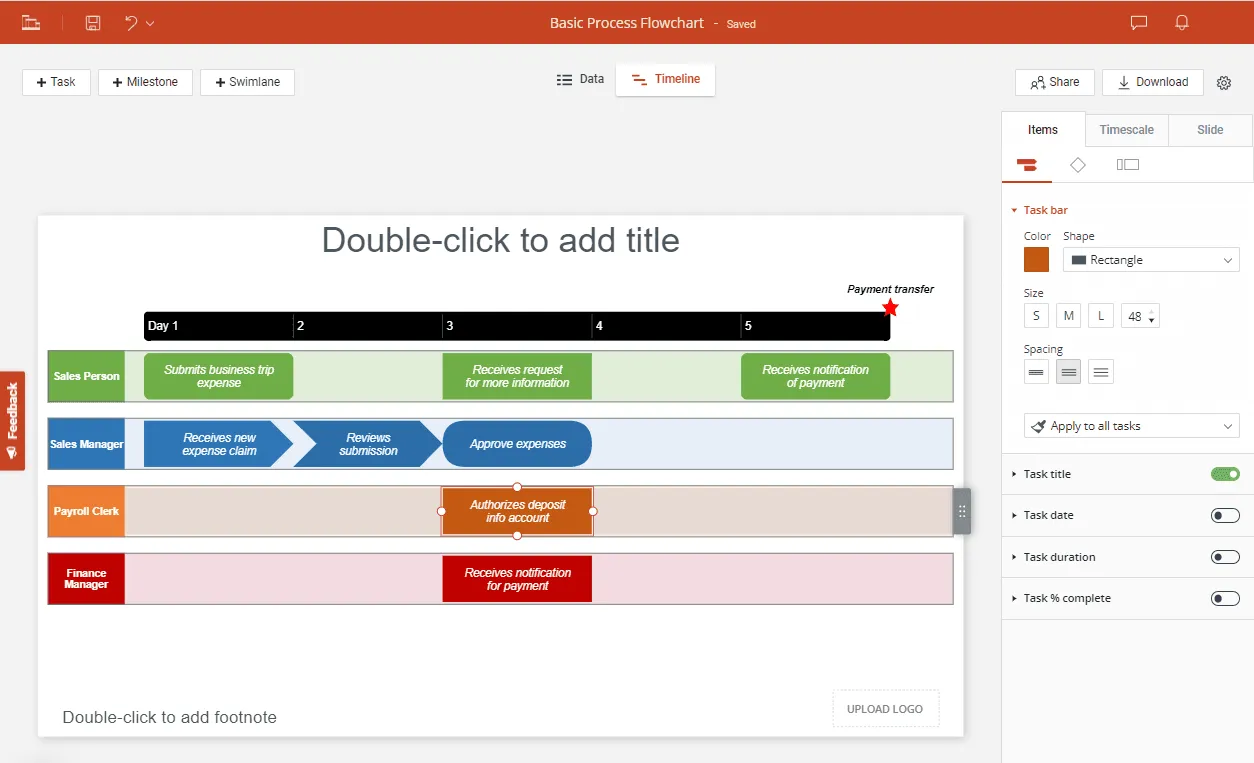
a) Automatically generated in mere seconds, your new swimlane diagram can be further customized with just a few clicks. You can see that your visual includes a horizontal timescale along its swimlanes, which helps in clearly highlighting the logical sequence of your process steps over a set period of time.
Use the flexible drag&drop functionality and feature-packed Style Pane from the Timeline View to edit your swimlane-associated objects, timescale, or the entire slide. For example, you can update any shapes, colors, and fonts, adjust the position and spacing of your flowchart items, or change the units used for the timescale. To add more tasks or even milestones to your process-mapping visual, simply switch back to Data View and enter their details.
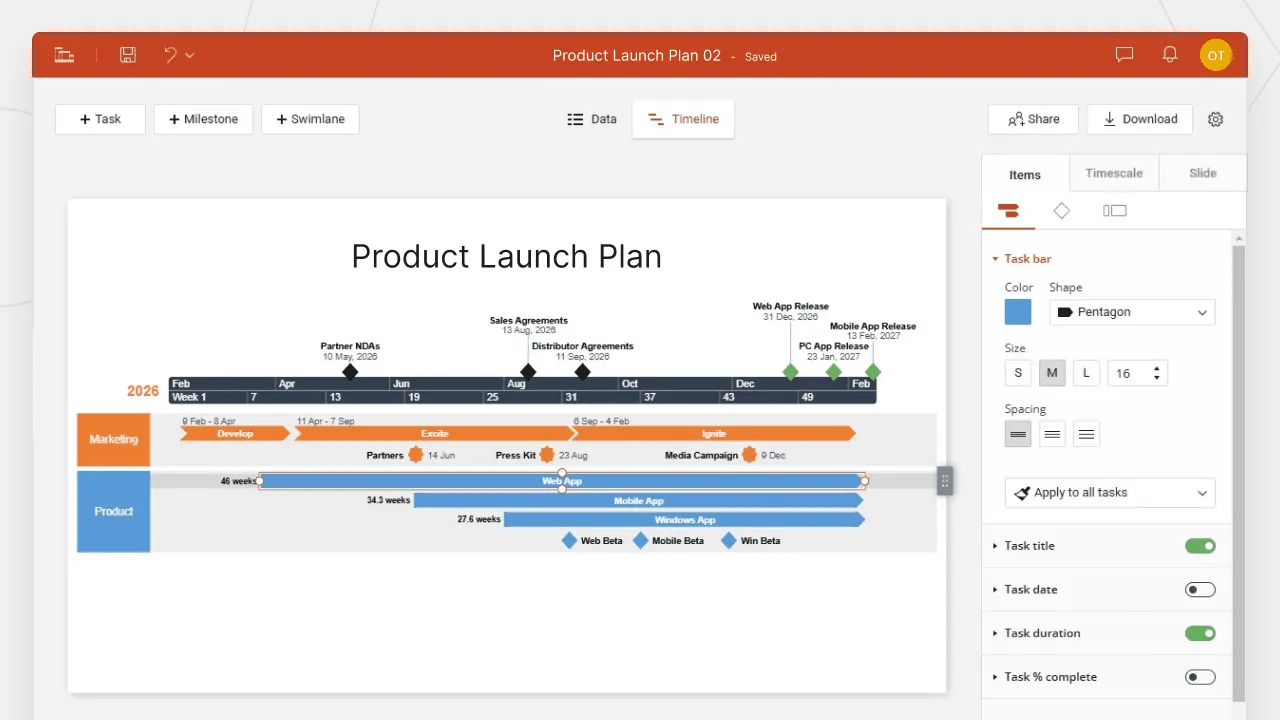
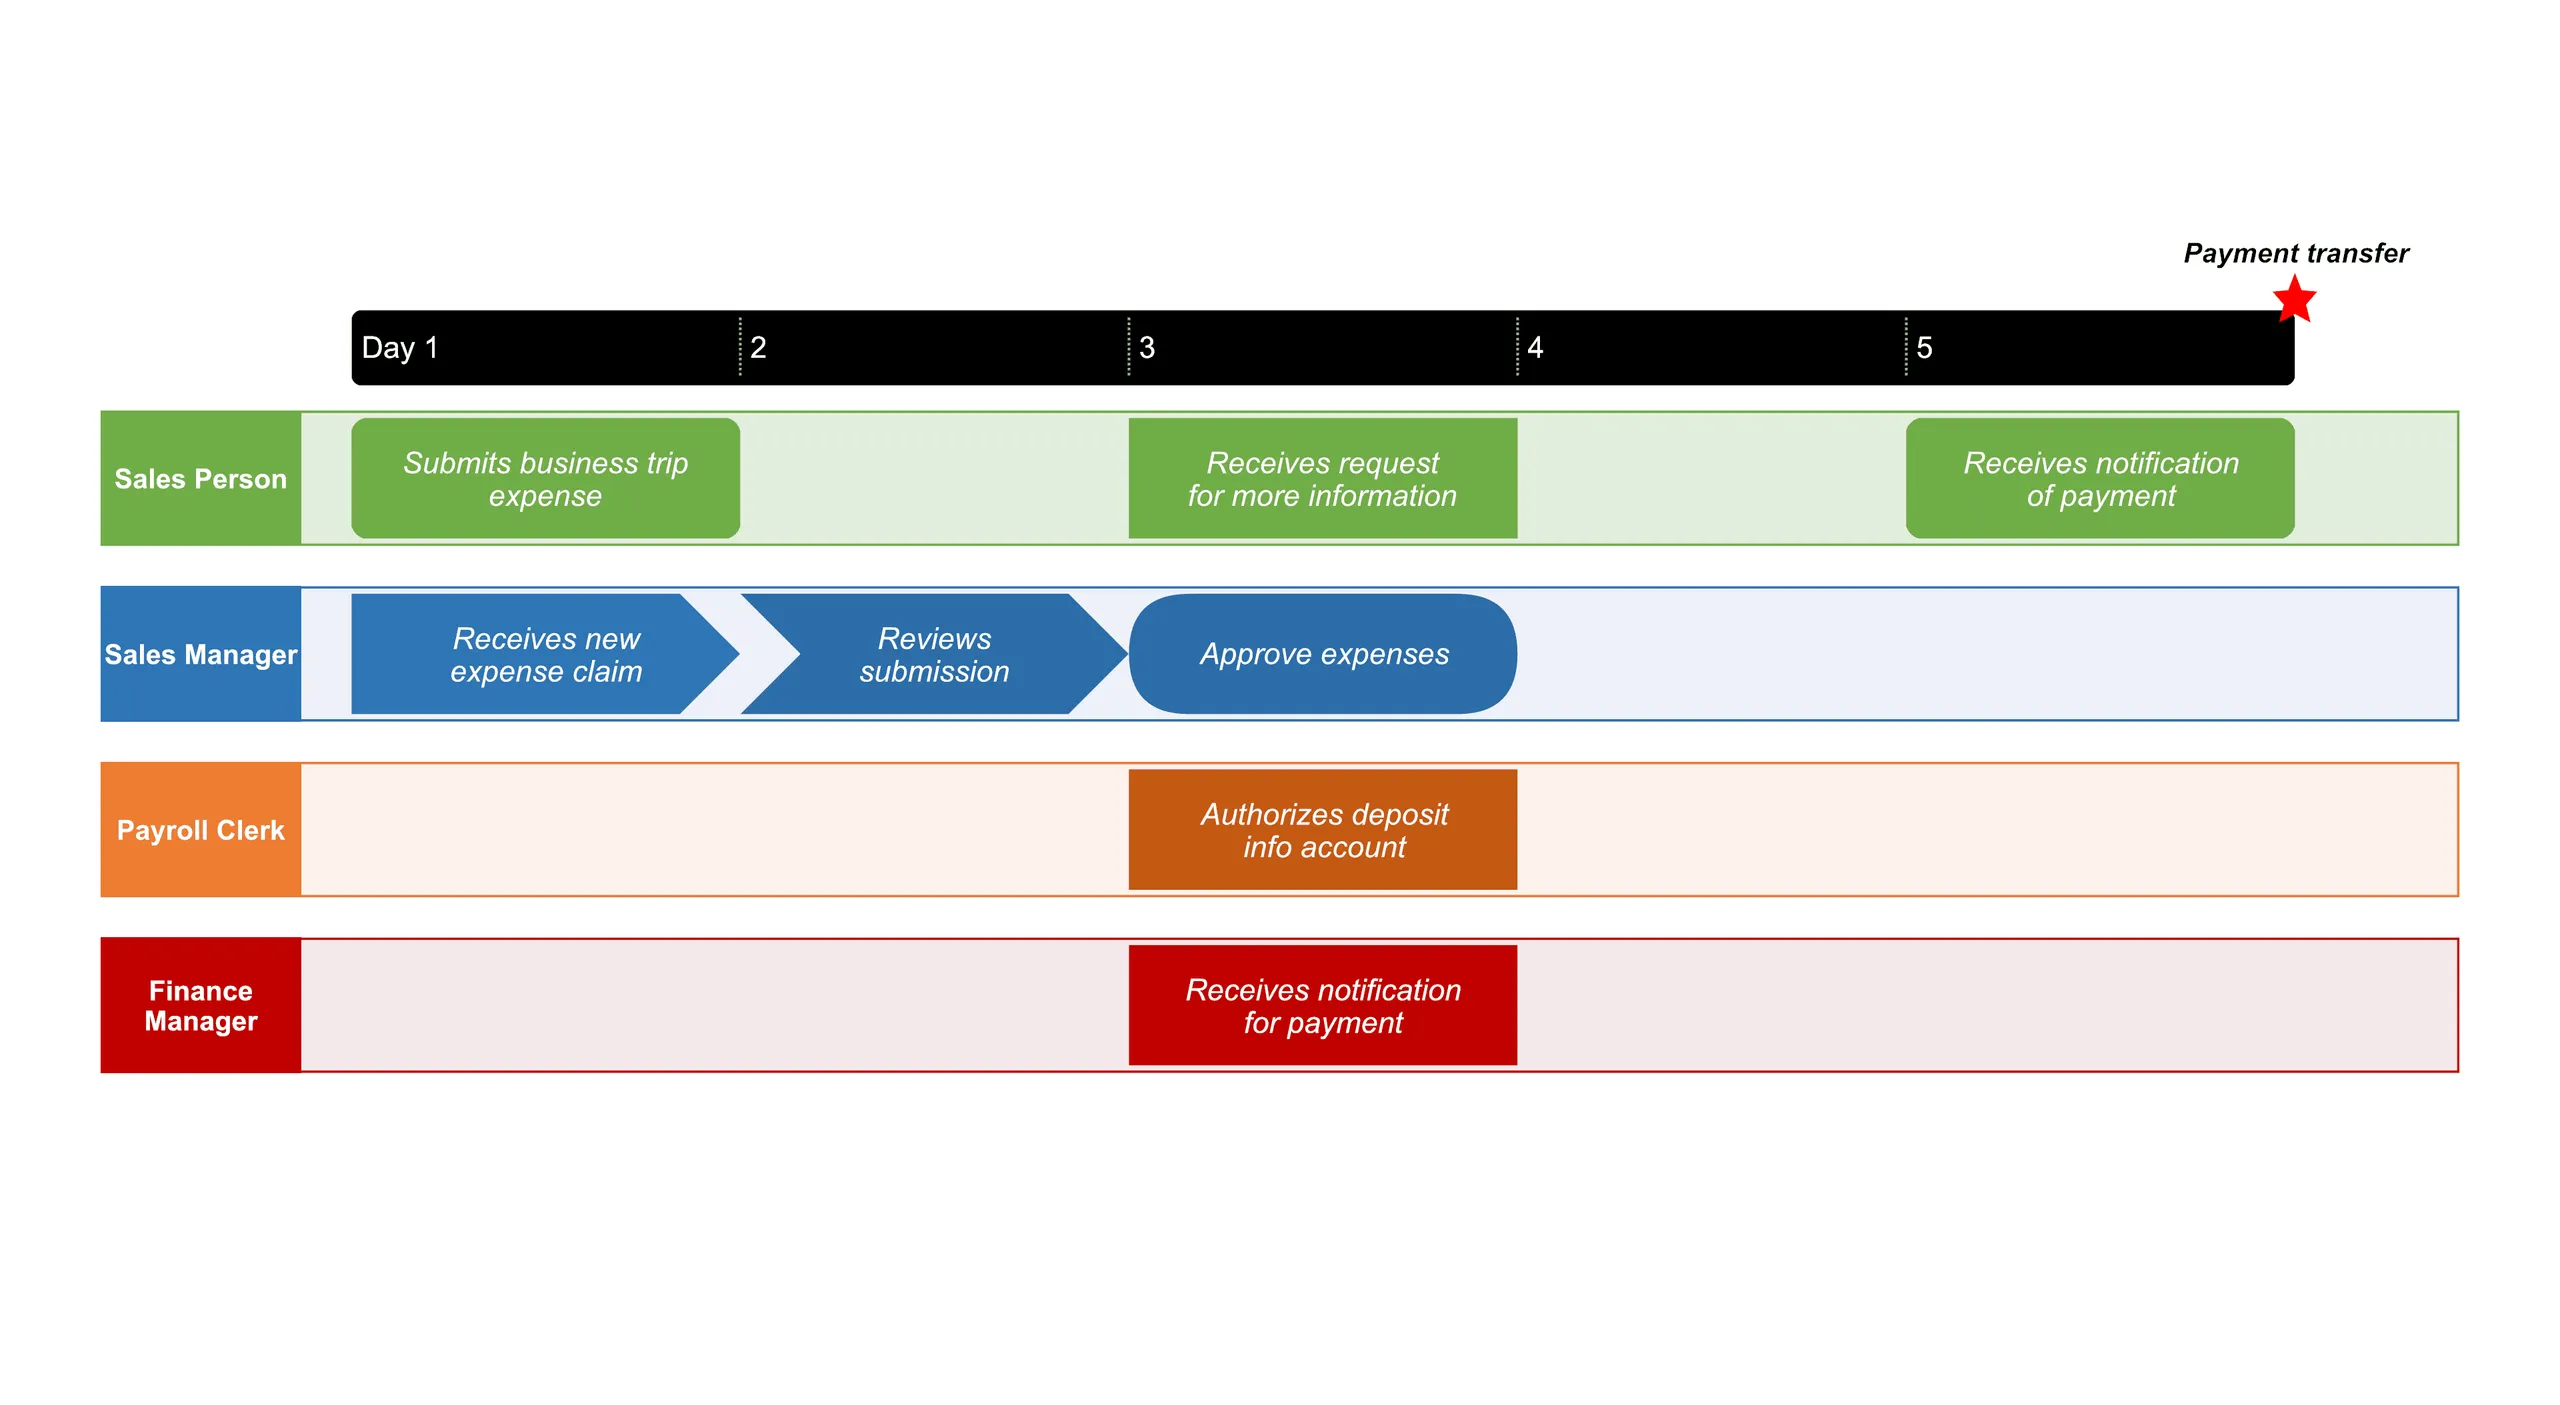
Here is how our final auto-generated swimlane diagram looks like after some customization and styling:
b) With a free Office Timeline Online account, you can instantly save your swimlane diagrams in the cloud and access them for further adjustments whenever changes occur in your process flow. Easily add and edit new items in the Data View or even directly from the Timeline View. Once finished, if you have the premium version, your swimlane diagram can be shared as a link right from the browser, downloaded as an image, or turned it into an editable PowerPoint slide so you can easily include it in presentations.
FAQs about making swimlane diagrams in Excel
See below the answers in brief to the most frequently asked questions about making swimlane diagrams online.
You can make a swimlane diagram online using either non-specialized web-based tools such as Google Sheets or dedicated swimlane diagram makers like Office Timeline Online. Bear in mind that the first option is suited only for simple processes and requires you to manually build a basic flowchart to illustrate them. For more refined, professionally-designed cross-functional diagrams, we recommend that you opt for purpose-built swimlane diagramming software.
You can create a swimlane diagram on Google using its spreadsheet application, Google Sheets. It is a manual process that revolves around the four main steps below:
- In a new spreadsheet, list the main participants of your process in a column.
- Set up distinct swimlanes for each of these listed participants by horizontally merging row cells.
- Insert shapes inside each swimlane to illustrate the steps of your process as assigned to their specific owners.
- Add descriptions and text details to the various shapes associated with the process steps you mapped out at Step 3.
For more details about each of the steps above, check out our extensive tutorial which walks you through the full process from start to finish. Or, you can speed things up and effortlessly produce clear, stylish process flowcharts with an automated web-based swimlane diagram maker like Office Timeline Online.