A project chart that clearly sets down the main road to the effective implementation of a project is any planner or manager’s guiding light. Delineating a timeline that includes the phases of a project from start to finish, project charts can be a great tool for reporting any occurring changes, tracking progress and communicating status to clients, teams and executives.
Given their fundamental role in illustrating the framework on which successful projects rely, project charts make the topic of this page. Here is where you will find the answers to the most frequently asked questions about project charts, as well as a professional, easy-to-customize project chart template that you can use for free.
What is a project chart?
A project management chart, also called a project chart, is a graphical representation of data related to a project (such as tasks, milestones, due dates, dependencies and deliverables).
Making difficult project management concepts more digestible to the audience through visualization, a project chart supports project managers in:
- eliminating bottlenecks;
- keeping project participants up-to-date about the development of the project;
- making better decisions while executing their project;
- streamlining and tracking project activities;
- managing resources efficiently;
- promoting collaboration among team members;
- sharing and communicating information with stakeholders and teams more easily;
- improving time management.
What is a project chart layout?
A valuable tool for planning and managing various types of projects, a project chart may take several shapes. Its layout depends on the nature of the project for which it is used and ranges from flowcharts and timelines to network diagrams and bar charts.
To see different samples of project charts, browse through our gallery of timeline templates.
How do you create a project chart?
Creating a clear, simple project chart requires that you follow the steps below:
- List all the activities (tasks) and events (milestones) that make up the work breakdown structure of your project.
- Determine the start and end dates for your tasks, and due dates for your milestones.
- Sequence the identified tasks in chronological order and use milestones to demarcate major phases in your project.
You can then turn all this information into a neat visual by using our project chart template provided here. Alternatively, you can make a timeline to illustrate your project data with the help of various office tools such as Microsoft Excel or PowerPoint.
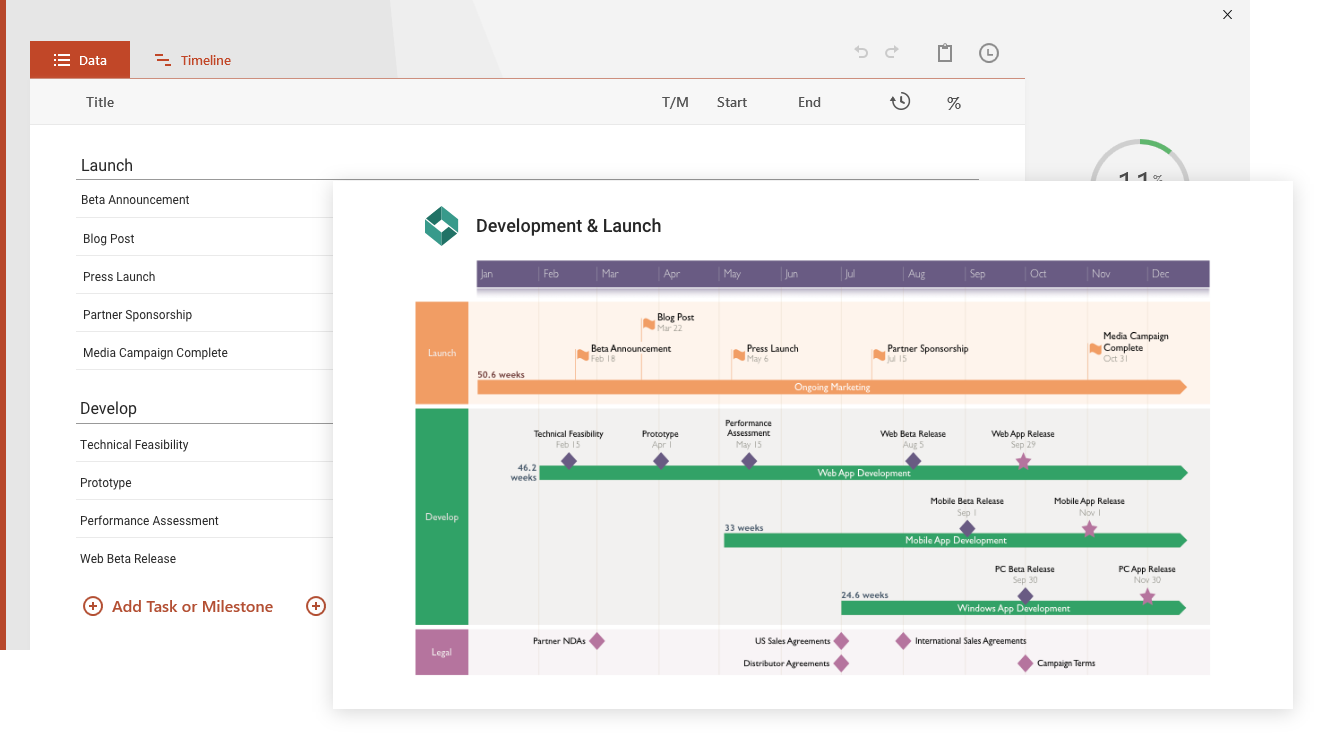
Using and updating the Project Chart Template
The free project timeline template was created to serve all types of professionals who need to make important presentations to clients and execs in a visual, impressive and easy-to-understand manner. It was also designed natively in PowerPoint so any team member or resource who has PowerPoint can contribute, edit and share the template.
Successful project planning and management heavily rely on visual project timelines that clearly communicate the main milestones and tasks of a project in a chronological order. This helps all project resources and stakeholders see what deliverables need to be accomplished next and by what date.
To this end, our free project chart template for PowerPoint was designed to help project managers and planners visualize all the critical project actions, deadlines and events from start to finish. The timeline sample can be used to create a project summary illustration that can be easily communicated on team websites, scorecards or in documents. This makes the project chart template ideal for project reviews and status reports.
The template was also built to work natively with the Office Timeline project chart creator. Office Timeline is a free add-in for PowerPoint that creates timelines and Gantt charts and updates them as things change. You can use it to automatically customize this template with your own data, and even add important details such as durations for completing tasks and Today’s Date marker for showing progress.
Project timeline data can also be imported directly into PowerPoint from Excel or from project management tools such as Microsoft Project Office Timeline’s free 14-day trial. Whether you are manually editing the free project chart template or automatically updating it with Office Timeline, your audiences will receive an impressive visual that is easy for them to understand.
Frequently asked questions about project charts
Here are our answers to the most common questions that people have about project charts.
What is a timeline in a project?
A timeline is a specific type of project chart that focuses on the chronological order of tasks and milestones, and the time frame for each activity. It includes a summary of the required tasks, who is responsible for each task, priority levels and milestones and typically uses a horizontal bar chart or timeline diagram to represent the project schedule, with each task or milestone represented by a bar or marker that shows its start and end dates.
One of the big advantages that a timeline offers is that it shows the sequence of actions needed to complete the project in a way that can be easily understood by all stakeholders. It also helps project managers to track the progress of the project, identify any delays or issues that may arise, and make adjustments to the schedule as needed.
What are the 5 stages of a project?
The project lifecycle encompasses these stages:
-
Initiation - This stage involves identifying the purpose and scope of the project, defining its objectives, identifying stakeholders, and establishing the project team. During this stage, the feasibility of the project is also assessed, and a business case or project charter is developed.
-
Planning - This stage involves defining the project scope, creating a detailed project plan, and establishing a project schedule. The project manager will also develop a budget, identify project risks, and develop strategies to manage those risks. Communication plans and project documentation are also developed during this stage.
-
Execution - This stage involves implementing the project plan and executing the tasks according to the project schedule. The project manager will monitor progress, manage resources, and handle any issues or conflicts that arise. Regular status reports are provided to stakeholders to keep them informed of progress.
-
Monitoring and control - This stage involves tracking project progress and comparing it to the project plan. The project manager will take corrective actions as needed to keep the project on track, manage changes to the project scope, schedule, and budget, and communicate project status to stakeholders.
-
Closure - This stage involves completing all project activities, verifying that all project deliverables have been completed according to requirements, and closing out the project. A post-project review is conducted to evaluate the success of the project, identify lessons learned, and document best practices for future projects.
How do I create a project timeline?
To create a project timeline, follow these steps:
-
Determine the start and end date of the project.
-
Identify all the tasks required to complete the project.
-
Determine the duration of each task.
-
Determine the dependencies between tasks.
-
Use a project management tool or software to create a timeline that includes all the tasks, their duration, and dependencies, and aligns them with the project's start and end date.
-
Review and adjust the timeline as needed to ensure that it is realistic and achievable, and communicate it to all stakeholders involved in the project.
What is project proposal timeline?
A project proposal timeline is a document that outlines the estimated timeframe for completing the tasks and activities proposed in a project. It typically includes the start and end dates of the project, major milestones, and key deliverables. It serves as a roadmap for the project, providing a clear understanding of the project scope, timeline, and resource requirements. The proposal timeline is usually included in the project proposal document, which is presented to stakeholders for approval before the project can be initiated.
How do you prepare a project plan?
Preparing a project plan involves several steps. Here is a suggested general framework that you can use to create a project plan:
-
Define the project scope and objectives - Identify the purpose of the project, the desired outcome, and what specific tasks or deliverables are required to achieve it.
-
Create a work breakdown structure - Break down the project into smaller, manageable tasks or work packages. This helps to organize the project and identify the resources required to complete it.
-
Determine project timelines - Establish timelines and deadlines for each task or work package. Use a Gantt chart or similar tool to visualize the timeline and dependencies between tasks.
-
Identify project resources - Determine the resources required to complete the project, such as personnel, equipment, materials, and budget.
-
Create a risk management plan - Identify potential risks that could affect the project's success, and create a plan to mitigate or respond to these risks.
-
Develop a communication plan - Identify stakeholders and determine how to communicate with them throughout the project.
-
Monitor and track progress - Regularly track and update the project plan to ensure that the project is on track, and adjust the plan as necessary.
-
Evaluate project success - After the project is completed, evaluate its success against the initial scope and objectives.
After gathering all these data, you can put the project plan in a clear and easily understandable format with the help of the automated project plan creator from Office Timeline. This lightweight add-in for PowerPoint helps you generate in a few minutes beautiful project plans that will impress your audience.
What is a simple project plan?
A simple project plan is a basic outline of a project's main objectives, tasks, and timelines. It is often used for small projects that do not require a detailed or complex plan. A simple project plan should identify the tasks required to achieve the project objectives, assign tasks to team members, and establish deadlines for each task. It should also be regularly updated to ensure the project stays on track and is completed on time.
Create your next project plan using our ready-made project chart template that was designed as a native PowerPoint slide which you can easily customize and share with teams, executives, and stakeholders.
How do you start a project plan?
To start a project plan, follow these steps:
-
Define the project scope. Identify project purpose, specific tasks and deliverables.
-
Identify project stakeholders. Who will be impacted by the project?
-
Develop a project charter that includes project's purpose, objectives, stakeholders, and success criteria.
-
Create a work breakdown structure (WBS). Break down the project into smaller, manageable tasks or work packages.
-
Determine the project timeline and deadlines for each task or work package.
-
Identify project resources, such as personnel, equipment, materials, and budget.
-
Create a risk management plan. Identify potential risks and create a mitigation plan.
-
Develop a communication plan.
-
Monitor and track. Keep track of the project’s progress and update the project plan as needed.
Once you’ve covered all these steps to prepare a project plan, you can proceed to putting all data together in a visual format. To this end, you can use a professional project plan creator, such as the Office Timeline add-in for PowerPoint. This lightweight add-in helps you generate roadmaps in several minutes and provides a rich collection of easily customizable templates to choose from. Try Office Timeline for free and enjoy the full benefits.
What is a project process?
A project process is a sequence of steps or activities that are followed to complete a project from start to finish. It involves a series of planned and coordinated activities, which are designed to achieve the project objectives and deliverables within a specific timeframe and budget.
The project process typically includes the following phases:
-
Initiation - identifying the project's goals, objectives, scope, and stakeholders, and creating a project charter.
-
Planning - developing a detailed project plan, including timelines, budgets, resource allocation, risk management, and communication plans.
-
Execution - carrying out the project activities according to the project plan, including managing project resources, monitoring progress, and addressing any issues or changes that arise.
-
Monitoring and control - tracking project progress against the project plan, monitoring project risks, and making adjustments as necessary to keep the project on track.
-
Closure - completing the final project activities, such as testing, quality assurance, and project acceptance, and delivering the project deliverables to the stakeholders.
The project process may vary depending on the size and complexity of the project and the specific industry or organization.
How do you draw a project plan?
A project plan can be drawn using a variety of tools, such as timelines, Gantt charts, flowcharts, or mind maps. Here are some common steps that you can take to draw a project plan using either a timeline or a Gantt chart:
-
Identify the tasks
Make a list of all the tasks or work packages required to complete the project.
-
Determine task dependencies
Identify which tasks need to be completed before others can begin, and which tasks can be done in parallel.
-
Assign task duration
Estimate how long each task will take to complete.
-
Create a timeline or a Gantt chart
Use a timeline tool or a Gantt chart creator. Create a chart that shows the timeline for each task (or a horizontal bar char, if you decide to use a Gantt chart). The chart should show the start and end date for each task, as well as the duration and dependencies between tasks.
-
Add milestones
Mark important project milestones, such as project completion or key deliverables.
-
Add resources
Assign resources to each task, such as personnel, equipment, and materials.
-
Monitor and update
Regularly check if the chart needs updating as the project progresses. This ensures that the current state of the project is accurately reflected.
When drawing a project plan, it's important to make it clear and easy to grasp, so that team members can quickly refer to it and understand their roles and responsibilities. You can use colors, symbols, or labels to make the plan more visually appealing and easier to read.
Or, to make it really simple and fast, you can use a professional timeline and Gantt chart creator, such as the Office Timeline add-in for PowerPoint, that automates most of the work and helps you generate time charts in minutes.