A well-crafted roadmap helps project or product managers effectively plan and implement a series of strategic initiatives towards achieving an overall business goal. If you’re a professional who wants to make a roadmap online, you can do so with Google Sheets, using the spreadsheet program’s editing and Shapes features. However, manually formatting related data can become daunting when you need to regularly create and update such visuals, for which reason a dedicated roadmap maker might prove more suitable for the task.
On this page, we will provide step-by-step instructions on how to build your high-level strategic plans both manually in Google Sheets and automatically with a web-based roadmap maker called Office Timeline Online.
Which tutorial would you like to see?
How to manually make a roadmap online with Google Sheets
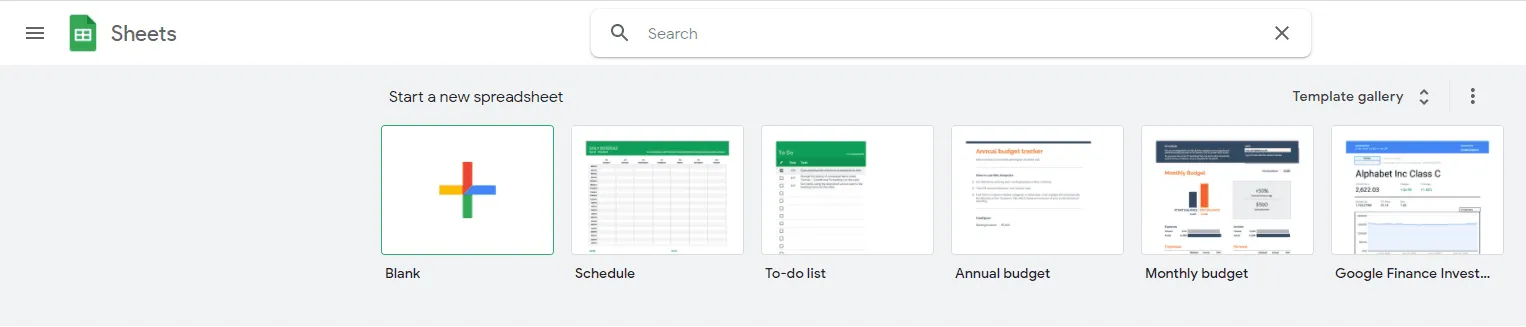
Since Google Sheets doesn’t have any incorporated pre-made roadmap templates that you can customize, you will need to build one from scratch by opening a new blank spreadsheet and following the steps below.
1. Enter the main components of your strategic plan in Google Sheets.
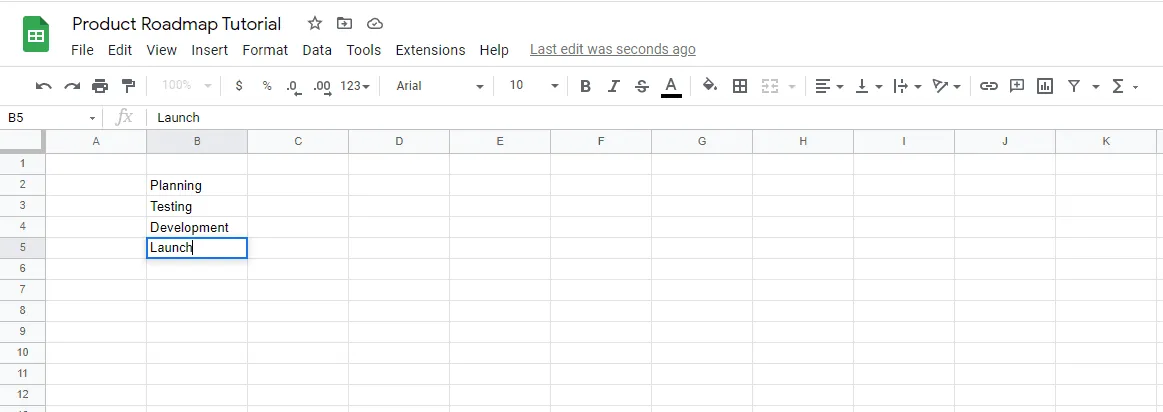
In the newly opened spreadsheet, list the major components of your roadmap’s workstream in a column. These will make up the vertical axis of your visual.
Depending on the type of data you want to illustrate, these elements may refer to phases, processes, teams, or product features. In our example below, we listed the main four stages of the product roadmap we want to build.
2. Set a timeline at the top of your spreadsheet.
Use the top row of your spreadsheet as a horizontal axis to add the time increments (weeks, months, or quarters) that will define the timeline band of your roadmap. It is against these time units that you will mark your roadmap’s most important activities or events.
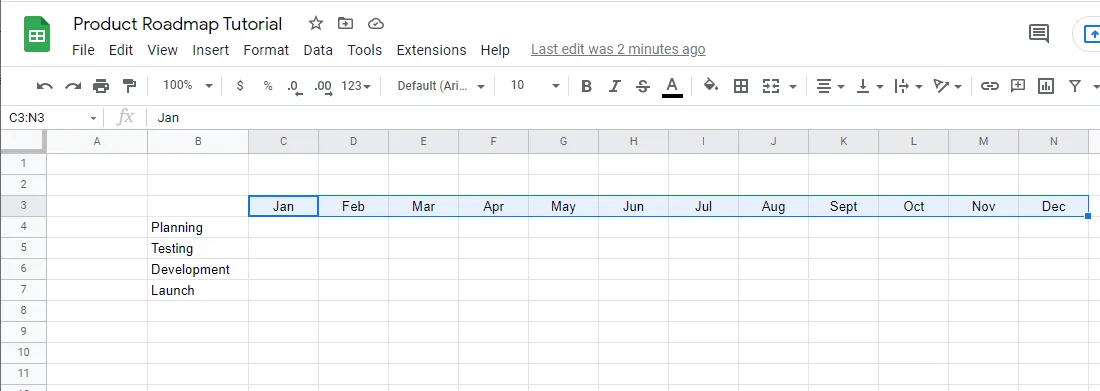
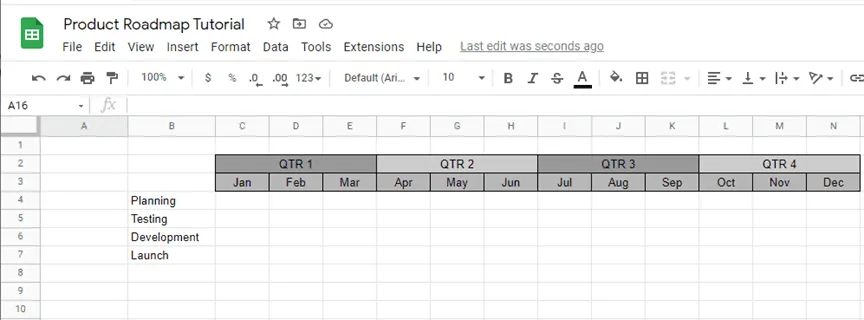
In our example, we wanted to use multiple time reference sets for the tasks and milestones that will be included in our roadmap. So, we inserted two timebands (in months and quarters, respectively) that are highlighted with alternating colors for better differentiation.
At this point, you will have outlined the two main dimensions of your roadmap:
- The vertical axis – it represents the major components of the overall process that you want to map out;
- The horizontal axis - it lays out the timeline against which you will represent the details associated with each of your roadmap’s major steps.
3. Set up horizontal swimlanes for each of your roadmap’s main components.
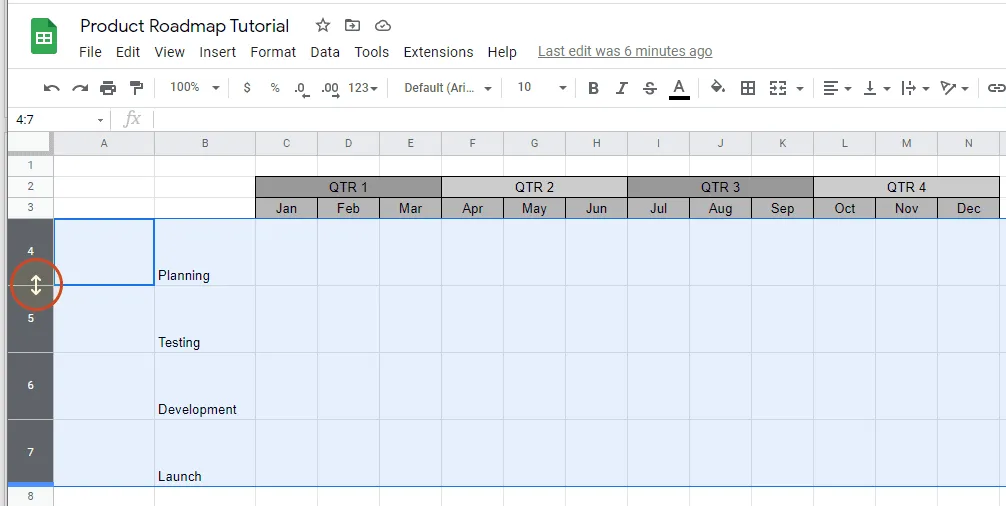
a) Adjust row width - Select the rows that contain the items listed at Step 1 (keep CTRL pressed while clicking on each row’s numeric indicator at a time), and then drag the up-down handle to increase their width to the intended extent. By doing so, you ensure the selected rows are equally sized.
b) Horizontally merge cells for each of your data rows – To turn a specific row into a swimlane, you will need to merge all the row’s cells under the timeband header (i.e., those defined by the horizontal and vertical axes of your roadmap). Follow the steps below to do this for all your rows at once:
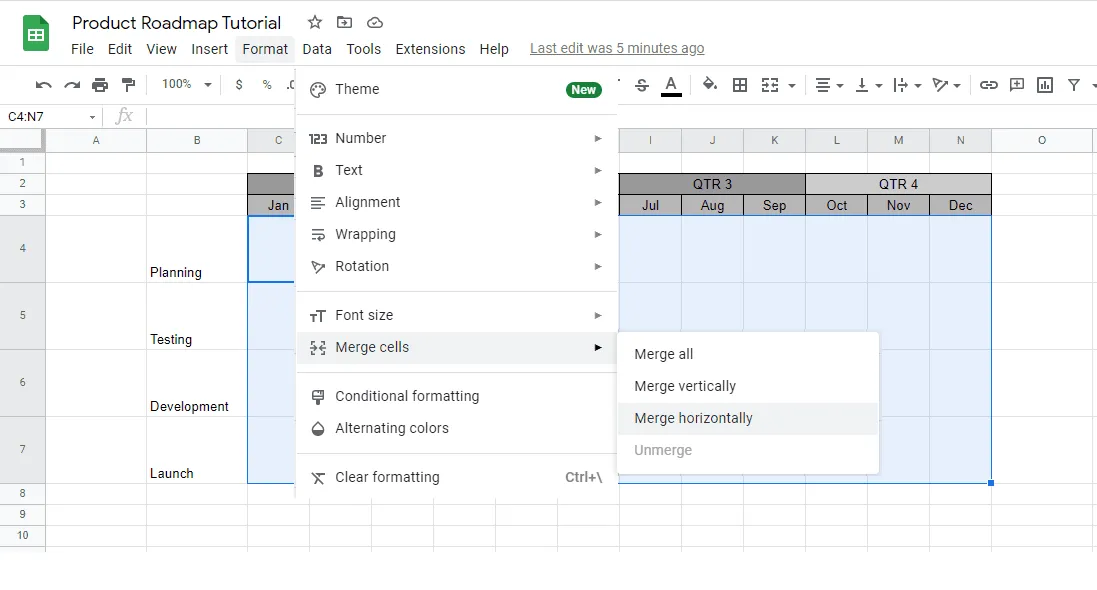
i. Click on the upper left cell of your data table (in our case, cell C4), and then press and hold while dragging the cursor over the rest of the cells contained within the horizontal and vertical axes of your roadmap. This will select all the cells of your roadmap data table.
ii. Go to Format → Merge cells on the Google Sheets ribbon.
iii. Click on Merge horizontally from the menu that subsequently appears.
Once you perform the steps above, your newly formatted roadmap table will look like this:
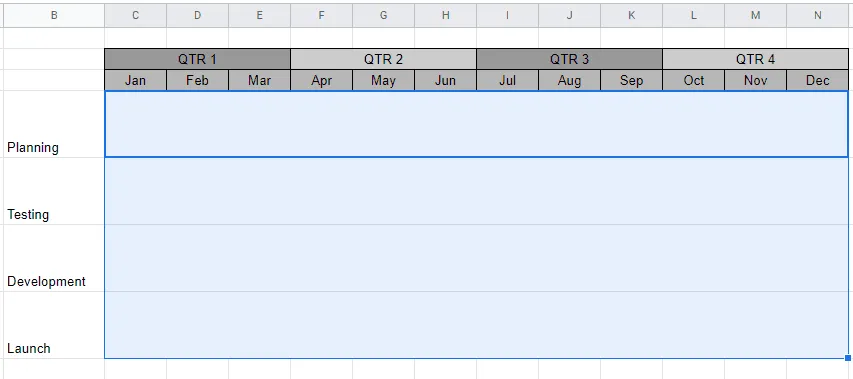
It is within these newly created horizontal containers that we will group the actions corresponding to each of the roadmap stages listed earlier.
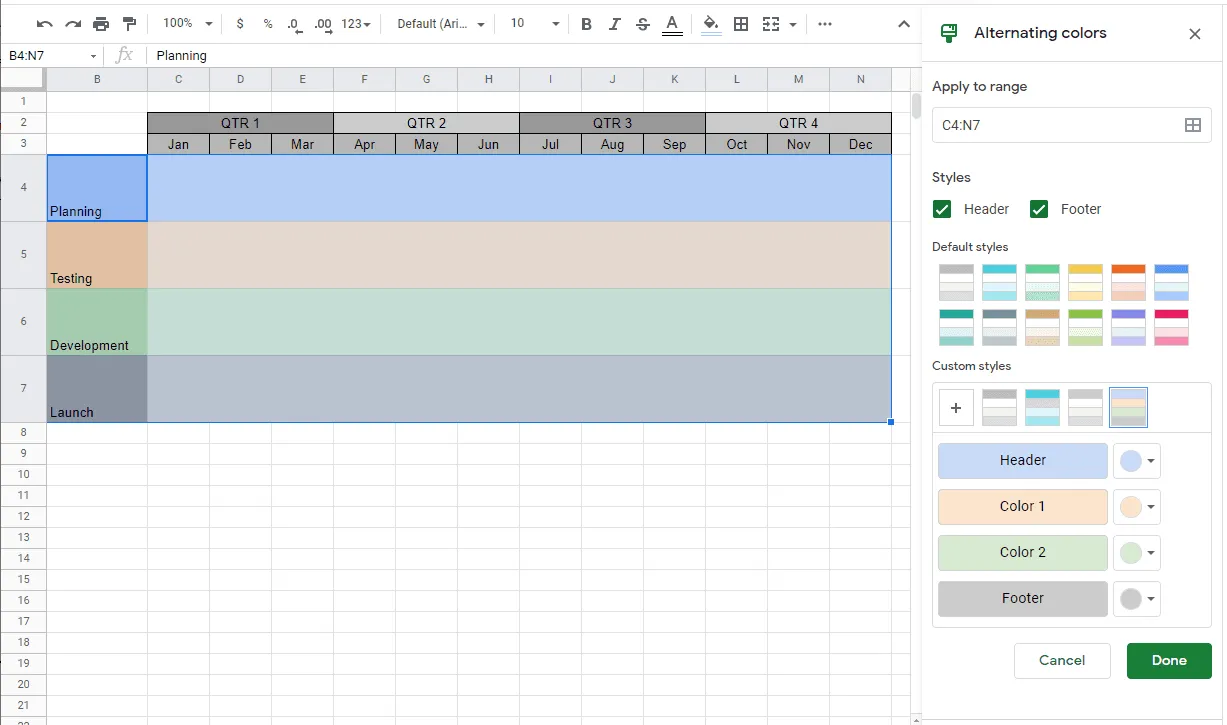
c) Demarcate your swimlanes with alternating colors for enhanced clarity - After you select your swimlanes, go to the Format tab and click on the Alternating colors option from the menu that appears next.
This will open a task pane on the right, where you can choose the color scheme you want to apply to your roadmap table. You can opt for one of the suggestions in the Default styles section or create your very own using the controls under Custom styles to set distinct colors for each of your roadmap’s swimlanes. Once ready, make sure to click Done to save your choices.
In our case, we wanted to distinctly highlight each roadmap stage with a specific color. Here is the color scheme we chose to apply to our graphic.
4. Enter the associated details of each roadmap component in swimlanes.
Now that your swimlanes are clearly delimited for each process step, you can proceed to adding the associated details (tasks and/or milestones). To visually represent this type of data, we will be using Google Sheets’ Shapes function. Here is what you need to do:
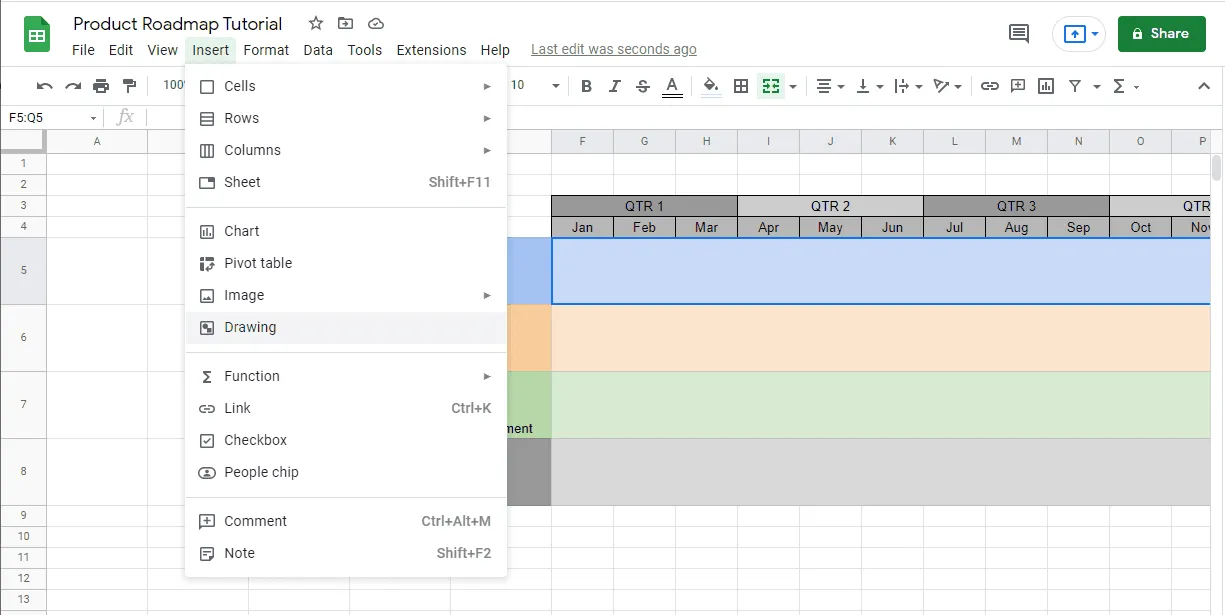
a) Click on the specific swimlane you want to populate to select it.
b) Go to Insert → Drawing. This will open a separate dialog box where you need to perform the actions described below.
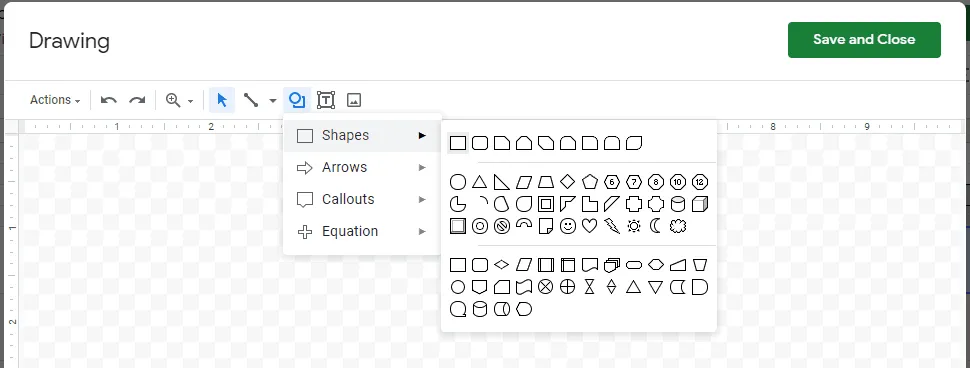
c) Select the type of shape you want to use for your roadmap items – From the top bar of the newly opened Drawing dialog box, click the circle-on-square icon and then on Shapes to choose the option you prefer from the sub-menu that pops up. In our example, we went for the rectangle.
d) Draw the selected shape – Once you made your choice, place the cursor in the desired position within the drawing area, drag it to outline the shape and release it to have the object inserted.
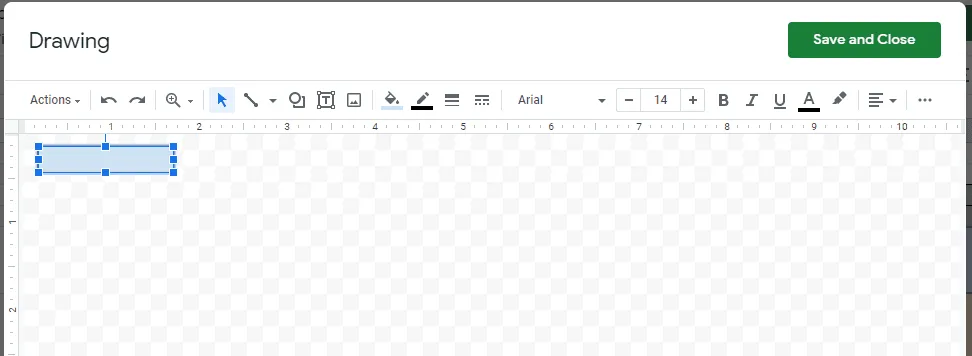
Repeat steps c. and d. above as many times as necessary until you’ve included all the items associated with any selected swimlane. If you want, you can use various shapes and colors to represent your roadmap’s tasks. Once ready, click Save and Close to insert the newly drawn objects in your swimlane and to return to your spreadsheet.
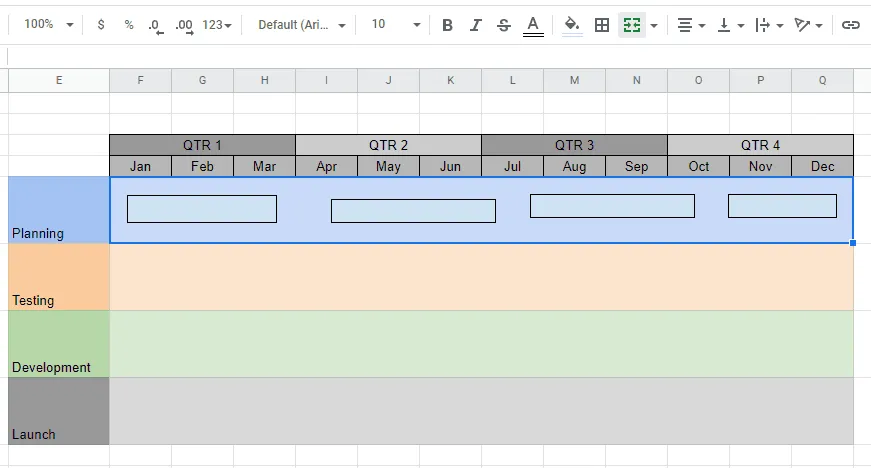
In our example, we wanted to add four major tasks in the Planning swimlane. For the sake of simplicity, we drew their corresponding rectangles at the same level as their position and size can be later adjusted (see next step). Here is how our product roadmap looks so far:
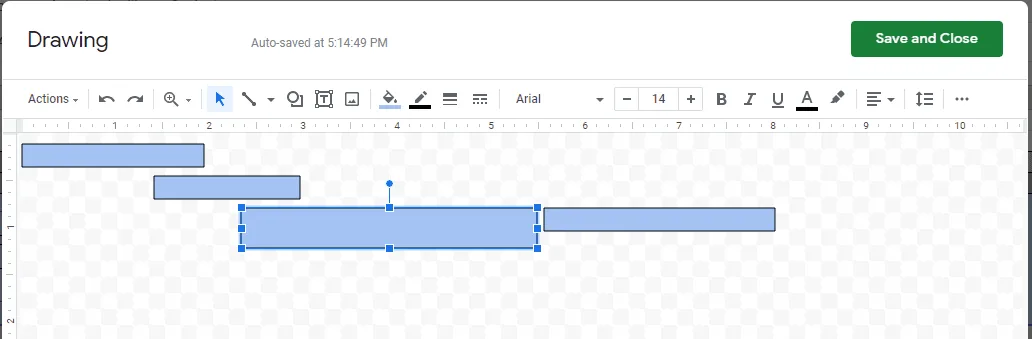
e) Adjust the size and position of the drawn shapes to fit their timeframes – Use the time units displayed on the horizontal axis of your roadmap as reference point for this purpose. First, you might also want to increase the width of your roadmap’s rows and columns to maximize space.
i. Changing shape size – double-click on any of the swimlane shapes to re-open the Drawing dialog box. Here, click to select the object you want to modify, then drag any of the solid square handles at the corners of the object to resize it according to its timeframe. Don’t forget to click Save and Close when finished, so that your changes are saved, and your roadmap updated.
ii. Changing shape position – to reposition any of your swimlane objects, press and hold after clicking on it, then drag and drop it into the new position.
After carrying out all the actions described under Step 4. and recoloring the inserted shapes for all our swimlanes, our product roadmap looks like this:
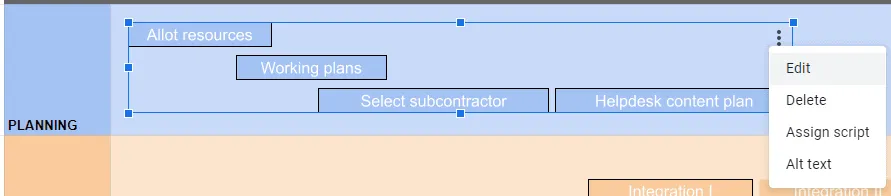
Tip: To remove an existing swimlane-associated shape, simply click on it and then on the vertical three-dot icon in the top right corner of the selected area that becomes visible. This will bring up a small menu from which you need to select Edit. Please note that if your selected shape belongs to a group of objects, clicking Delete will remove them all collectively as Google Sheets groups the objects within a specific container. This is why you need to choose Edit from the menu to remove an individual shape from a group of objects. Once you do so, the Drawing dialog box is opened, and you can delete the intended shape by clicking on it and then pressing the Backspace or Delete key on your keyboard.
5. Format your basic roadmap for improved readability.
Now that your basic Google Sheets roadmap is laid out, you will need to add a few more elements to make it clearer and more effective. The main thing to do in this respect is to add descriptions to your swimlane-associated shapes, as well as extra milestones to better mark specific points along your roadmap’s timeline.
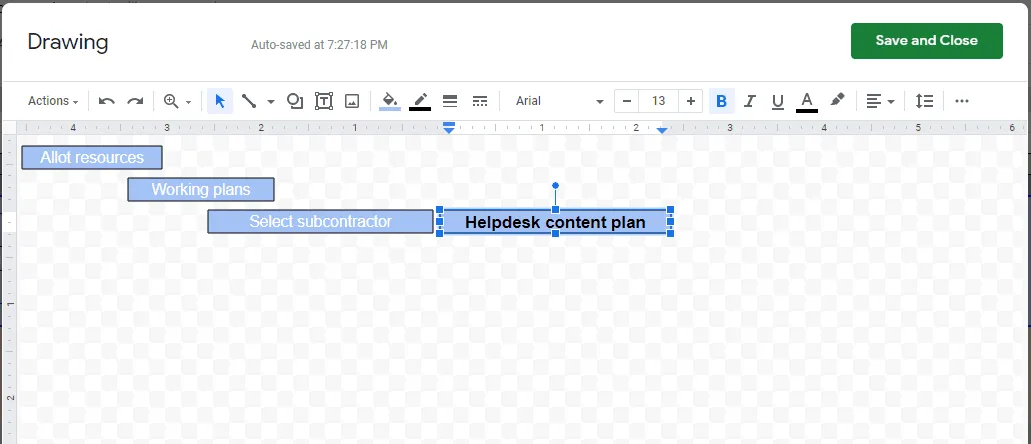
a) Adding descriptions to swimlane-associated shapes – Open the Drawing dialog box for any of your roadmap’s swimlanes, double-click on the shape that you want to label, and start typing in your text.
While here, use the options on the top toolbar to further style the text, changing its font size, type, color, and alignment.
b) Add milestones to your roadmap – Insert a new row below your roadmap’s timeband (horizontal axis), setting it up as a swimlane as shown under Step 3., and then:
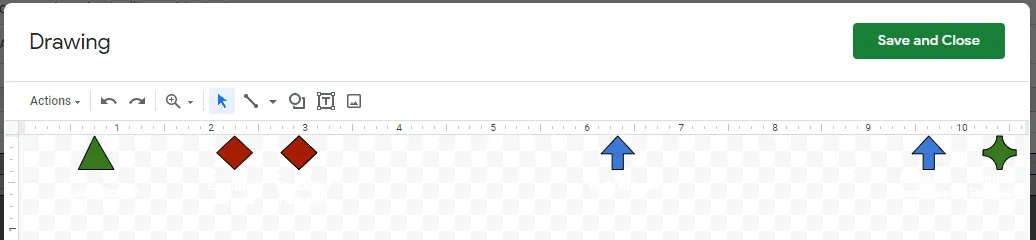
i. Start adding shapes that represent your milestones (as shown under Step 4.). Here, we recommend using distinct shapes to better differentiate your milestones. Here is how we defined ours:
Tip: If you want to use the same shape for several milestones, you can draw and adjust it to the right size once, and then use the CTRL + C/CTRL+V commands to copy and paste it as many times as you need. Reposition the duplicate shapes into the preferred place using drag and drop.
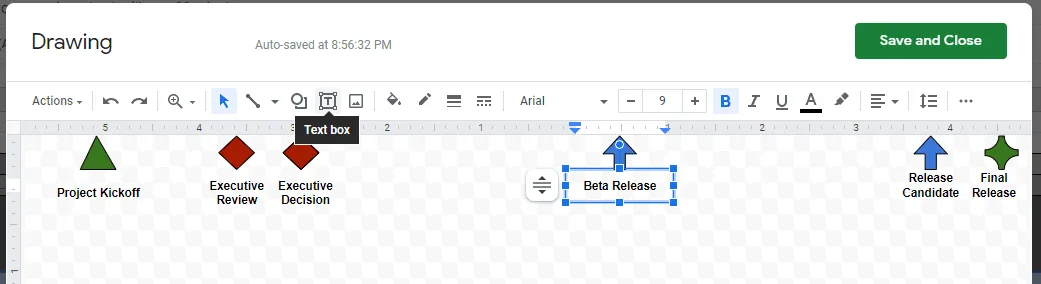
ii. Add descriptions to your roadmap milestones – Staying in the Drawing dialog box, use text boxes to have the milestone descriptions displayed. Click on the boxed T icon on the top toolbar, drag the cursor within the drawing area to draw a text box, and then type in your text. Similar to Step 5.a. above, use the style options to customize the font type, size, color, and alignment of your text.
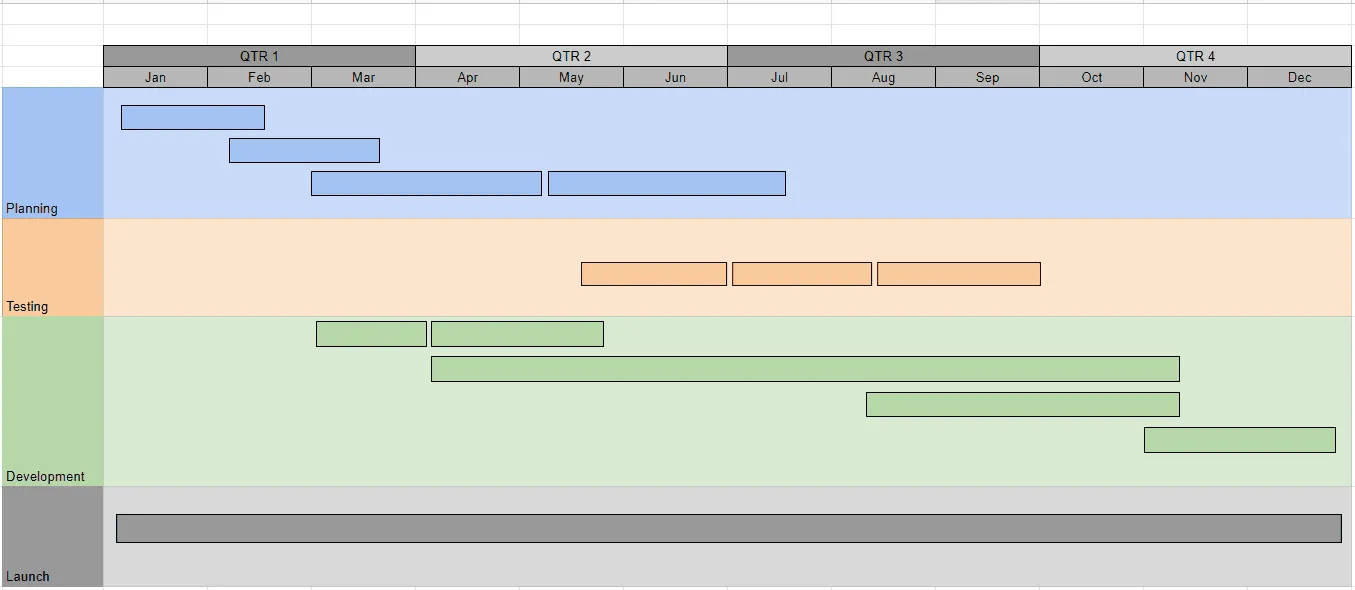
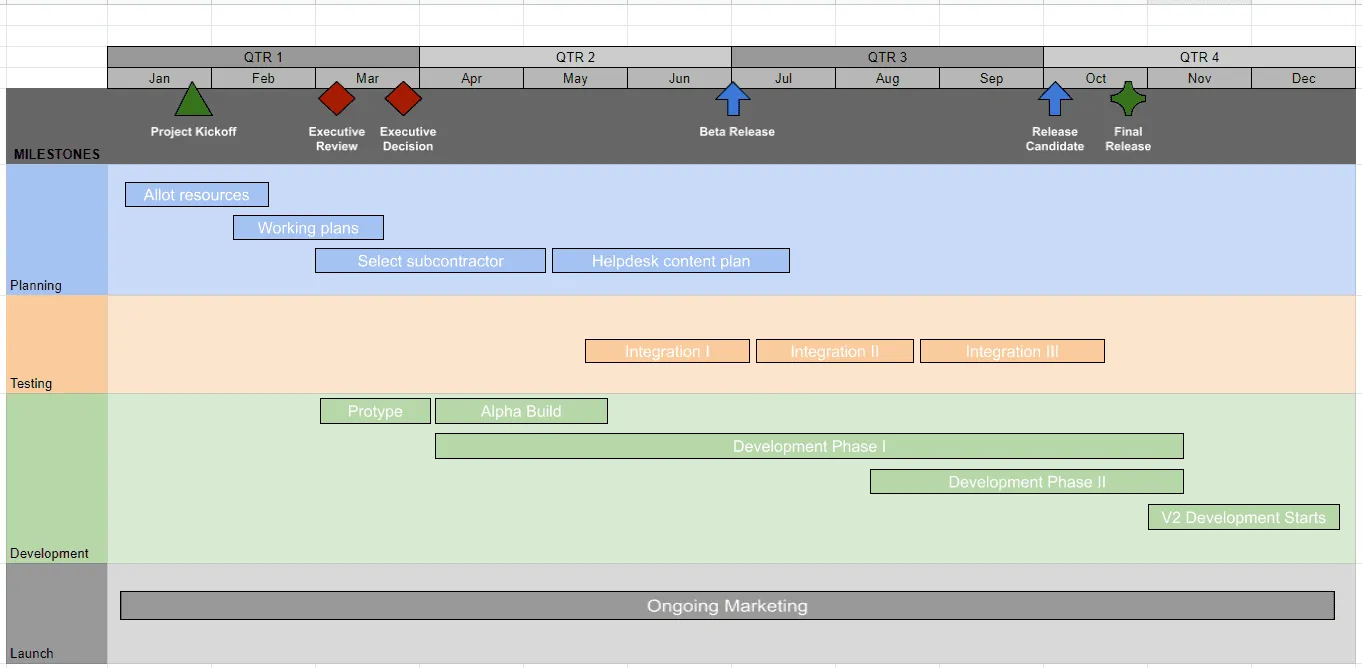
Once we finished adding our milestones and their descriptions, this is how the resulting roadmap looked like:
6. Customize and style your roadmap.
At this point, you can choose to apply some extra customizations to make your roadmap stand out more. Here are a few suggestions:
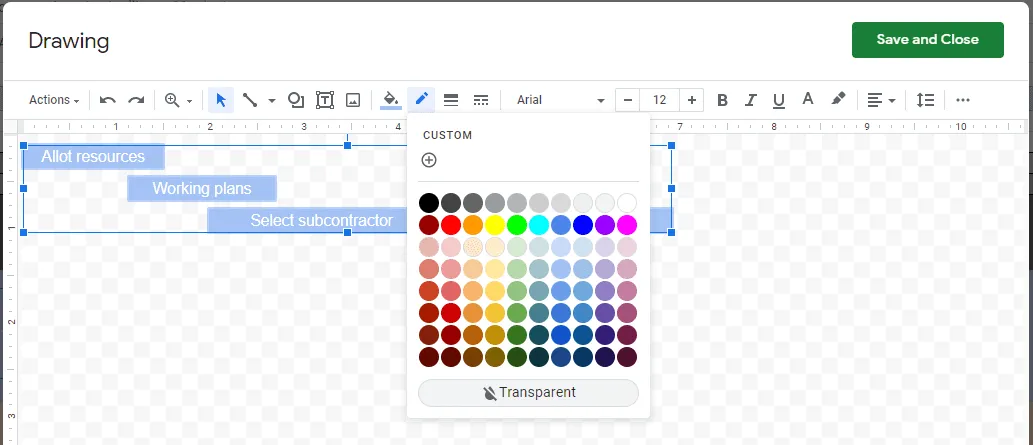
a) Make the borders of your swimlane-associated shapes transparent – Double-click on any of the swimlane shapes to open the Drawing dialog box, select all the items (CTRL + click), and then click the pencil icon on the top toolbar. This will open a small menu where you need to click on Transparent to remove the borders of your selected objects.
b) Add a title and a legend, if necessary.
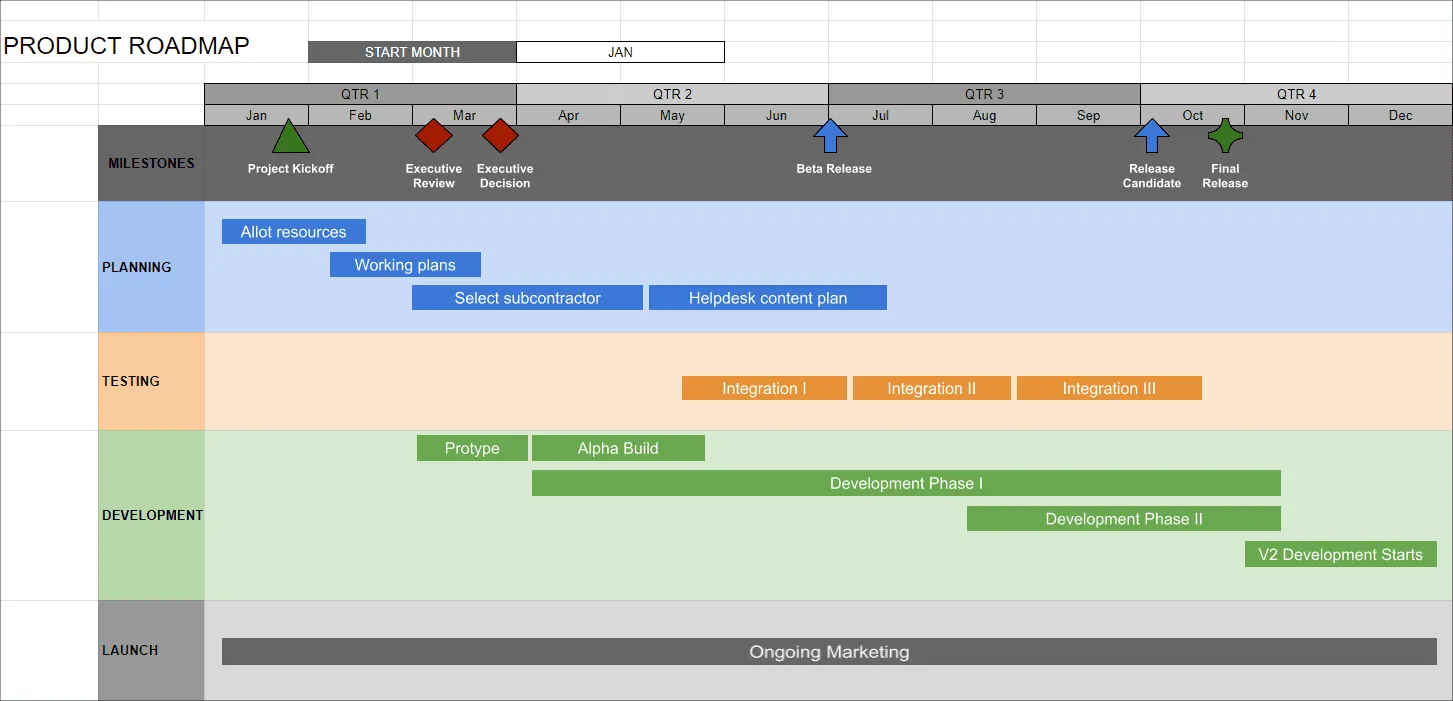
We kept our customizations to a minimum so as to not burden the visual, and our final roadmap looks like this:
How to automatically make a roadmap online with Office Timeline Online
As shown above, manually creating a roadmap online in Google Sheets is possible but the process can become time-consuming, especially when you need to frequently make and update data-rich roadmaps. The lack of flexibility in editing an individual roadmap item or placing it in the right spot inside a swimlane without affecting another object’s position is definitely a drawback.
Professionals who want to build roadmaps online more easily can do so using a browser-based roadmap maker called Office Timeline Online. This web app helps you automatically generate dynamic and highly customizable graphics that you can quickly update, share, or download as presentation-ready PowerPoint slides. To get things started, access the free online tool, and carry out the steps below. To be able to include more than 10 items on your graphic, you will need the premium version of Office Timeline Online.
1. Add your roadmap’s details in Office Timeline Online.
a) To begin creating your roadmap, you can either click on Timeline from scratch from the web tool’s New tab or select one of the templates available. In our demonstration, we opted for the former so you can see how the whole process goes from start to finish.
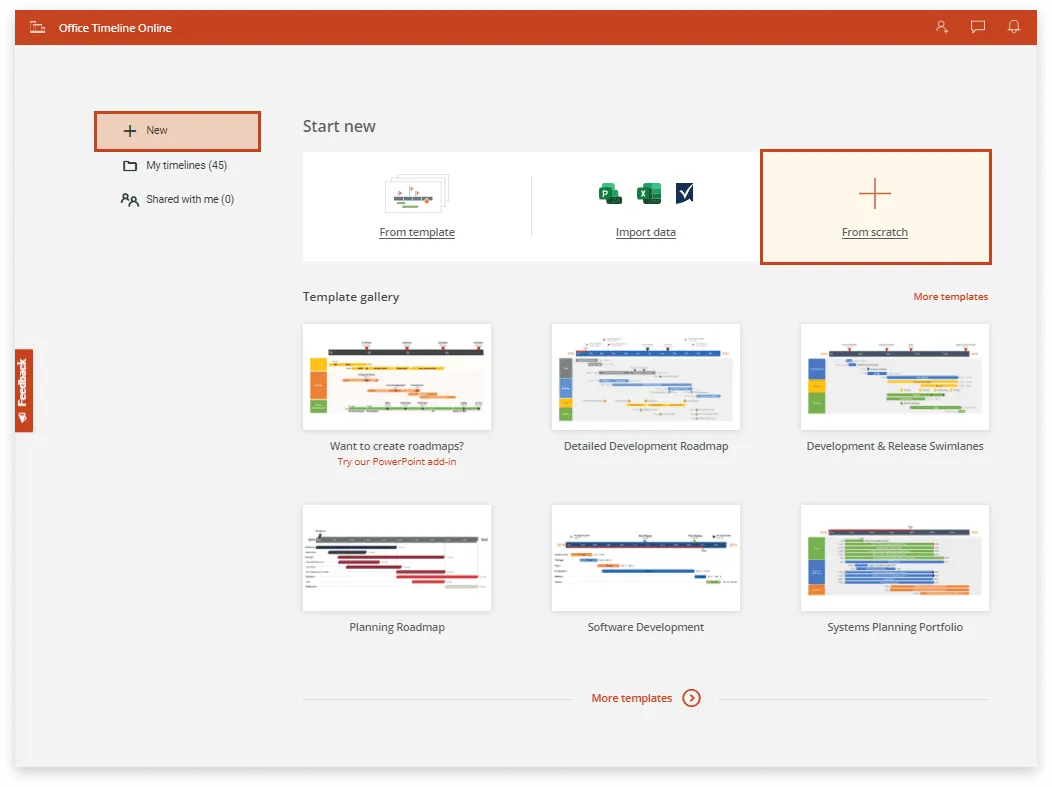
By clicking the Timeline from scratch button, you will be taken to the Data View tab.
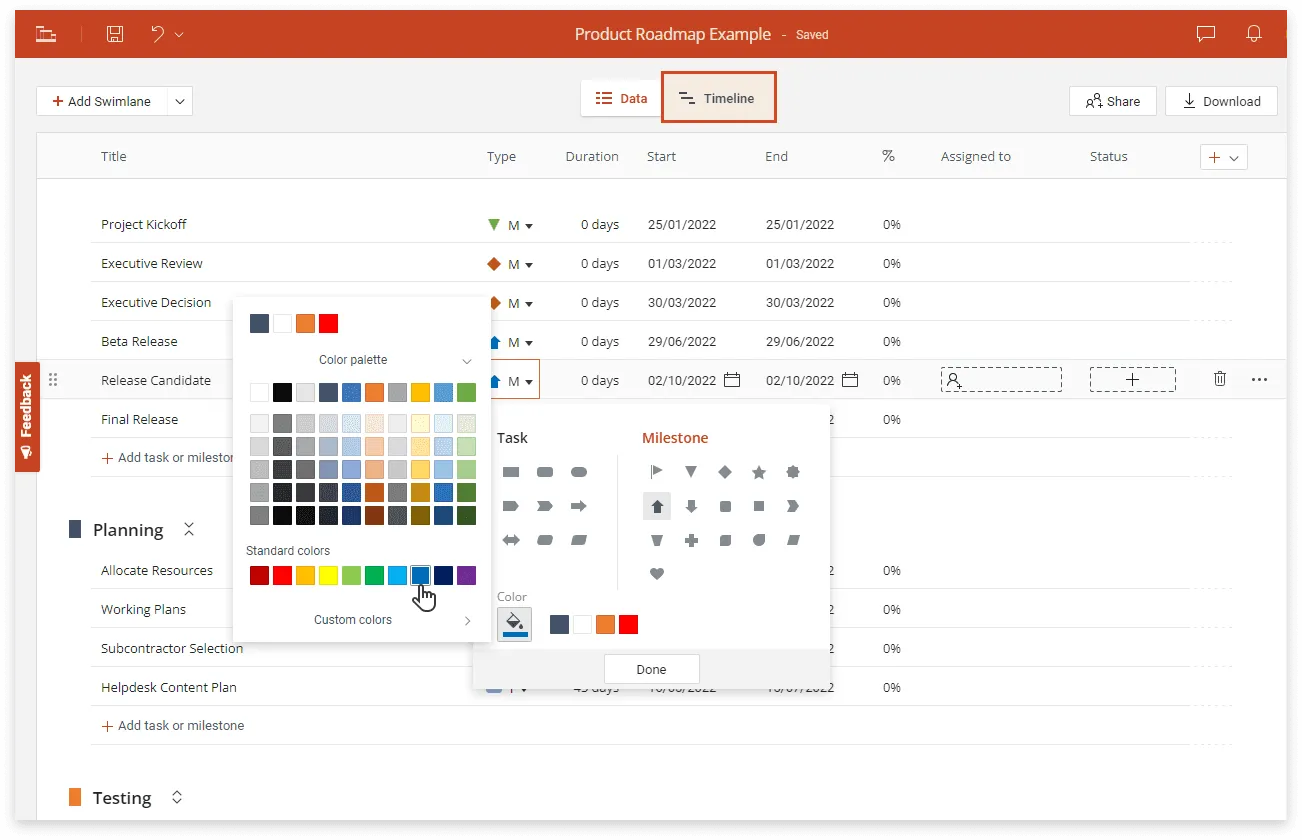
b) Using Data View’s intuitive interface, enter your roadmap’s swimlanes, associated tasks and milestones, along with their due dates. While in this tab, you can also make a few preliminary style choices, such as selecting the shape and color for each of the added items. Once ready, go to the Timeline View by clicking on the Timeline tab above the data list.
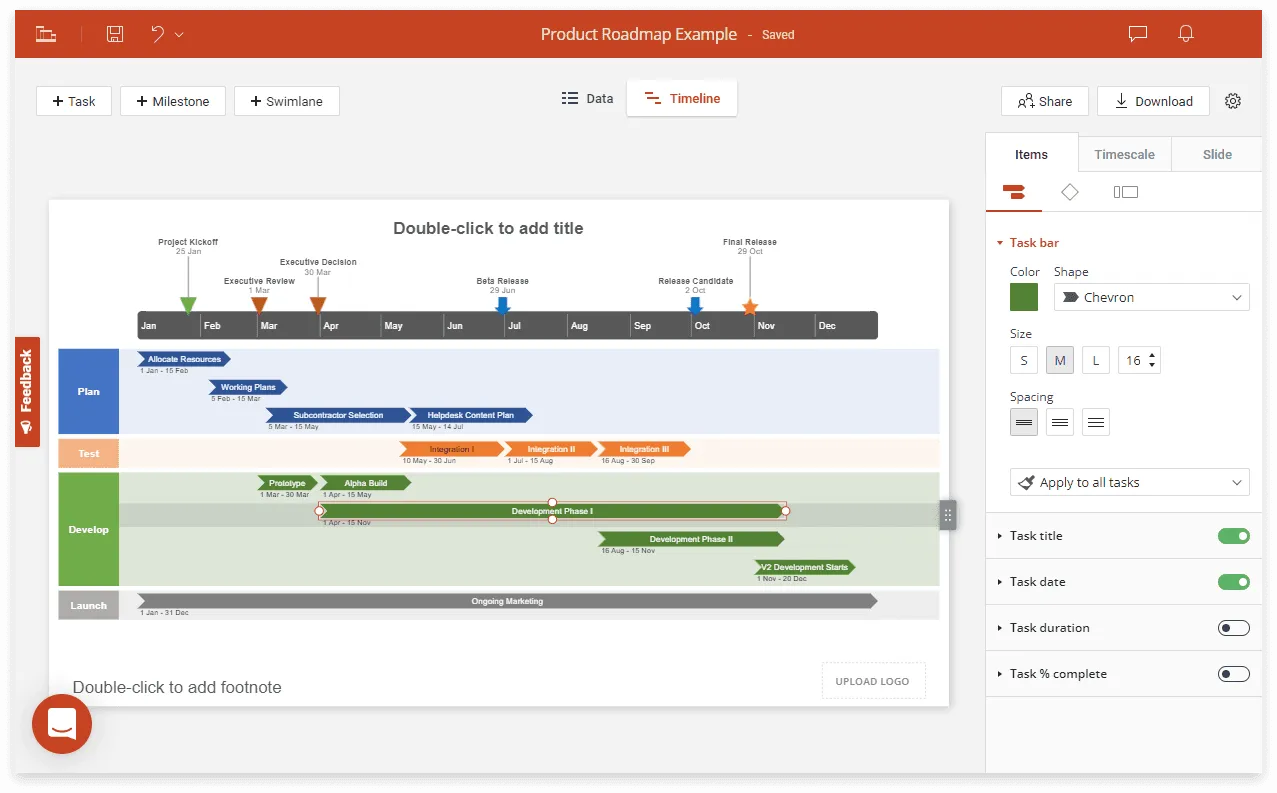
2. Customize and update your roadmap with ease.
a) Now that your roadmap has been auto-generated, you can easily customize its details with just a few clicks. Using the feature-rich Style Pane from the Timeline View, you will be able to apply changes to your roadmap’s items, timeband, or even the whole slide. For instance, you can update any shape, color, and font, adjust the position and spacing for any of your roadmap objects, or even choose to show extra details such as Percentage Complete or Task Duration. To add more tasks or milestones to your roadmap, simply switch back to Data View and enter their details.
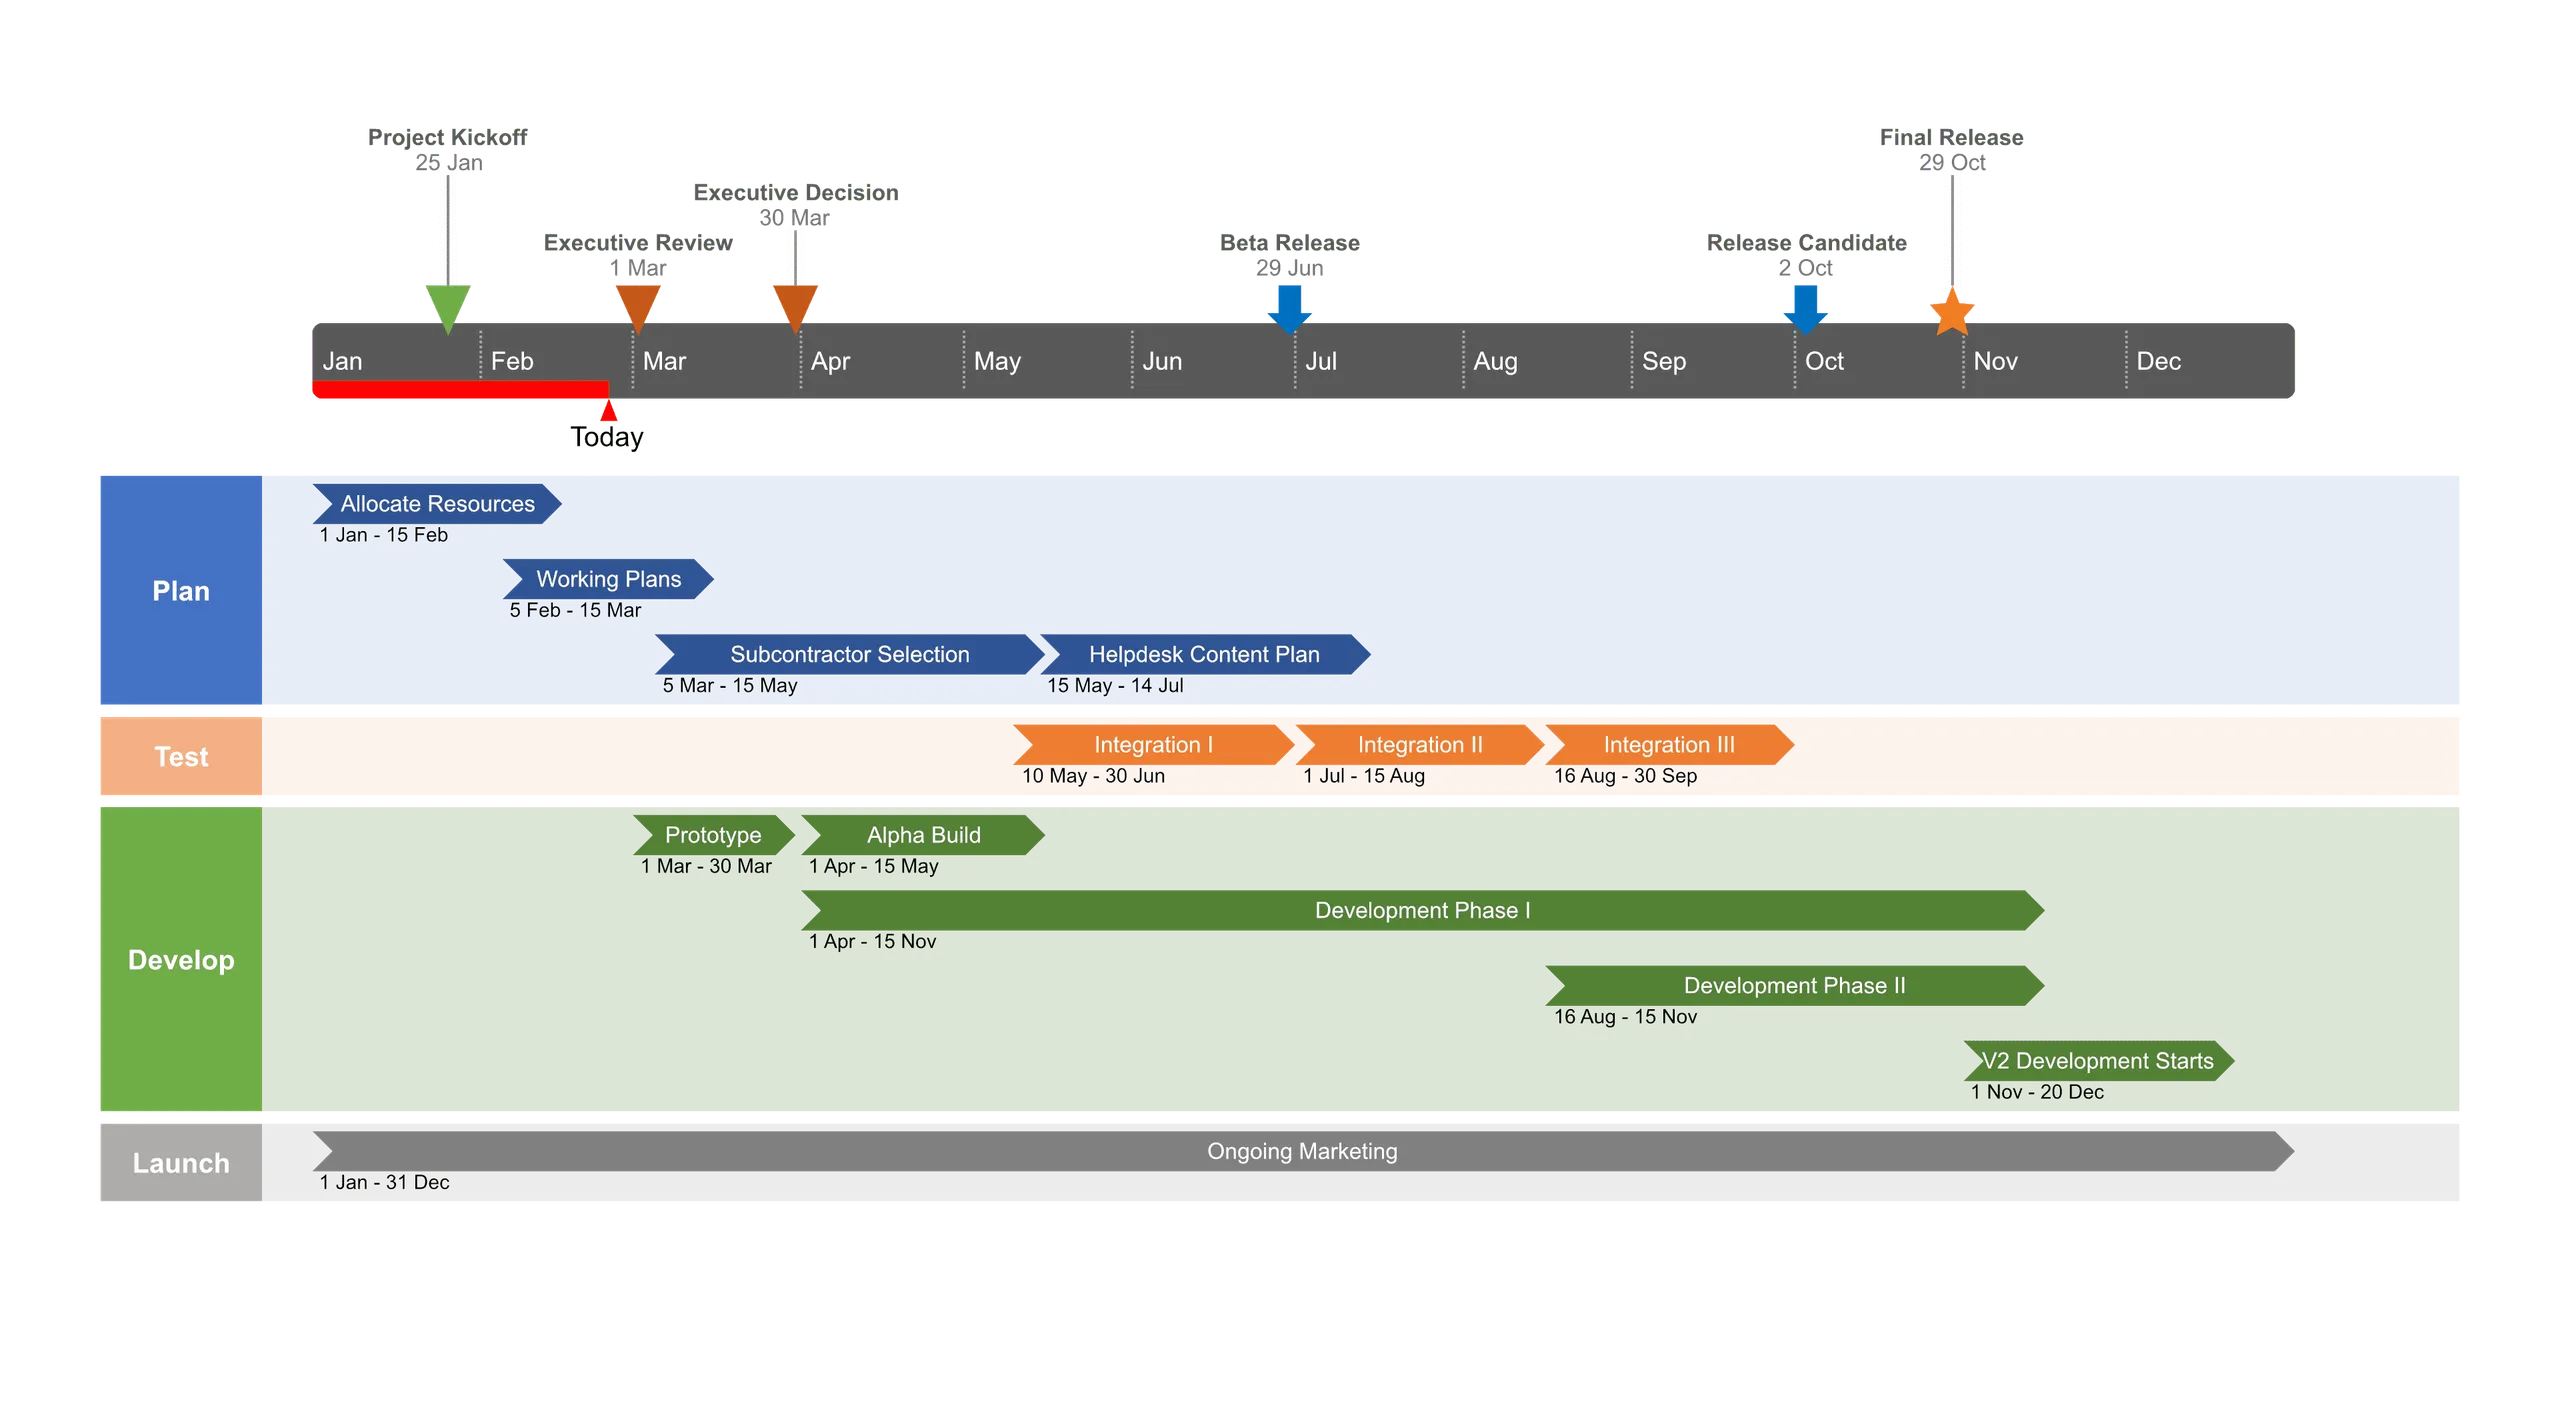
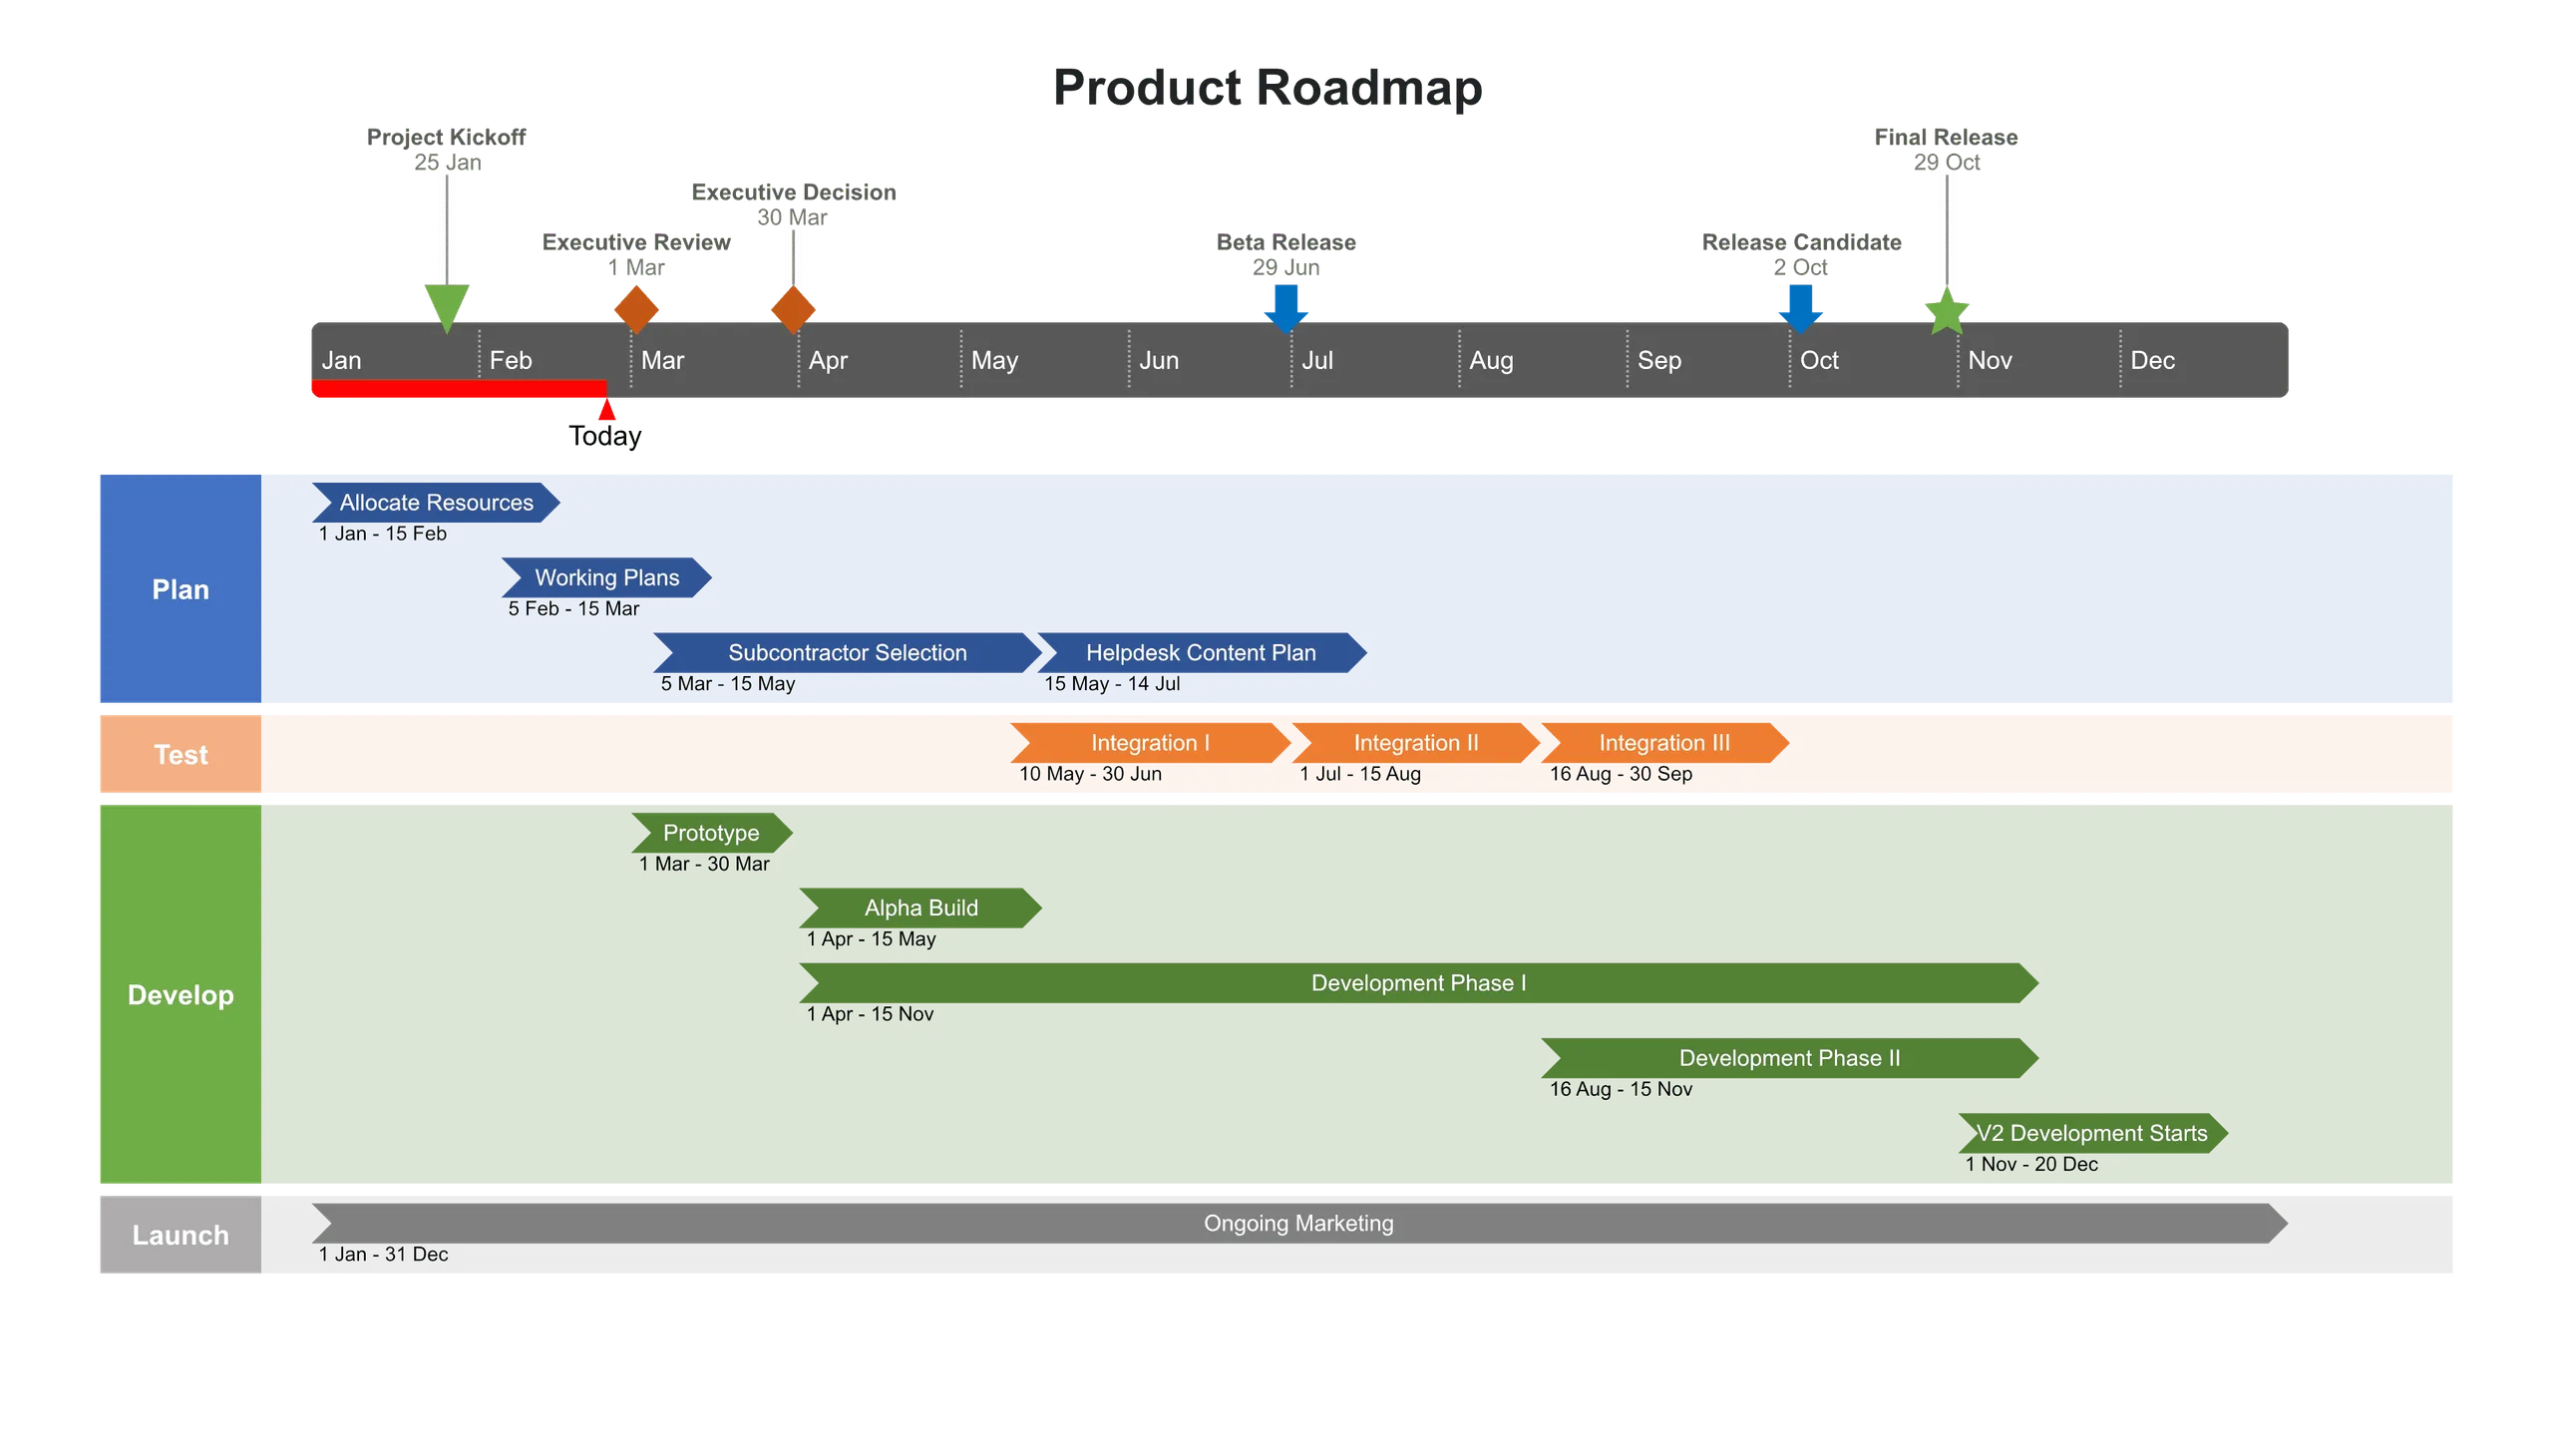
Below, you can see how our final roadmap looks like after we:
- changed our tasks’ shape from rectangular to the arrow one and grouped few of them on the same row (using the options from the Items tab of the Style Pane);
- added a Today’s marker and Elapsed time indicator to help track the progress (using the options under the Timescale tab of the Style Pane);
- added a title and hid the Logo/Footnote placeholders (using the Style Pane’s Slide tab).
b) If you have a free Office Timeline Online account, your roadmaps are instantly saved in the cloud and can be accessed and adjusted at any time as plans change. The Data View makes adding and editing new items fast and easy, while the Timeline tab allows you to update any due dates right on the graphic with a simple drag & drop. Once you’re done, share your roadmap as a link right from the browser, download it as an image, or turn it into an editable PowerPoint slide so you can easily include it in presentations.
FAQs about making roadmaps online
Check out this section to find out the answers to the most commonly asked questions about the creation of roadmaps online.
To make a roadmap online, you can use either non-dedicated productivity tools such as Google Sheets for simple visuals, or (web-based) purpose-built roadmap makers like Office Timeline Online for a more refined output.
If you are interested in learning how to make a roadmap using other various office tools, check out or dedicated tutorials page.
You can manually build a basic roadmap on Google using its spreadsheet application, Google Sheets. Here are the main steps to follow:
- In a new spreadsheet, list your roadmap’s major components in a column.
- Set a timeline at the top of your spreadsheet.
- Set up horizontal swimlanes for each of the items listed at Step 1.
- Within these newly created containers, insert shapes to represent the events or actions associated with each roadmap process.
- Add descriptions to the tasks and milestones that you represented through the inserted shapes.
For more details regarding each of the steps above, please see our comprehensive tutorial which describes the whole process from start to finish.
