Top examples of timelines, Gantt charts, and roadmaps for Government and the public sector
Learn how project visuals can help you plan and manage complex projects in the government and public sector. Customize our free templates with Office Timeline.

Projects managers in charge of programs and strategies in the government and public sector are among the few people who could easily star in a Mission Impossible feature.
Dealing with conflicting stakeholder expectations, cumbersome bureaucracy, lengthy bidding processes, and unexpected political changes is no more than a casual Tuesday for them.
The stakes are pretty high as well. Their ability to plan, manage, and track these massive projects ultimately determines the quality of public services in a country and how efficiently the taxpayers’ money is spent to support the infrastructure and economic development.
But how do they get the job done and stay grounded at the same time?
As many experienced project managers already know, completing public projects relies on having a clear overview of progress across project stages and tasks. And nothing beats timelines, Gantt charts, and roadmaps at visualizing complex plans and keeping work on schedule.
To get an idea of how these project visuals can help you deliver value to every stakeholder involved while staying within scope, check out the 3 possible situations we’ve prepared for you below.
Each example comes with a free PowerPoint slide that you can quickly download on your device, then edit according to your project needs using the Office Timeline free trial.
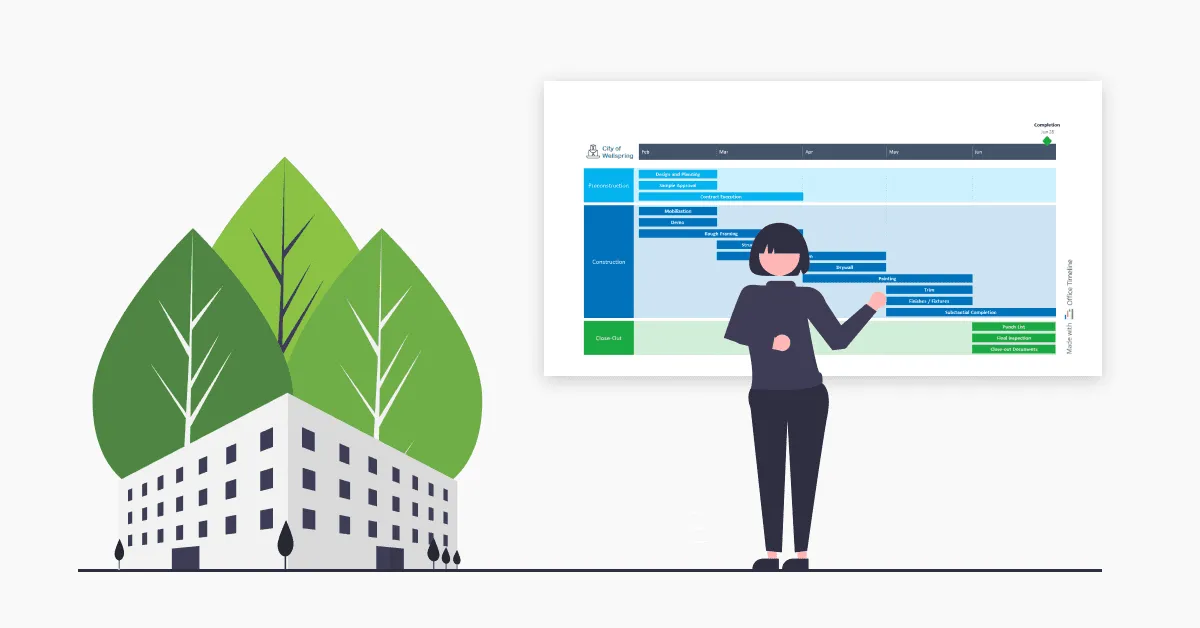
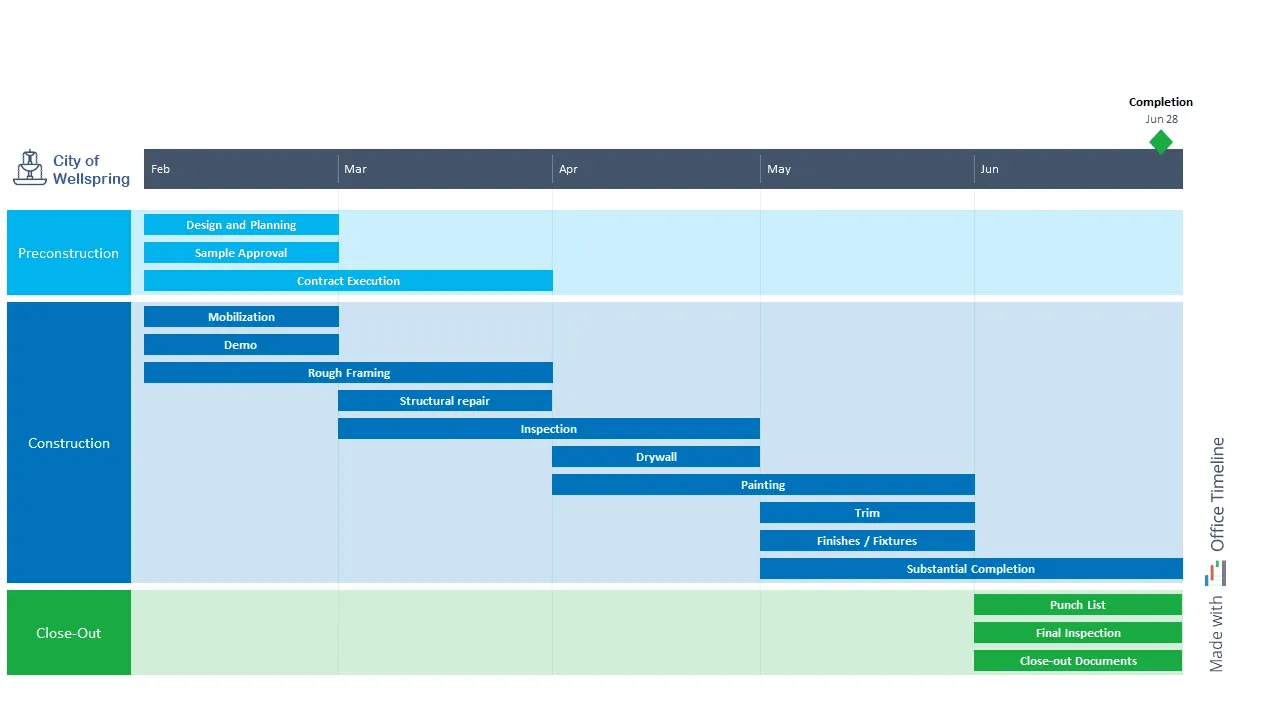
1. Government building infrastructure Gantt chart
Working as a Constructions Project Manager for a local project consulting company has taught Thomas that work goes way more smoothly when everyone is on the same page. Plus, you only need an easy-to-read visual to achieve that.
He has applied this philosophy to numerous projects so far, including the latest government contract the company has won. For that infrastructure management project, he had to put together a simple project cycle overview to present to the stakeholders from the city of Wellspring.
As a regular Office Timeline user, Thomas knew that creating a Gantt chart would be the best way to visualize the project plan and break it down into clear phases, tasks, and deadlines. So that’s exactly what he did.
Fifteen minutes later, the project data was beautifully summarized into one PowerPoint slide. While the three phases of the construction project appeared as colorful swimlanes with the main task scheduled for each month, the final deadline was marked on the timeline like a guiding milestone.
There were no unnecessary details on that chart, just the most important tasks of the project cycle mapped in the order they’d have to be completed. One glance at the Gantt chart was enough for anyone to understand how unexpected delays would set the rest of the work back.
Thomas wasn’t surprised when the project cycle overview turned out to be a success in the meeting with the Wellspring stakeholders. He could see how their perspective shifted — the project was not just a set of documents anymore. Their eyes followed the visual story on the slide while Thomas confidently explained how each project phase would unfold.
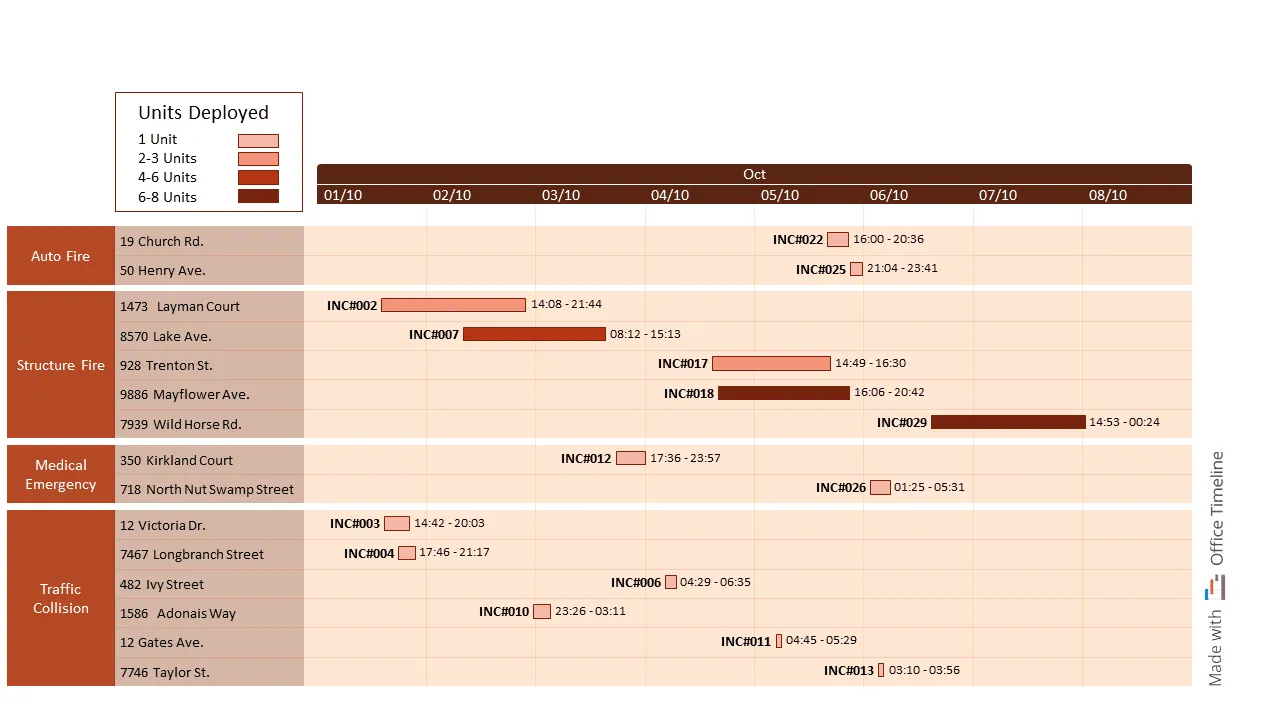
2. Fire incident response timeline
David is the head of the department for the Emergency Medical Services in a mid-sized city in the US. Compared to other project management environments, in case of emergencies, tracking performance and improving resource allocation strategies can make the difference between life and death.
As supervisor of the fire department, one of his main responsibilities is to create weekly timelines of incident response, which he has to present to his superiors in the municipality structures. David relies on the Office Timeline tool to design these professional visuals that not only convey the most relevant incident response data but also have a positive impact on the decision-making process.
The tool’s customization features are the perfect fit for his analytical mind, allowing him to group incidents by type (fire, medical emergency, traffic collision) on swimlanes and add the precise location for each event with sub-swimlanes.
To illustrate the incidents that happened during the week, David used task bars in different shades of the same color (from light to dark) that indicate the number of units required in each case.
He also chose to mark the incident response time by tweaking the task bar lengths and displaying the hours and minutes when the emergency services are first notified and when the incident gets cleared by the emergency response team that arrives at the scene.
Together, all these visual elements enable David to communicate to his superiors how different incidents require different responses (dispatched units, time) in an easy-to-understand format. Last but not least, the incident response timelines he creates every week help secure additional resources for his department, including funds and trained staff. These resources will, in time, increase the quality and efficiency of emergency services provided to the public and save more lives.
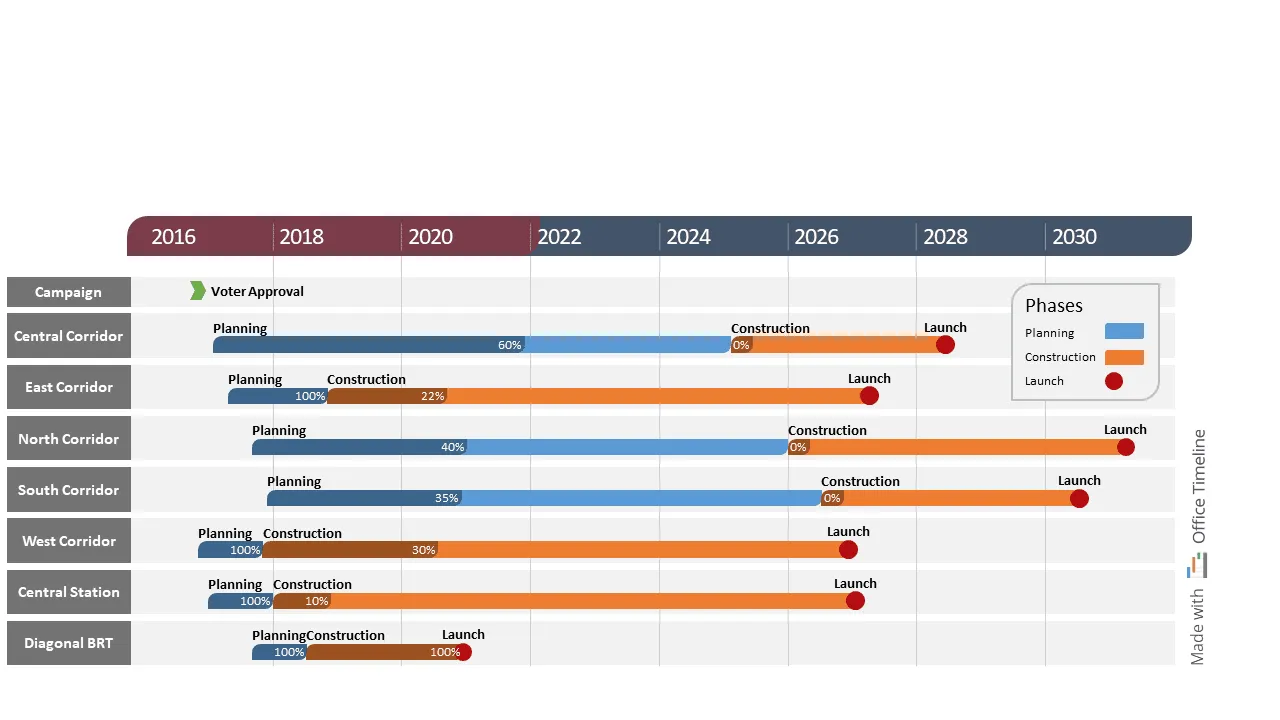
3. Transit expansion program schedule
Helen’s main job as the infrastructure manager for a major metropolitan area in Canada is to oversee the expansion of the transit networks in her city. And managing such an intricate public program comes with a lot of pressure to show her managers and stakeholders that her department is efficiently investing the taxpayers’ money in developing seamless mobility options.
In all honesty, Helen has never completely understood why her manager insisted she prepare a PowerPoint presentation for every meeting. At least not until she used Office Timeline to create a one-slide schedule for the multi-year projects included in the transit expansion program.
For the first time in weeks, Helen felt like a great weight was lifted off her shoulders. All it took was finding the right PowerPoint roadmap tool that provided her with a big-picture overview of the progress and key milestones across long-term projects.
She started by illustrating the major initiatives of the transit expansion program (the expansion of various rail corridors) using swimlanes spanning a large timeframe of 10 to 15 years. Then, she color-coded the main project phases — planning, construction, and launch — for clarity and added percent complete both as a darker shade and as numbers within the task bar.
To anchor the schedule in the present, Helen marked the time elapsed directly on the timeline. This way, stakeholders looking over the program would have a clear picture of the current project status and spot any delays at a glance.
Armed with this project visual she updates regularly using the intuitive drag & drop editor, Helen has stopped feeling anxious when checking her calendar for upcoming meetings. Whatever questions her managers and stakeholders would have regarding the program schedule, she’s got a timeline filled with all the right answers.
Complex projects require simple tools
If you’re curious to see what else you can do with Office Timeline, we recommend you have a look at the collection of timeline templates, roadmap templates, and Gantt chart templates on our website. You can choose your favorite to customize according to your project requirements or create your own template for free.
Download the Office Timeline free trial today and discover how to effortlessly transform data-heavy documents into engaging project visuals that impress stakeholders and keep them updated. Still not sure where to start? Check out our video tutorials and blog section for useful tips and tricks on using Office Timeline to achieve your project goals.
Project management tips and tricks
Tagged With:
Examples by industryTurn project data into professional timelines
Get the advanced features of Office Timeline free for 14 days.
