Managing a software development project properly can be as difficult as it is important. Just like you wouldn’t go to the store blindfolded to randomly pick your groceries for the week, the same goes for IT projects. Without a sound software development Gantt chart template or roadmap that tracks your plan effectively, the entire project can be jeopardized – or at least you end up driving up the cost, missing important deadlines, and frustrating the team.
Here you can find an easily-editable software development Gantt chart template for PowerPoint that you can download for free, as well as a series of useful guidelines and tips to help you start off on the right foot when planning your IT project.
What is the main goal of software project management?
Just like in any other industry, in software development, the main goal of project management is delivering the final product – or feature – on time, on budget, and within scope. This entails careful planning, scheduling, task assignment, and budget allocation.
Of course, good IT project management means more than keeping the time-budget-scope trio in check. It means bringing the team, clients, and other stakeholders on the same page, which can often be particularly difficult in software projects; it means bringing leadership and direction to the project; and, last but not least, it means setting proper expectations regarding what can be delivered and by when.
That’s why, besides good planning, efficient communication is vital to achieving your goals in IT projects – and a visual IT Project Gantt chart can become your trusted ally both when it comes to devising your plan and when it’s time to communicate it.
How do I make a software development plan?
The way you plan a software development project may differ depending on the project management methodology you and your team are using (e.g. Scrum, Agile, Extreme Programming, Rapid Application Development, Waterfall, etc.).
However, there are a few steps most project managers go through when creating an IT project plan, regardless of the methodology they prefer. Let’s take a quick look at them:
- Define the project’s goals. Rather than starting with a fuzzy idea about what your software project aims to accomplish, outlining its goals clearly will make it easy to create a realistic plan for achieving them.
- Outline requirements. Once the goals are well defined, work out what you’ll need to achieve those goals – time, budget, equipment, team, skills, etc.
- Plan the budget. After you have a clear list of requirements, it will be easy to create a rough cost estimate.
- Break down the project into tasks. Starting from the project goals, break down your IT project into small tasks to have a clearer view of what needs to be done to lead the project to completion. These tasks will then be displayed on your software development Gantt chart for easy tracking.
- Assign roles and responsibilities. Identify the people who will be responsible for each task and ensure everyone knows who will be doing what.
- Create the project roadmap. Once you’ve worked out all the basic elements for your plan, it’s time to draw up the project’s roadmap. With all tasks broken down and a look at resources such as the team and budget, you can now estimate the time it will take to finalize the project, set timeframes for each task, and identify important milestones along the way. All these details can be arranged on a simple, easy to follow visual like the software development Gantt chart example available on this page.
What is a Gantt chart and why is it important?
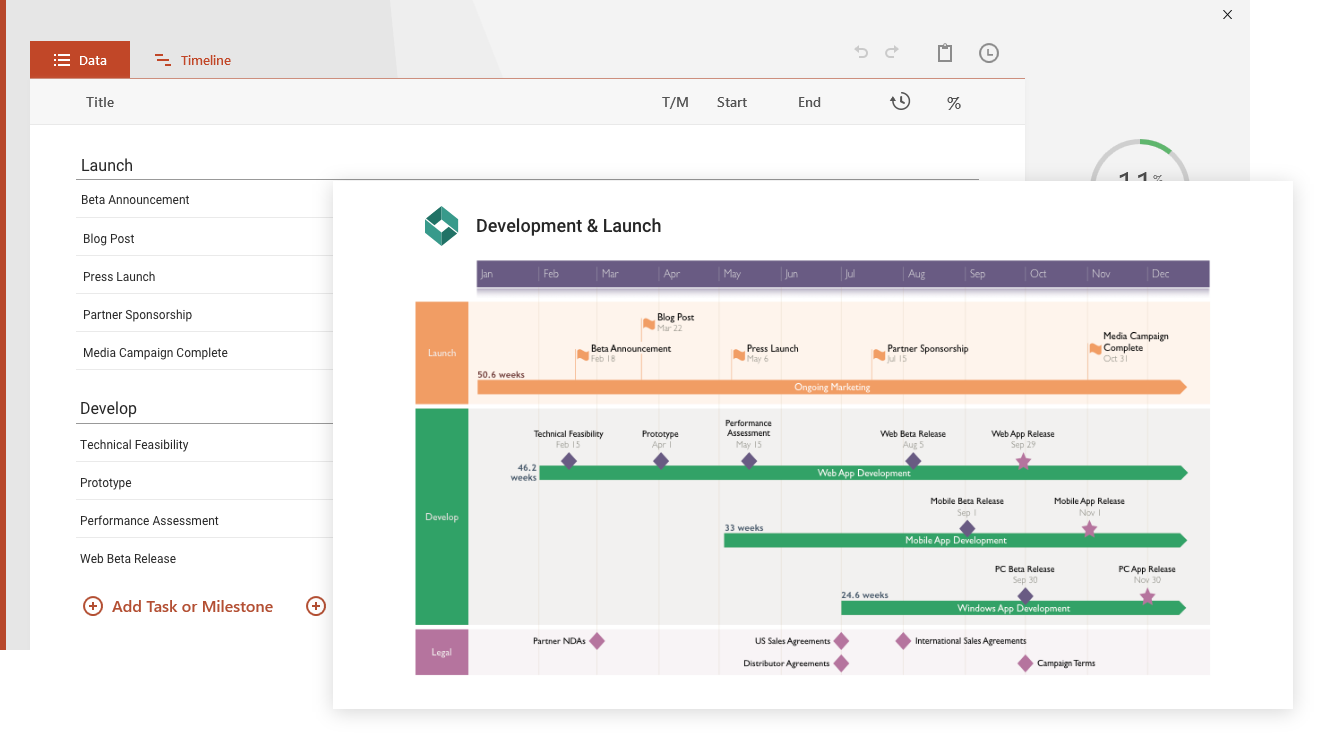
An IT project Gantt chart is a visual representation of project activities displayed against time. It allows you to easily show key information such as the start, end and duration of each task, important milestones along the way, as well as overlapping activities and who is assigned to each activity. For short, a software development Gantt chart can be the perfect ally for planning, managing, and sharing your project in a simple, easy-to-follow manner.
In IT project management, Gantt charts help PMs mitigate constraints and risks within their software development projects, where everything happens much faster than in other industries, and new releases are vital to keeping up with the IT trends and technological advancements. Developer teams have to constantly improve the user experience, fix bugs, and add features, while also concentrating on the latest viruses, security threats and changing regulations.
A software project Gantt chart can be particularly helpful in mapping and tracking all these aspects and, most importantly, in communicating them in a visual way that’s simple to understand for less technical stakeholders too - like clients or executives.
How do I make a software development Gantt chart for free?
Most of the well-known project management software also have an integrated Gantt tool. The IT Gantt chart examples generated automatically by such tools are usually great for the project managers themselves, providing them with a multitude of details they need in organizing their project. However, when it comes to communicating your projects to non-technical audiences, it may be best to use a simpler, more familiar format.
For instance, you can make a visual software project Gantt chart in Excel or PowerPoint, tools that pretty much everyone has on their computer and is familiar with. This way, you won’t have to pay for new apps to share your plan with others or present it in meetings. To move even faster, you can use the free software development Gantt chart template for PowerPoint available for download on this page.
Why use our software development Gantt chart template?
The free software development Gantt chart template was designed to be visual, impressive, and simple to understand for all stakeholders. It is available in two versions – Standard and Widescreen, to be fit for presentations regardless of the slide size preferred or the projectors’ size.
The IT project Gantt chart template aims to help PMs present a clear plan for software development, application rollouts, data management, system migrations, and other IT services. It can be used at any phase in the life of a software development project, starting from the project charter and planning phases to the project execution, control, and sign-off phase.
The software development Gantt chart template can also be used by IT pros to assist in managing their projects. Keeping the template updated and visible will help IT professionals maintain control over project deliverables and important milestones. Directors can also use the template to model schedules or timelines during the planning phase of any project.
Created as an editable PowerPoint slide, the software project Gantt chart template can be edited and shared with anyone who has the popular presentation tool. The slide was also built to work with Office Timeline, a PowerPoint add-in that makes timelines and Gantt charts for project communications. The tool can automatically update this software development Gantt chart example, or it can quickly build new IT slides as fast as project stakeholders are requesting them.
The latest version of Office Timeline, which you can try for free for 14 days, lets you instantly update any of the examples from our Gantt chart templates gallery and even comes with its own built-in samples. It also integrates with project management tools like Microsoft Project, Smartsheet and Wrike, so you can effortlessly turn existing data into a simple and beautiful software development Gantt chart.