Scheduling is one of the most important tasks project managers undertake at the beginning of any project. A well-built visual schedule helps set realistic timeframes, assign resources properly, manage quality, and track progress, which ultimately results in greater customer satisfaction and reduced overall costs.
As a project manager or team leader, you’re probably looking at your schedule chart daily, not to mention reviewing it with colleagues, clients and executives. This makes building it on a strong foundation all the more important.
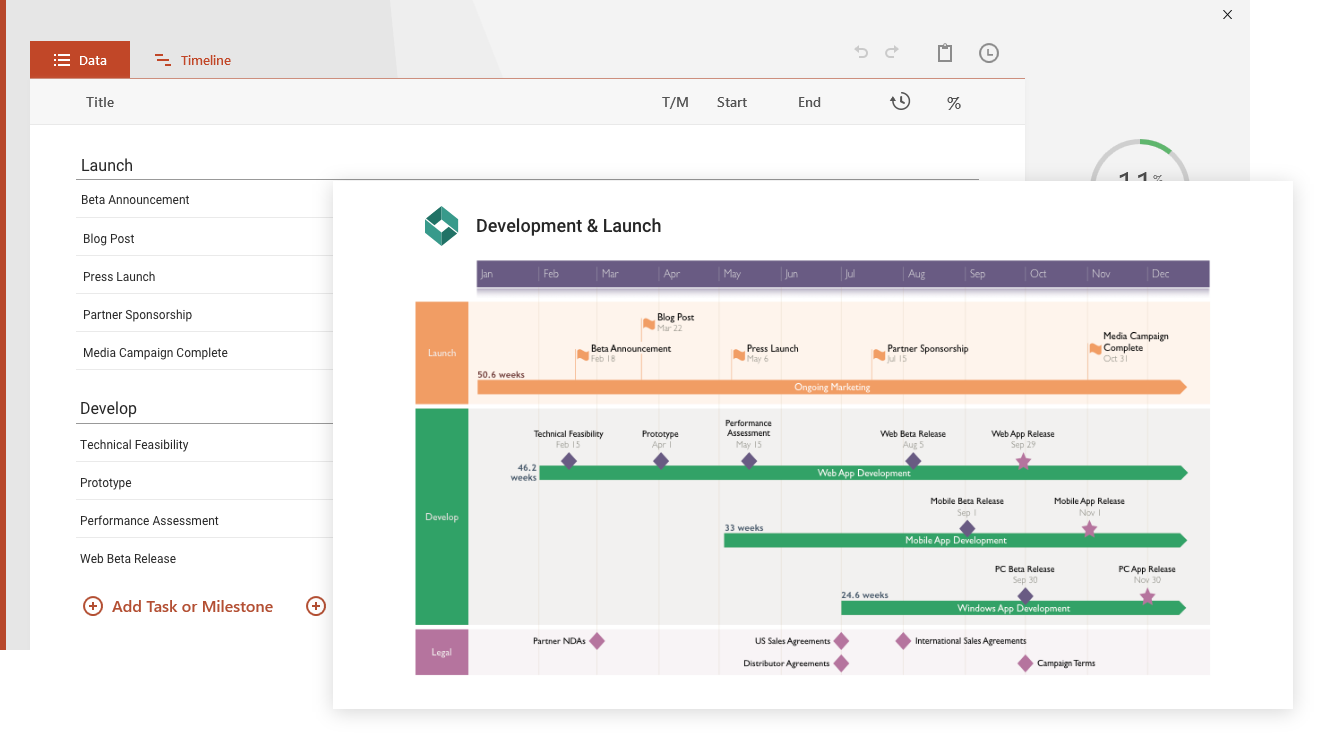
Here you can find a free visual schedule template for PowerPoint to help you define and communicate your project’s timeline more easily. For those of you who are new to scheduling, we’ve also included a few basics and best practices to get you started.
What is a project schedule?
In Project Management, a visual schedule is a document that indicates what work needs to be done and the timeframe in which it needs to be performed so as to complete the project on time. Usually, the schedule chart also tracks progress, so it needs to be updated regularly to help stakeholders understand the project’s current status.
What is included in a schedule graph?
A project schedule chart template typically includes the project’s kick-off and estimated completion date, the start and end date of each task, as well as important milestones. The chart’s data and level of detail can be adapted depending on the audience it’s intended for. For instance:
- For efficient work management within the team, the visual schedule will usually list all project tasks and also include resource allocation (who will be doing what) to help distribute work evenly among team members.
- For business communications or client presentations, it would be best to have a high-level schedule that includes just the key activities and primary deliverables. Clients and executives don’t have time to review detailed, complicated data. They prefer a simple summary that is easy to follow and fresh to look at - something similar to the visual schedule template provided on this page.
What makes a good project schedule?
While schedule graph examples can vary greatly, there are a number of specific attributes that characterize most good schedules. Here are the top 5:
- It is visual. Regardless of how technical we are, our eyes process visuals better faster than text or tabular data. This is why colorful, visual schedule examples – such as a Gantt chart calendar or a project timeline – are preferred by most audiences.
- It documents red flags. Seasoned project managers know how important it is to keep an eye on possible red flags. A proactive Gantt chart schedule that documents potential obstacles along the course of the project will help you and your team adjust before things get off the track, instead of just reacting to whatever problems arise.
- It includes revision times. Even though client or exec reviews are inevitably followed by revisions, many project managers include only the reviews themselves in their visual schedule, without appointing time for revisions as well. This omission can lead to delays, which is why it is safer to add revision times right into the work schedule chart.
- It has slack time built in. No matter how many red flags you are able to document in advance, you know the unexpected is something you can always count on. This is why intentionally building slack time into your schedule template is a slick way to avoid project delays.
- It is flexible. Since plans change often, it is important that your schedule chart allows for quick and easy updates. For instance, you may need to fast-track a project to keep it on schedule – i.e. to rearrange the plan so that tasks that were scheduled in sequence are reassigned to be completed simultaneously. In such instances, it will be practical to have intuitive Gantt chart scheduling software that can help you make such changes without too much hassle; for presentation purposes, you can use a flexible visual schedule template such as ours.
How do you design a visual schedule?
There is no standard way to design a visual schedule. It can be tabular, it can look like a Kanban board, or it can be set up as a diagram or a Gantt chart, like the schedule chart template on this page. Out of all styles, Gantt chart templates seem to be the most popular, as they’re easy to follow and can apply to a variety of project management methods.
Whatever format you choose, there are a few best practices worth considering when you make a visual schedule:
- Keep it simple. Whether you’re building a summarized schedule for clients and management or a more detailed Gantt calendar for your team, it is best to avoid overcrowding it with unnecessary data. A complicated visual with an excessive number of tasks or details is not only hard to grasp, but it can also become unmanageable. In the case of large-scale projects, one solution would be to create a one-page high-level schedule that can act as a template, which you can then break down into multiple sub-schedules.
- Encourage the eye to focus on key data. This can be done by varying colors, shapes and sizes. For instance, a big, red flag-shaped milestone will stand out at first glance if all other milestones have milder colors, different shapes, and smaller sizes.
- Use color-coding. Color-coding can help you provide extra information without actually adding more data to the visual schedule. For instance, it can help you visually group tasks by assignees (use a different color for each team member), highlight the critical path, or communicate the health of your project in status reports. You can use the classic RAG scheme for project health (red = problems, amber = potential issues, green = all good) or even create your own color codes for a more stylish look, as long as you use them consistently.
Why use a visual schedule template?
Even if you use Gantt chart scheduling software to manage your projects, when it’s time to communicate your schedule, it’s best to use a visual schedule template to help you present your data in a simple, convincing manner. A template will not only save you time and effort designing an impressive schedule, but also provide consistency across project visuals.
Our free, downloadable schedule chart template was made in PowerPoint using the Office Timeline Add-in, an intuitive Gantt chart and roadmap maker that makes visual scheduling simple. Created as a native PowerPoint slide, the template can be easily edited with new data, presented in meetings, and shared with stakeholders.
Use the free visual schedule template to easily make high-level schedules for client meetings or to communicate your project’s calendar within the team. When plans change, you can easily update the slide using PowerPoint’s controls, or you can try the Office Timeline add-in to automate the process and save even more time.
Using the 14-day free trial of the tool’s latest edition, you can even import data from popular scheduling software, like Project or Excel, and bring it straight into this PowerPoint template to generate a professional-looking visual schedule in seconds.