As a seasoned project management expert, you understand that not all projects are created equal, and some demand a more strategic approach, particularly when dealing with the multifaceted challenge of project complexity.
Whether you’re handling intricate timelines, diverse stakeholder interests, or tricky technological integrations, this guide will equip you with the insights you need to manage project complexity and deliver successful projects.
Why is project complexity so important?
Roger Spit, the author of The Definitive Guide to Thriving on Disruption once wrote that “In a systemic world, there is no such thing as a discrete or isolated event – impacts cascade and spill over.” This idea perfectly frames the nature of complexity as a phenomenon emerging from the interconnectedness of all things and dismisses the notion that we can ever hope to understand systems just by analyzing its elements separately.
At the same time, there is a substantial body of evidence that attests to the growing complexity of our projects in virtually every field AND its negative effects on performance, from construction and engineering to science, technology and medicine. Project complexity is therefore both an unquestionable reality and a proverbial monkey wrench in the works. So, what are we going to do about it?
In this blog post, we will take a closer look at complex systems, their properties, and a few ways to understand and reduce complexity with models like Cynefin, VPEC-T, I-Space and SECI and VUCA. We will also discuss complexity in the context of project management and find out how project visuals can help simplify it.
Let’s start by discussing what we mean by complex systems.
1. Introduction to complex systems
The formal exploration of complex systems can be traced back to the late 40s, in disciplines like advanced mathematics, informatics, engineering, physics and perhaps unsurprisingly, meteorology. Findings from these studies have later been extrapolated to other applicable fields, including ecology, social science, immunology, and financial markets, to name a few. But what are they?
1.1. Definition of complex systems
We still lack a concise, exhaustive definition of our concept; there is very little consensus even among scientists. In a resource letter sent to the “American Journal of Physics” back in 2011, renowned physicist Mark Newman wrote that “there is no precise technical definition of a complex system” but that “most researchers in the field would probably agree that it is a system composed of many interacting parts, such that the collective behavior of those parts together is more than the sum of their individual behaviors.”
A similar attempt to formalize complex systems comes from the author of “Modelling complex systems” Nino Boccara, who views them as:
- Comprising of heterogenous agents and elements interacting with each other;
- Displaying self-organizing behaviors that are hard to predict (emergence);
- Showing no correlation between the emergent behavior and a centralized controller.
In other words, a complex system has many variables that interact with each other in unpredictable ways without the need for top-down interventions. Here Boccara is attempting to define complex systems through their inherent properties.
Let’s find out more about the characteristics of these systems in order to get a better understanding.
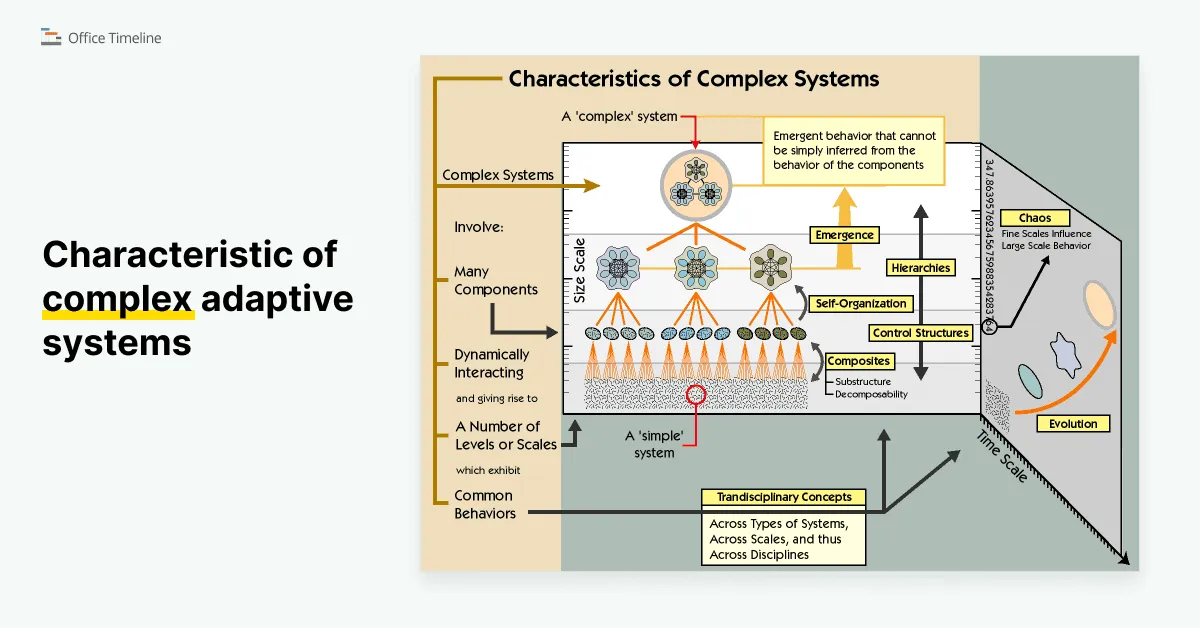
1.2. Properties of complex systems
Characteristic of complex adaptive systems, a model by Marshall Clemens
We now know that it is difficult to paint a clear picture of what a complex system really is without resorting to discussing its features, so let’s enumerate them:
- Open – complex systems are in flux rather than in equilibrium, and are connected to adjacent systems, but they do display a certain pattern of stability (E.G., open thermodynamic systems that dissipate energy over time);
- Subject to critical transitions – abrupt and significant changes to the normal state of the system may occur under certain critical conditions (E.G., sudden changes in ecosystems with dramatic effects on the existing flora and fauna);
- Nested – each component can be a complex system of its own, with all the properties listed here (E.G., economies that consist of fiscal entities, which in turn consist of individuals);
- Dynamic networking – connections between local elements are more numerous than between distant ones (E.G., topological connections of neurons in the human brain);
- Emergent phenomena – studying the discrete elements of the system is not enough to determine the results of their interactions (E.G., the social behavior of eusocial insects like termites that cannot be explained by any individual’s physiology and biochemistry);
- Non-linear relationships – it is difficult to anticipate whether a perturbation in the system will trigger proportional, disproportional, or no effect at all (E.G., the Butterfly effect in climatology);
- Feedback loops – the behavior of an element will affect the element itself (E.G., feelings of anxiety and fear leading up to an important event may negatively affect the outcome, inadvertently confirming the source of anxiety).
1.3. Understanding projects as complex systems
There has been a significant increase in project complexity over the last few decades, in terms of their unique internal structure and the external context in which they exist. Project managers have to be mindful of multiple variables, such as:
- Environmental factors;
- Social conditions;
- Safety and security;
- Number of stakeholders;
- Technical issues;
- Organizational characteristics.
Furthermore, the extensive size and scope of modern-day enterprises paired with rapidly evolving technologies are posing major challenges. We can definitely analyze projects through the lenses of complex systems because they:
- Exist as components of dynamic and evolving environments, and are organized around key players and teams that also change and grow;
- Rely on the pooling resources, instruments and deliverables often under the management of different stakeholders with distinct (and potentially conflicting) interests;
- Evolve over the course of time by way of experience gained, deliverable improvement and resource usage, but maintain the original identity.
To put it plainly, attempting to anticipate, manage and even comprehend intricate project behavior at any given moment is quite challenging. The reality is that, while we can definitely notice trends and patterns, our understanding of any complex enterprise will be incomplete and marred by uncertainty.
Consequently, we cannot rely on best practices and traditional management strategies; applying a systems-oriented approach is necessary in dealing with complex projects.
Next, let’s discover the impact of complexity on the PM field.
1.4. Significance of complexity in the context of project management
There are multiple reasons to acknowledge complexity as critical factor in PM that have been highlighted by literature and studies:
- The difficulty of identifying objectives and goals is directly proportional to the level of complexity of the enterprise;
- Properly evaluating complexity plays a major role in planning and coordinating the project;
- The level of complexity should be considered when selecting the experience prerequisites of managers and teams handling the workload;
- It can be used to identify the optimal framework and arrangement style of the project;
- Complexity is directly correlated with project outcomes, risks, expenditures, quality of deliverables, etc.
In the light of these findings, it becomes clear why identifying models of understanding complexity (and devising means to reduce it) should be a priority for project managers.
2. Understanding project complexity
2.1. Project complexity types
As a property of projects, complexity interferes with our ability to foresee and control the outcome of work carried out, in spite of having reasonably accurate and exhaustive data.
This effect is in large part due to the multiple ways in which the components of a project interact with each other to create emergent arrangements, as well as their dynamic and evolving nature. Most literature identifies two types of complexity that can affect projects, structural and dynamic. However, we’d also like to bring to the table a third one, identified by Stephen Carver, which is socio-political complexity.
Let’s elaborate a bit on each of them.
Structural
This one is perhaps the most intuitive type, and it comes from the number of interconnected parts in a system. Structural complexity is usually defined in terms of how large and varied components are, but also accounts for the dependencies between them.
The source is usually found in technical factors (recently integrated physical equipment or software, implementation of new processes for the first time, complex technical roles, regulations, etc.) as well as organizational factors (intricate or large number of business processes, too many critical path activities, poor communication and unclear project roles, numerous stakeholders, etc.).
Dynamic
The interaction of the previously discussed factors involved in creating structural complexity gives rise to emergent phenomena that further complicate things. Dynamic complexity is characterized by unforeseen issues or unknowable, uncertainty and ambiguity.
Socio-political (directional)
The stakeholders’ conflicting interests and personal agendas paired with a lack of transparency makes up the bulk of factors generating socio-politic complexity in projects. On top of that, resistance to the adoption of new processes within the organization and cultural differences further exacerbate confusion. Project managers have a hard time aligning agendas behind a single project vision.
2.2. Factors in evaluating project complexity
Ideally, the time to evaluate the complexity of a project is in the planning stage because this is when resources are allocated. Establishing a profile of complexity early will improve the decision-making process and clarify objectives.
We will delve into a few of the most popular project complexity frameworks in the next chapter, but for now let’s look at some of the variables that carry a lot of weight:
- Number of members and teams involved;
- Number of components and processes;
- The intricacy of the project’s design;
- Transparency in communication across the board;
- The geographical distribution of the actors;
- The role of all the actors and how well they’re defined.
Let’s move on to discussing the frameworks we can use to evaluate different dimensions in the sphere of project complexity.
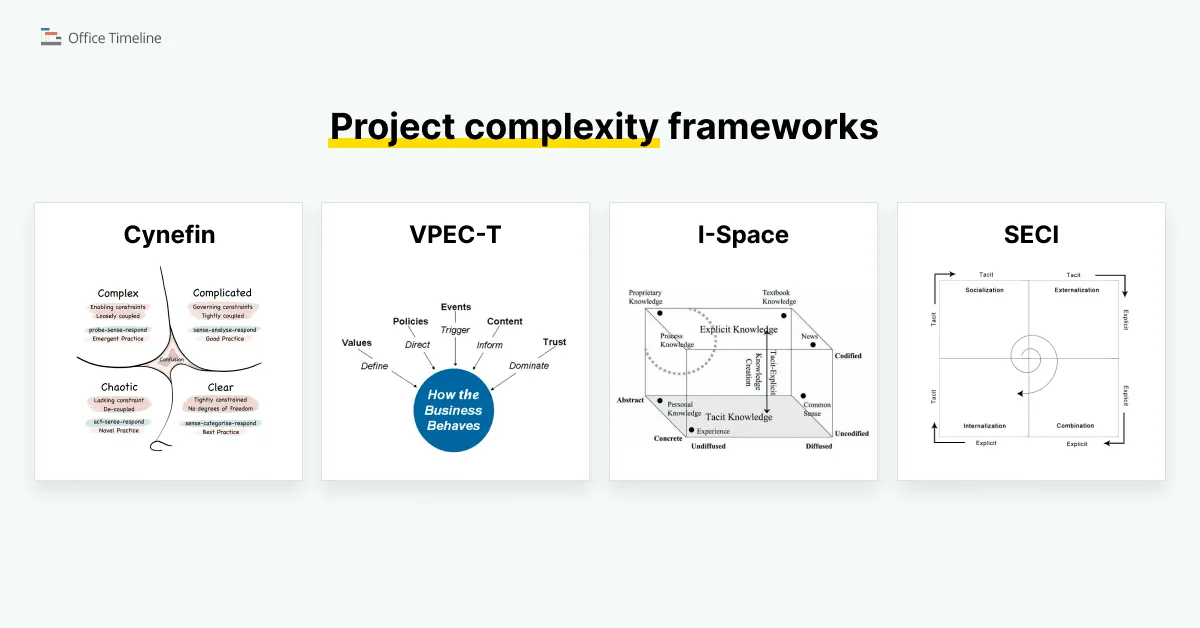
3. Project complexity frameworks
In this section, we’ll discuss a few models that attempt to explain:
- How complexity arises in project management;
- The source communication breakdowns and conflicts, and how to get on the same page when multiple stakeholders are involved;
- Types of knowledge and knowledge transfer mechanisms.
Let’s take them one by one and dive deeper into what makes them interesting.
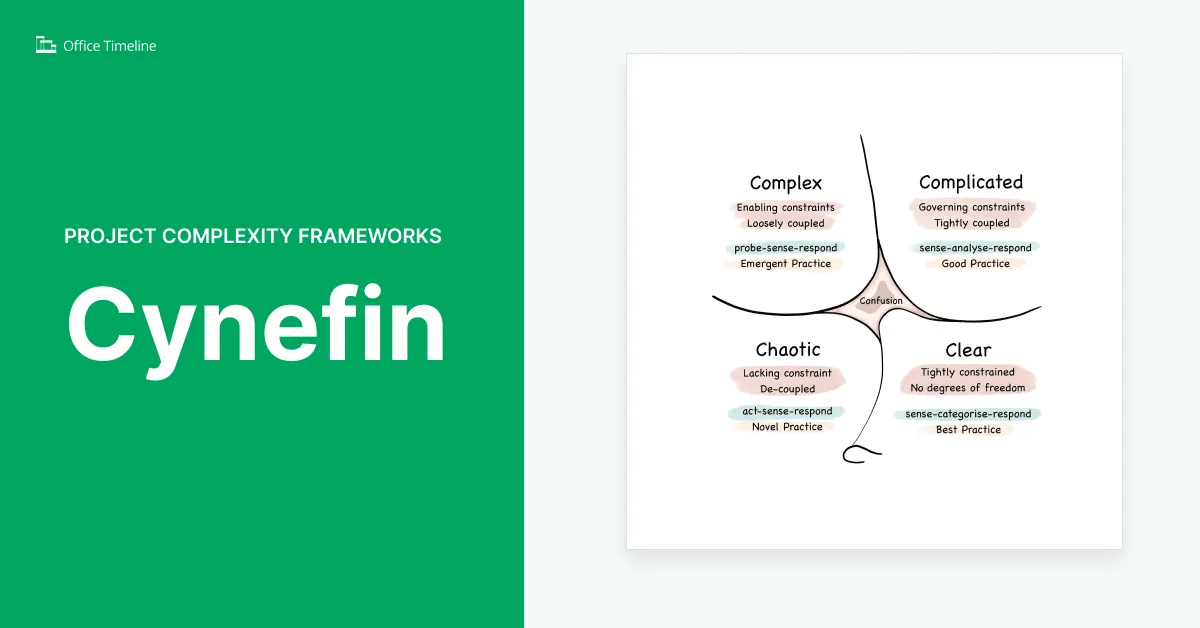
3.1. Cynefin framework
This conceptual framework was developed back in 1999 by Dave Snowden during his time at IBM. The name Cynefin (pronounced “kuh-nev-in”) comes from the Welsh word for “habitat” (other meanings include “familiar”, or “acquainted”). Snowden wanted to give decision-makers a grounding place from which they can observe their own perceptions of a situation, the other agents involved and their behaviors.
The word Cynefin hints at the notion that everyone carries connections to the world (tribalistic, religious, geographical, political, emotional, etc.) that aren’t immediately evident, until we observe ourselves from a grounded position.
In the current framework, this grounded position can be in one of the following five contexts or domains:
Clear
The clear domain is definitely the ideal place to be, and it’s characterized by “known knowns”, I.E. by clear and stable relationships between causes and effects. Approaching clear situations should be done by ascertaining factual information, categorizing it accordingly and operating in accordance with proven best practices (sense-categorize-respond). On a side note, the authors of the framework warn managers about the dangers of oversimplifying a situation in order to fit it into the clear domain.
Complicated
In this domain PMs are dealing with “known unkowns”, or put another way, they can identify the relationship between cause and effect only by conducting the right analysis or with the necessary expertise. The recommended course of action is to establish factual information, perform an analysis of the available options and utilize good practices (sense-analyze-respond).
Complex
Moving further away from the realm of intuitiveness and standardized practices, we find ourselves in the complex domain, where “unknown unknowns” abound. It’s possible to deduce the relationship between cause and effect ONLY in retrospect. The optimal way to identify informative and usable patterns is by running experiments that are safe to flop or underperform (probe-sense-respond).
Chaotic
Any form of clarity about cause and effect is absent from the chaotic domain, even in retrospect. To make things worse, there’s no time to look for a knowledge-based way of responding; taking ANY form of action to establish order and bring about a level of stability is the only available option (act-sense-respond). The goal is to move from the chaotic domain to the complex one, where you can then begin to experiment.
Confusion
In the chaotic domain, there is still a sense of where you are, but in the dark center domain of confusion there is zero clarity even regarding that; you have no clue about the domain that applies to the situation. The only chance to escape confusion is to break apart the situation into separate contexts and determine what fits where. Then, delegate the constituent parts of the context to different leaders and let them intervene as required.
On a diagram, the Cynefin framework looks like this:
Source: Cynefin framework, Wikipedia
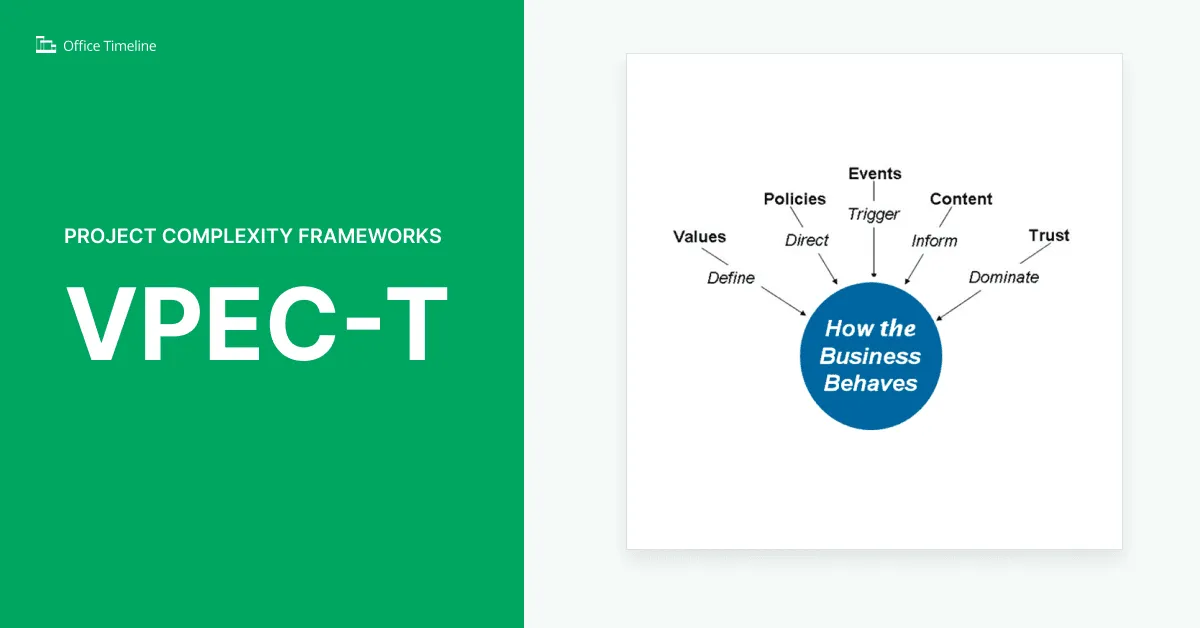
3.2. VPEC-T model (later known as VIPER)
The VPEC-T model developed by Carl Bate and Nigel Green was designed to combat the negative impact of multiple conflicting viewpoints in the design of information systems. The premise of this model is that friction in enterprise architecture (EA) often arises because different entities (specifically business needs and IT solutions in their case) lack a common language and a lot of what is said gets lost in translation.
This framework applies a set of mental filters and guides to simplify communication; it is particularly useful when multiple agents with dissenting viewpoints, priorities and responsibilities need to collaborate in order to achieve their goals.
This is what the VPEC-T model looks like:
VPEC-T model by Carl Bate and Nigel Green, Lost In Translation: A handbook for information systems in the 21st century, 2008
The VPEC-T acronym stands for:
Values
In our context, value represents the desired outcome, both from an individual’s perspective and the business standpoint. Briefly put, it covers what everyone engaged in the project wants to get out of it. The idea here is that, if all interests are aligned from the start, an accurate representation of the overarching goals is easier to flesh out.
EXAMPLES: better complaint handling, reduced production costs, quicker turnaround on orders.
Policies
Policies cover internal and external regulations that impose limits on what a project can and should achieve. These rules can be either explicit or implicit, and the VPEC-T analysis aims to bring all of them to the foreground, in order to ensure they are implemented correctly in the planning and design stages.
EXAMPLES: export regulations, weight limit on orders, use of personal data.
Events
We refer to any set of business actions that trigger under specific relevant circumstances as events. Because events stimulate activity, they are an integral part of the VPEC-T analysis.
EXAMPLES: receiving a purchase order, automatically generating a report on specific system failures.
Content
Content (also referred to as information) is any pertinent data resulting from business activities, including email exchanges, technical documentation, meeting minutes, etc. Its primary use should be driving decisions and elaborating plans based on previous experience.
EXAMPLES: a new employee’s level of access to the company systems, order shipping processes, calls regarding a specific product feature.
Trust
Studies have shown that trust between agents interacting with a system and the system itself is critical to business operations. In VPEC-T, trust (or the lack thereof) and credibility are directly related to the risks of an enterprise. The values assigned to this component are likely to fluctuate over time, based on the actions of agents involved.
EXAMPLES: hidden agendas of certain system users, employees abusing customer records.
Note: VPEC-T was “updated” to VIPER (Value, Information = Content, Policies, Events, Reliance = Trust) by Nigel Green and Matt Pearce. The framework itself was not changed in any fundamental way. It’s just easier to remember.
The applications of this framework now extend past the design of data infrastructure, to fields such as:
- Criminal justice systems;
- Staff evaluation interviews;
- Departmental restructuring within organizations;
- Evaluating business decisions.
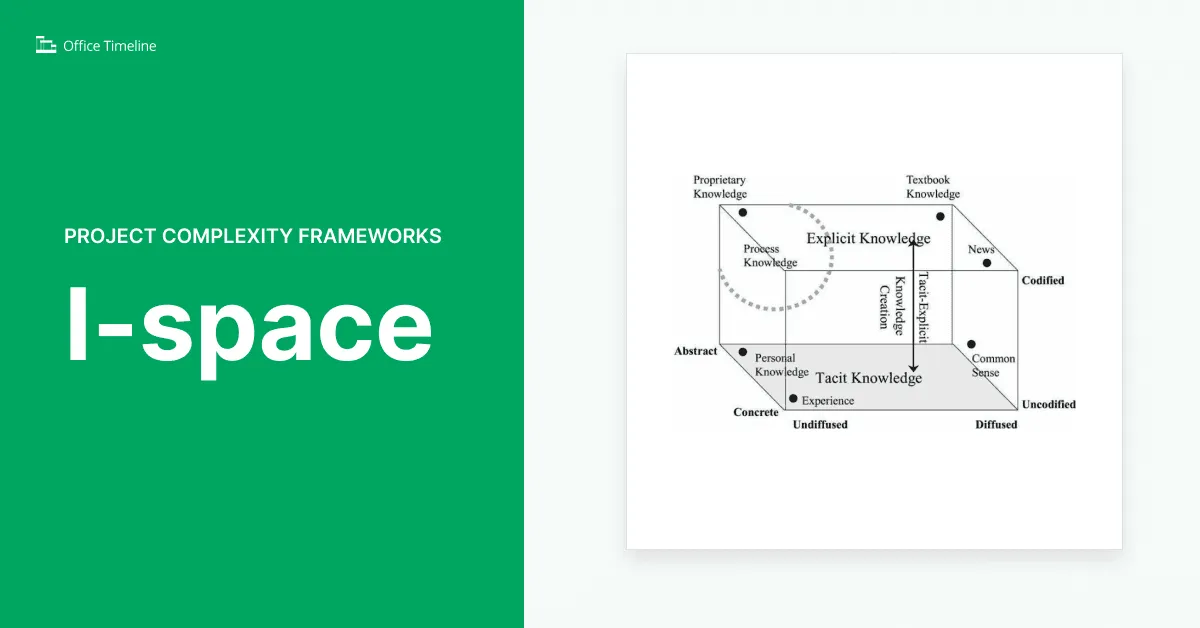
3.3. I-Space
Information Space, or I-Space for short, is a precursor to the Cynefin model discussed earlier and it was created by Max Boisot. This tridimensional framework analyzes the relationship between the way data is structured and codified, the level of abstraction, and the ease of diffusing (distributing) information. We can call this exchange of information a “data economy”.
I-space model by Max Boisot, Knowledge Assets: Securing Competitive Advantage in the Information Economy, 1998
The axes on which dimensions of information are represented, as seen on the graphic above, are:
- Concrete – Abstract;
- Codified – Uncodified;
- Diffused – Undiffused.
Boisot’s model divides knowledge into 4 different categories:
- Public: is codified and distributed, meaning that it has fixed formats and is widely available (manuals, newspapers, textbooks, etc.);
- Proprietary: codified but not distributed, the owners impose limits on who can access it (state secrets, patents, internal documents within organizations, etc.);
- Personal: neither codified nor distributed (biographical data);
- Common sense: widely distributed but not codified, covers what everyone knows in one form or another (parents are older than their offsprings, cats can’t operate heavy machinery, etc.).
In order for learning to occur via information diffusion, knowledge needs to first move from personal understanding (uncodified, concrete) towards codified and abstract. This transition requires a standardized medium that all participants involved in the process share and understand, so that the presence of the original knowledge holder becomes superfluous to the transfer.
EXAMPLE: creating technical documentation for the code (concrete) that uses expert level language (abstract) to explain the role of specific programming functions, so that newly hired developers are able to understand how all the pieces fit together.
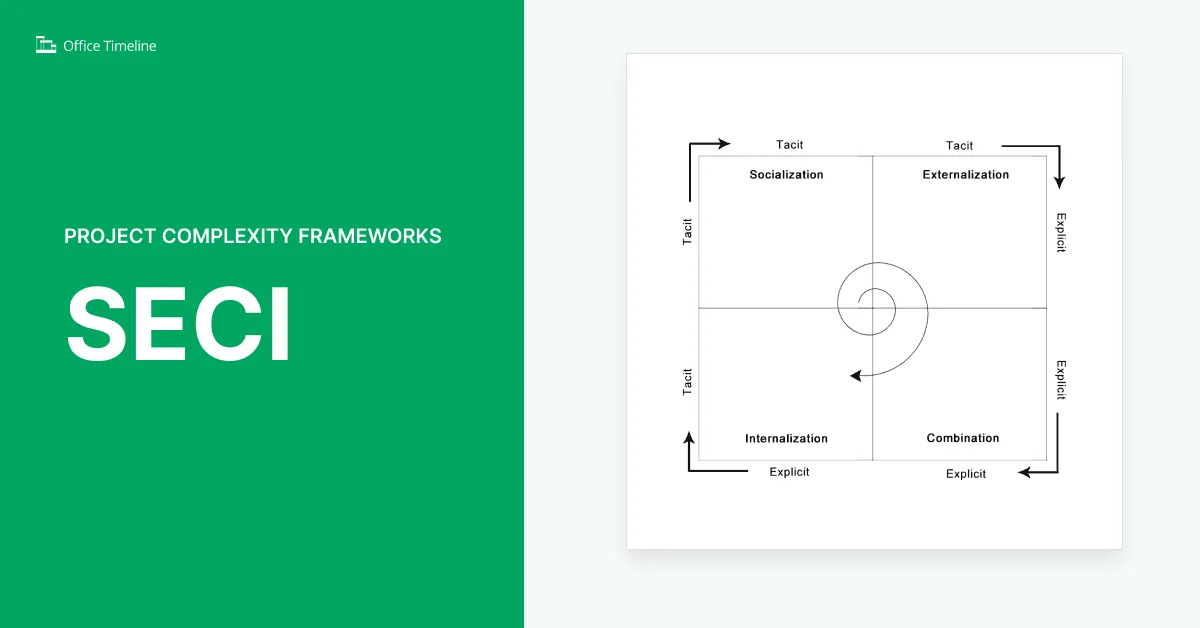
3.4. SECI model
The SECI framework of knowledge dimensions was developer originally by Ikujiro Nonaka back in the 1990s and enhanced later on by Hirotaka Takeuchi. This is why it’s sometimes referred to as the Nonaka-Takeuchi model. SECI is a bidimensional diagram that segments employee knowledge into explicit and tacit.
The SECI model, Nonaka and Takeuchi, The Knowledge - Creating Company: How Japanese Companies Create the Dynamics of Innovation, 1995
Using this twofold categorization, the SECI framework explains the transfer of existing and the creation of new knowledge in four different ways:
Socialization (tacit-to-tacit)
Socialization is all about distilling knowledge by observing, imitating and hands-on practice (such as in the case of apprenticeships). Pre-existing tacit knowledge (such as a senior colleague’s expertise, for instance) is transferred to the observer(s) by way of physical proximity within the organization.
Externalization (tacit-to-explicit)
In the case of externalization, previously tacit knowledge is standardized into a format that can then be shared with others, whereby creating the foundation for fresh knowledge. This transition renders the information easier to absorb and usable by others in the form of largely comprehensible visuals or documentation.
Combination (explicit-to-explicit)
Combination represents the organization and integration of various types of existing explicit knowledge into the workflow. The information is sourced from both inside (E.G. teams, departments, management, etc.) and outside the organization (E.G. clients, partners, etc.), then processed and reshaped into new knowledge.
Internalization (explicit-to-tacit)
The result of hands-on-practice, internalization is the process through which workers absorb explicit knowledge and integrate it in their jobs. At the same time, both individuals and teams will continuously reflect on the information gathered and become able to see patterns and connections, making sense of notions from fields outside their expertise.
Next, let’s delve into a more complex framework that encompasses four dimensions through which enterprises can evaluate both contingencies and prospects: VUCA.
4. VUCA
4.1. History of VUCA
Originally developed back in ’85 by Warren Bennis and Burt Nanus in the work “Leaders. The Strategies for Taking Charge”, the VUCA framework was mainly aimed at addressing challenges in the corporate environment.
However, it really took off in the early ‘90s when the US Army College saw its potential in dealing with the aftermath of the collapse of the USSR.
The fall of the Eastern Bloc had transformed a single, unified threat into a volatile and disjointed pool of complex state relationships marred by political uncertainty and decision ambiguity. But this was precisely what the instrument created by Bennis and Nanus excelled at.
Flash forward to the early 2000s, VUCA became widely adopted by strategic leadership in enterprises, from NGOs to corporations and the education system.
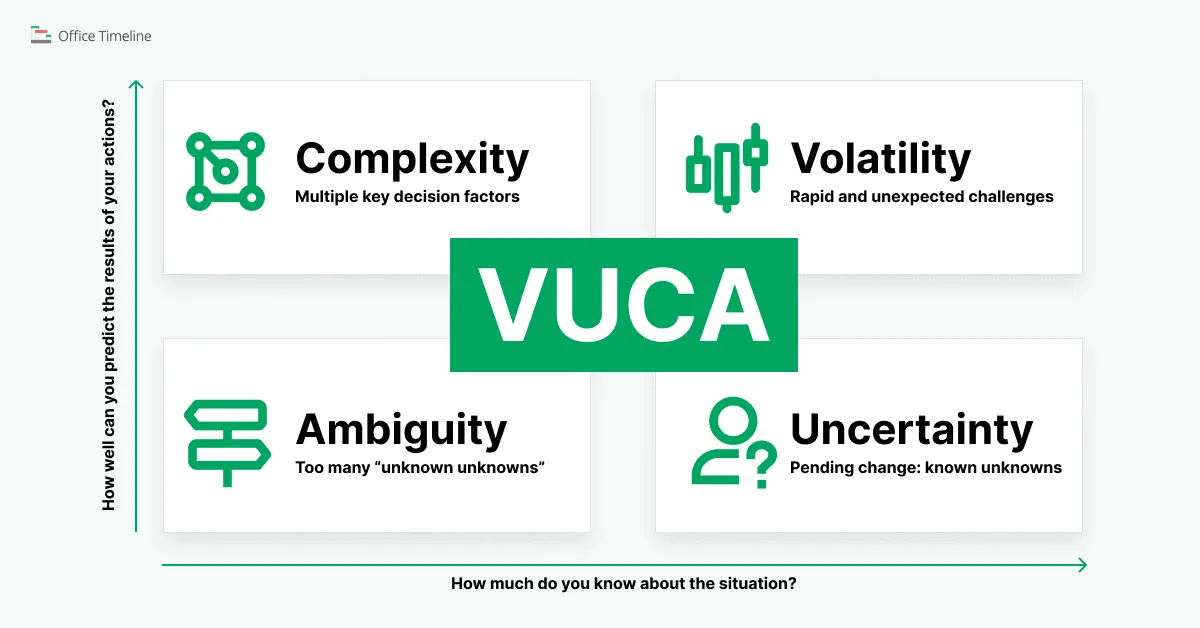
4.2. The VUCA acronym
VUCA is an acronym that describes the world in constant state of flux and it stands for:
Volatility
The notion of volatility describes the rapid, intense, and unpredictable fluctuations in a system over a short period of time. One great example in this case is the stock market, where even the tiniest decision of an important trader can erupt into a chain reaction of wildly variating prices across the board. High volatility entails frequent and more violent peaks and lows.
Uncertainty
VUCA’s uncertainty concept is used to describe a context where surprising and unpredictable events unfold. A system with high uncertainty is difficult to plan and prepare for, as the present is perplexing and the future inscrutable.
Complexity
This framework utilizes pretty much the same definition of complexity as the Cynefin model that we’ve discussed earlier. In short, it’s not just about the number of moving parts, like in complicated systems, but also about the emergent nature of phenomena resulting from the interaction of said parts. The more complex a system, the more “unknown unknowns” you’ll be dealing with.
Ambiguity
Ambiguity is a consequence of complexity paired with potential misunderstandings stemming from either lack of data or multiple interpretations of the same information. When individuals and teams are not on the same page with regards to a situation, there’s no clarity or consensus about the best course of action.
4.3. Significance of VUCA in project management
It’s important to note that not all fields and industries are equally vulnerable to the challenges highlighted by the VUCA acronym; certain ones are inherently more stable or governed by regulations that limit fluctuations and randomness.
However, the current state of our business world and the geopolitical precariousness of today has led many experts to anticipate a prevalence of VUCA environments in the years to come.
Some of the ways that a VUCA-dominated context can hinder your enterprise’s progress and performance include:
- Anxiety and loss of motivation caused by the lack of stability;
- Resources squandered on dealing with constantly arising and unpredictable challenges;
- Decision paralysis and overwhelmed employees;
- Impossibility to chart career paths and a negative impact on the internal culture;
- Poor decision making and detrimental effects for long-term projects.
Therefore, continuing with business-as-usual in a VUCA dominated environment can be a serious miscalculation with dire repercussions. Fortunately, there are ways to mitigate the seemingly inescapable web of chaos and even use these effects to your advantage.
4.4. Better project management in a VUCA-dominated environment
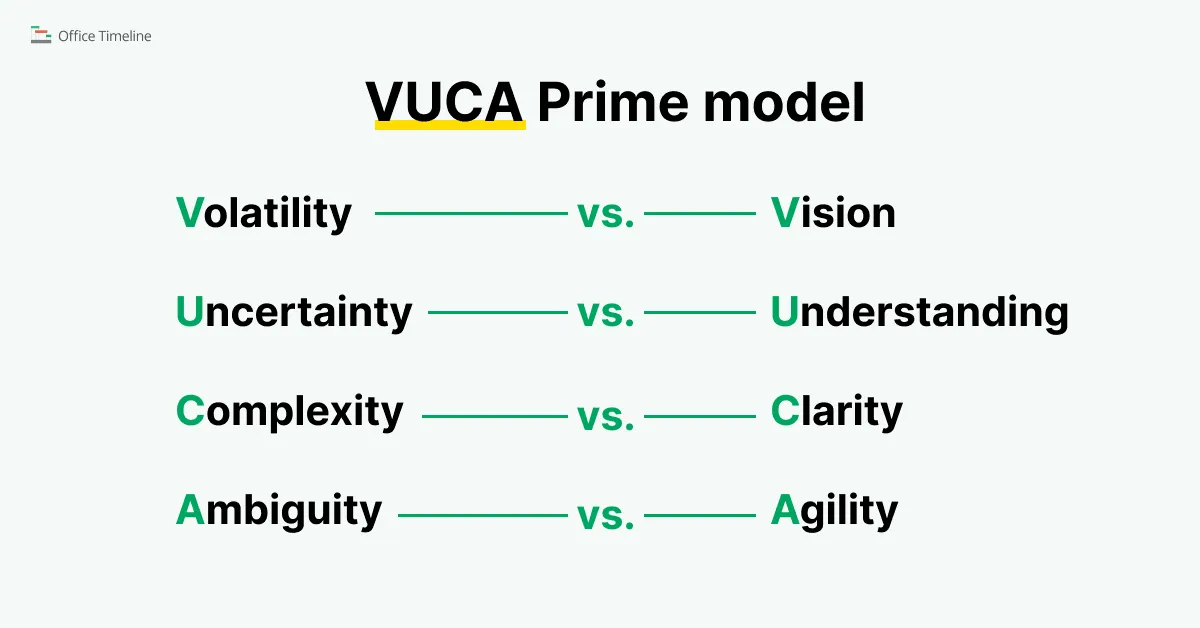
For this section, we’ll take a page from Bob Johansen’s 2009 book, “Leaders Make the Future: Ten New Leadership Skills for an Uncertain World”. Johansen came up with a response model to address the VUCA challenges, which he referred to as VUCA Prime.
It’s definitely not a step-by-step guide (we’ve already covered the ineffectiveness of fixed and rigid strategies in a complex world), but rather a set of values that counters the challenges highlighted by the VUCA framework. Let’s take a closer look.
Vision vs. Volatility
Accepting and even embracing change as the only true constant in the universe rather than resisting it at every turn is lesson number one. However, it’s also true that you can’t allow yourself to be swept away by the current and drift aimlessly towards unknown shores; you need a guiding compass.
The “compass” can be in the form of compelling business values and objectives, and a clear and unified vision that aligns the entire team behind it. In turn, this allows PMs to keep individual roles and goals flexible, making it easier to navigate uncharted territories.
Understanding vs. Uncertainty
Here, Johansen recommends taking a step back and looking at the entire context from various angles. Use multiple types of reports, business intelligence, industry news and your customers’ opinions to paint a comprehensive picture of your project’s environment. Is the situation really that uncertain or is your puzzle missing a few critical pieces?
Next, conduct reviews of your enterprise’s performance, looking at what went well, what could be improved and the things that were a total surprise. Based on the data, you can begin to anticipate future problematic scenarios and solutions, with tools like crisis management planning, brainstorming, game theory and roleplays.
Clarity vs. Complexity
Clear communication is the enemy of confusion, and a project manager’s best bet in handling complex situations where misunderstanding typically results in friction and resistance. At the same time, clarity and transparency are fundamental in developing teams and promoting a collaborative approach between them.
By definition, a VUCA-driven context is far too complicated to manage individually; navigating it requires flexible partnerships based on trust between everyone involved.
Agility vs. Ambiguity
The Agile methodology is uniquely equipped to handle VUCA environments, thanks to its flexible and adaptable nature, reliance on self-governing practices rather than top down management, and accent placed on diversified, cross-departmental skillsets. By encouraging everyone to speak up and share ideas (also rewarding those who show vision, clarity and initiative) you are essentially ambiguity-proofing your organization.
Note: In a high ambiguity context, building in redundancies and creating contingency plan ensures you’re never caught off guard completely.
4.5. Opportunities in a VUCA world
Left unchecked, the challenges posed by VUCA are enough to overwhelm and exhaust your resources, both human and physical. The same goes for trying to fight it head on. On the other hand, by accepting its immutability, you can begin to perceive it as an opportunity to grow on an individual level, but also as an organization.
Here are a few examples of benefits that you could derive from a correct approach:
- Improved leadership skills earned from creating a trust-based relationship with (and within) teams against VUCA threats;
- The ability to view complexity and uncertainty as drivers for innovation and creativity rather than insurmountable obstacles;
- Improved decision-making processes resulted from delving deeper into the available historical data;
- Opportunities to look for and identify better alternatives instead of relying on outdated business processes;
- The chance to build a better organizational culture populated with solution-oriented individuals who thrive in environments that require an outside-the-box type of thinking.
4.6. Obstacles to implementing a VUCA-oriented style of project management
Resistance to change is perhaps the most common sticky wicket that project managers will encounter, but this holds true for virtually any attempt to implement new policies in the workplace.
The quick pace at which the business landscape is evolving often feels like the rug is being swept from underneath our feet. In a last-ditch attempt to preserve stability, we might be tempted to hold onto the “tried and tested”, without realizing that the old way of doing things no longer works. The second barrier that prevents a VUCA-mindful style of management is the over-reliance on outdated, rigid and autocratic structures of leadership.
As we’ve seen, managing the challenges of a VUCA world requires flexibility, collaboration and initiative, which are in direct opposition to the obedience, micromanagement and deleterious groupthink proprietary to top-down leadership.
By now, two things should be obvious:
- The source of project complexity is often found in communication, or more specifically, the way information is travels between all parties involved. In the absence of a standardized venue that can bridge the knowledge gaps between teams, experts and stakeholders, information delivery becomes problematic.
- The complexity and the ambiguity of the geopolitical and economic environment are two of the main adversaries of performance, stability and progress within an organization. A highly competitive landscape doesn’t allow room for stab-in-the-dark decisions.
Besides the solutions proposed thus far, we recommend one more addition to your PM toolkit: project visuals.
Next off, we’ll discuss a few ways you can transform raw data that’s hard to grasp and even harder to explain into crystal clear, intuitive and vibrant representations.
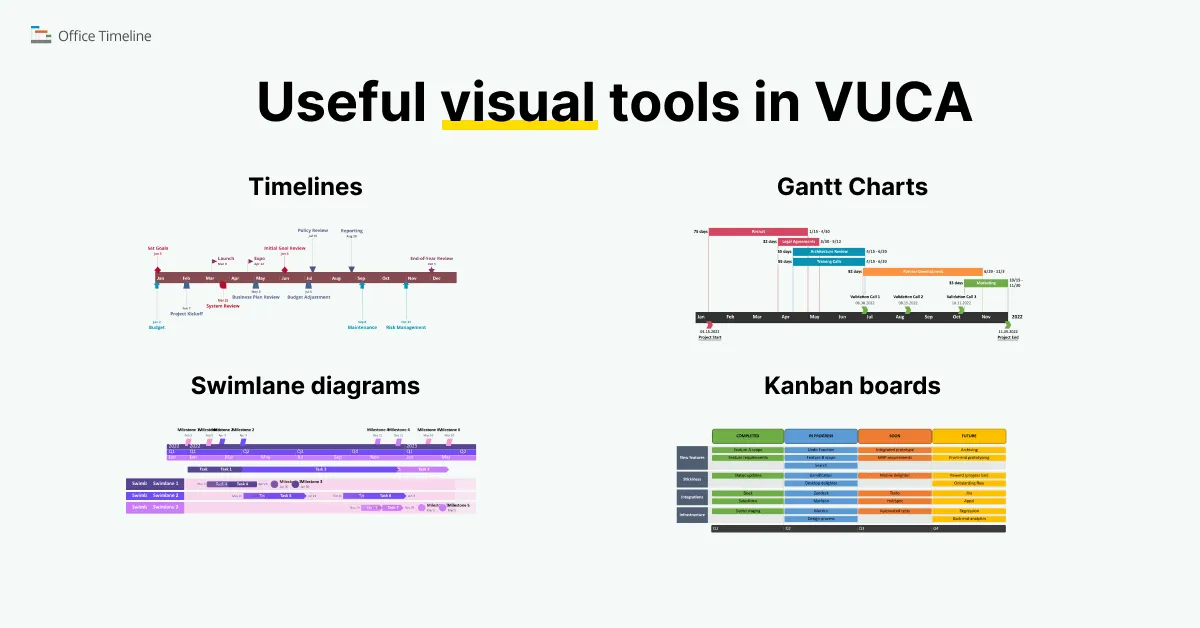
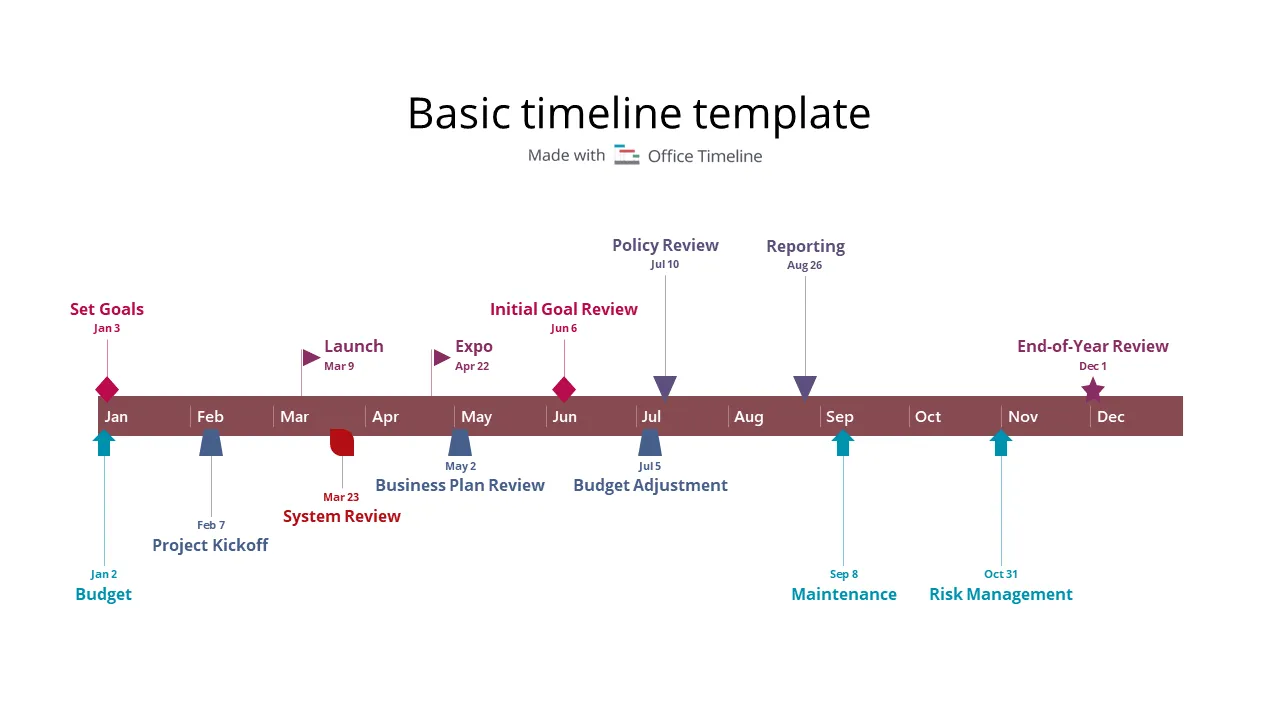
Timelines
Broadly speaking, timelines are graphics that display the predicted events (milestones) and their associated dates in chronological order on a linear bar called a timeband. Depending on the scope of the represented project, the timeline’s span can cover hours, days, months or years.
The focus of timelines is on splitting a complex undertaking with multiple moving parts into phases, each with its subset of tasks and subtasks, and offering a high-level overview of the progress. Some advantages of integrating timelines into your PM strategy include:
- Ensuring all actors involved in the project have a complete understanding of progress at every stage;
- Promoting accountability for all team members for their designated tasks;
- Properly communicating all details pertinent to the enterprise, like due dates, extra requirements, blockers, etc.
- Providing more accurate estimates of deliverables and improving resource management.
For example, this 1-year timeline example is free to download as a PowerPoint template:
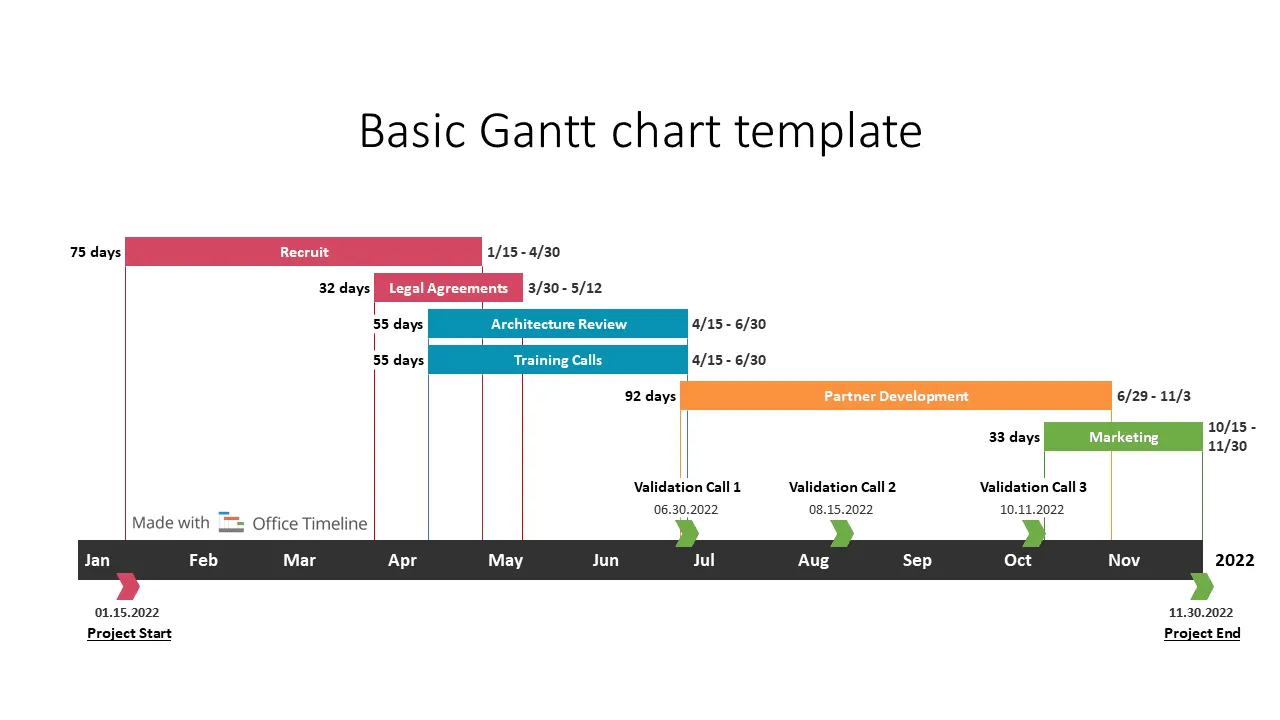
Gantt charts
Quite similar to a timeline, the Gantt chart also represents the linear progression of a project on a chronological timeband. However, this time the focus is on the work breakdown structure (tasks, subtasks and their dependencies) rather than phases.
The Gantt chart’s dynamic layout enables you to immediately get an understanding of:
- A comprehensive list of all tasks and events;
- The start date, end date and duration of each task;
- Overlaps in activity that could cause bottlenecks;
- Dependencies and the critical path of the overarching project.
Here’s an example of a Gantt chart that you can download for free as a PowerPoint template:
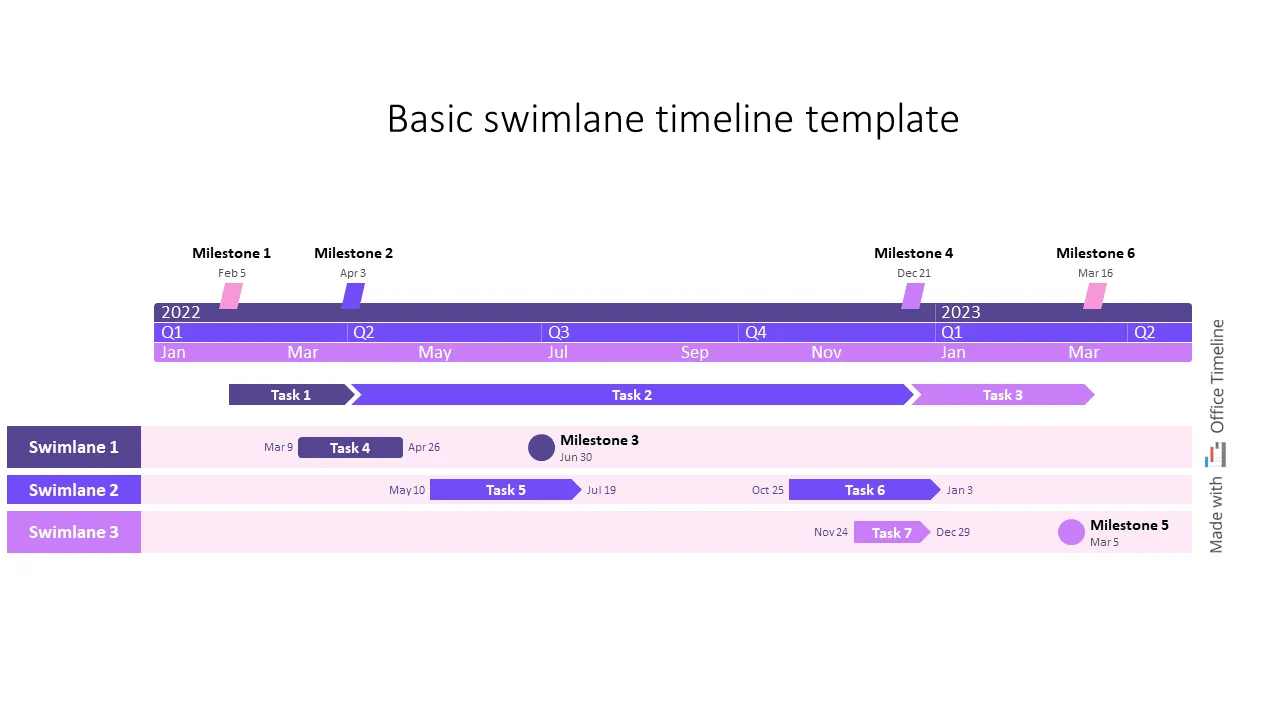
Swimlane diagrams
Swimlane diagrams are a variety of process flow diagrams, similar to timelines and Gantt charts, that include an extra element: the lanes.
The main advantage of adding lanes to these graphics is that now you have an extra element of codifying the information. You can use them to showcase aspects like:
- Which team or team member is currently handling specific tasks;
- Concurrent phases of the same project and their progress;
- The formalized integration of business processes between departments.
If you’re looking for a an example of a project timeline with swimlanes, you can check out this visual and download it as a free PowerPoint file.
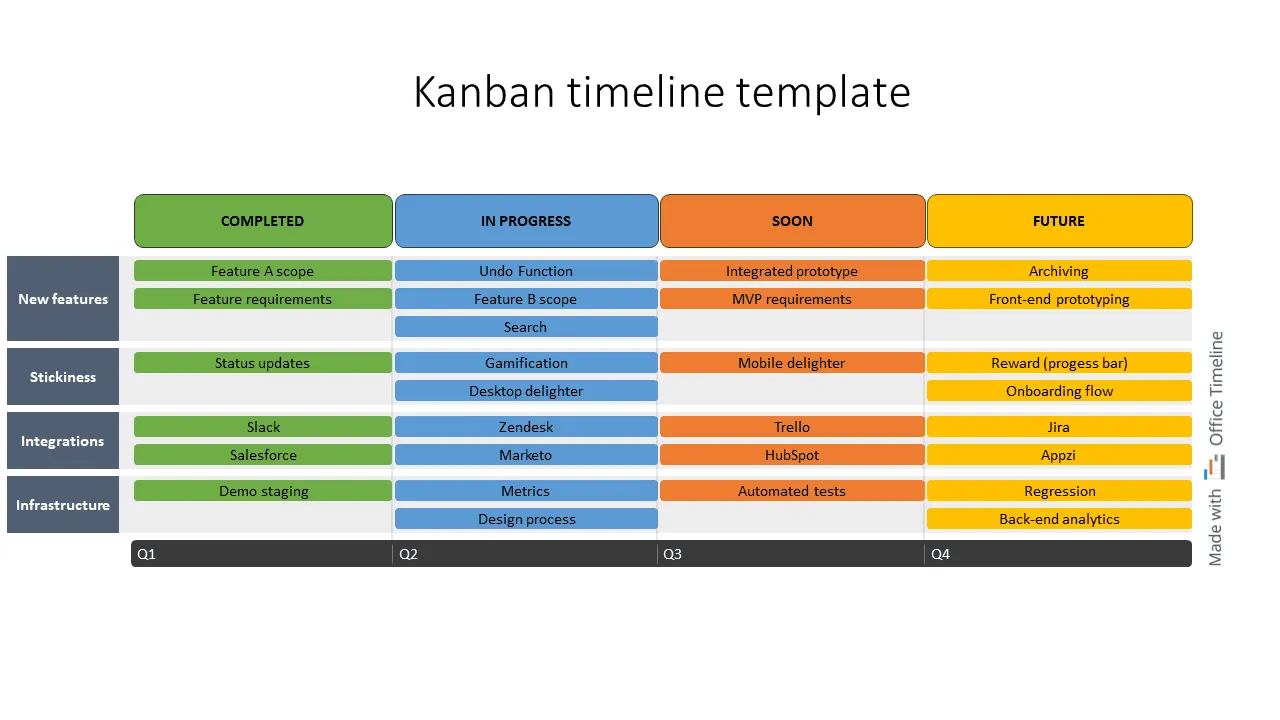
Kanban boards
The Kanban board is a system of organizing work in such a way that it eliminates the excess buildup of concurrent tasks. In the simplest form, it consists of a board with three columns (To do, In Progress, Done). On this board, users will place tasks cards accordingly.
Together with a WIP (Work in Progress limit), the Kanban system ensures that workers and teams never take on more work than they can effectively handle. Used correctly, this framework brings:
- Better visibility into all project components;
- Flexibility and predictability;
- Improved focus and productivity;
- A more collaborative organizational culture.
Check out this example of a Kanban board on a timeline that you can download as a free PowerPoint file.
6. Conclusions
We live and work in a world of complex, interconnected systems where accurately predicting the behavior and interactions of variables is practically impossible. The sheer number of components and their emergent forms of organization render futile any attempt break a system down into discrete elements and analyze them separately.
As of such, our best option is to understand the properties of these systems and apply wholistic frameworks that can reduce their complexity.
Project management is certainly a field where complexity can be found in abundance. Unfortunately, the direct correlation between a rise in complexity and the decrease in performance is highly palpable. To lend a helping hand, we’ve explored a number of frameworks that PMs can use to reduce complexity, such as Cynefin, VPEC-T (VIPER), I-Space and SECI.
In addition to that, we’ve discussed how you can further improve communication and decrease ambiguity with the use of project visuals like timelines, Gantt charts, swimlane diagrams and Kanban Boards.
If you’re looking for a timeline maker to enhance your presentations and ensure that both your stakeholders and your team can easily absorb information, check out Office Timeline, a PowerPoint add-in that helps project managers turn complex data into beautiful timeline slides.
7. FAQs about project complexity
Let’s explore some of the most frequently asked question on the topic of project complexity and VUCA.
Tim is Co-Founder & CEO of Office Timeline, a Seattle-based start-up that aims to rid the world of boring, uninspiring meetings.