
Ever found yourself drowning in project details? Most professionals have. Projects contain countless moving parts that can quickly become unmanageable without proper visualization. Timelines bring structure by mapping tasks across clear time periods, setting expectations for what happens when. Among the different types of timelines, Gantt charts stand out as particularly powerful project management tools.
Gantt chart timelines offer visual representations that simultaneously track progress, deadlines, and task interdependencies. This visual format transforms abstract project concepts into concrete, actionable plans that teams can follow with precision.
Studies show project schedules where visual scheduling tools (like Gantt-based interfaces) were used, were completed significantly faster than those based on tabular tools; the visual group required about 30–40% less time on average to build and adjust schedules.
This article explores real-world applications of Gantt charts across industries, demonstrates how to use them effectively, and shares practical techniques for improving your project planning. It continues our series on timeline creation, helping you master visual scheduling and keep even the most complex projects on track.
What is a Gantt Chart timeline?
A Gantt chart type timeline is a horizontal bar chart that illustrates a project schedule. Named after Henry Gantt, who popularized this visualization in the early 1900s, it shows tasks or activities along the vertical axis and time along the horizontal axis. Each task is represented by a bar, with the position and length of the bar reflecting the start date, duration, and end date of the task.
Key components of a Gantt chart
Gantt charts shine through six main elements that combine to show exactly how a project runs from start to finish:
- Task bars: Horizontal bars that represent individual tasks. The length of each bar shows exactly how long the task will take. When you look at a task bar, you immediately see its start date, duration, and end date.
- Timeline scale: The horizontal axis displaying time units. This scale can show days for short projects, weeks for medium-length projects, or months/quarters for long-term initiatives. The scale provides context for the entire project timeline.
- Task dependencies: Lines and arrows connecting tasks to show their relationships. These connections instantly show which tasks must finish before others can begin, creating a visual workflow sequence.
- Resource allocations: Names or icons showing exactly who works on each task. This prevents overloading team members with simultaneous assignments and shows how work distributes across the team.
- Milestones: Diamond-shaped markers representing important dates or accomplishments. Unlike regular tasks, milestones have zero duration and mark specific moments like project phases, deliverables, or decision points.
- Progress indicators: Shading or percentage values within task bars showing completion status. These indicators give an immediate visual cue about which tasks are on schedule, ahead, or behind.
These six elements work together to turn complex project plans into clear visual maps. Anyone viewing the chart gains immediate understanding of the project scope, timeline, and current status without needing to read through detailed documentation.
Why teams rely on Gantt charts
Gantt charts offer practical benefits that make project work smoother and more successful.
Here's how these visual timelines make life better for teams and managers:
Better project planning
Gantt charts map out your entire project visually, showing how all pieces fit together over time. This bird's-eye view helps you spot gaps, overlaps, and unrealistic timelines before work begins, so you can make adjustments when they're still easy to fix.
Team-wide productivity boost
Teams with clear visual timelines waste less time figuring out what to do next. The chart shows exactly what needs attention today, tomorrow and next week, helping everyone stay focused on the right tasks at the right time. No more confusion about "what should I work on now?"
Early problem detection
When you see all tasks and how they connect, you spot potential issues weeks before they happen. That task that takes twice as long as planned? You'll see exactly which other tasks it affects, giving you time to adjust plans instead of scrambling when deadlines loom.
Smarter team workloads
The chart shows at a glance who's working on what and when. This prevents the common problem of some team members sitting idle while others drown in work. You'll see immediately if someone has too many overlapping tasks.
Risk reduction through visibility
Many project failures come from hidden dependencies - when Task B can't start until Task A finishes, but nobody realized it. Gantt charts put these connections front and center, dramatically reducing the "I didn't know we were waiting on that" problems.
Painless status updates
Skip those long status meetings. With a shared Gantt chart, everyone sees project progress instantly. For stakeholder updates, a quick screen share gives a complete picture without endless slides or explanations.
Reality-based deadlines
Nothing derails projects faster than impossible deadlines. When you map out all tasks with realistic durations, you get end dates based on actual work rather than wishful thinking or arbitrary dates from above.
Teams that adopt Gantt report improvement in project visibility compared to their previous planning methods. The visual clarity cuts through confusion and keeps everyone moving in the same direction with minimal effort.
Creating your own: Gantt chart builders and makers
You don't need to be a project management expert to create effective Gantt charts. Today's market offers several approaches to building professional timelines, each with specific strengths depending on your needs.
Presentation-integrated solutions
Many project managers need to present timelines in executive meetings where visual impact matters as much as data accuracy. Office Timeline addresses this specific need by integrating directly into PowerPoint, enabling the creation of professional Gantt charts within the familiar presentation environment teams already use.
This PowerPoint integration eliminates the common workflow problem where project managers build timelines in one system, then spend hours recreating them for presentation purposes. Instead, timelines created or updated in PowerPoint maintain their professional styling while allowing real-time data changes during meetings.
Build Gantt charts without the hassle
Try Office Timeline for free. Skip the tool-switching and design work. Create sharp, structured Gantt charts right inside PowerPoint.
Dedicated project management software
Microsoft Project, Smartsheet, and TeamGantt provide robust Gantt chart capabilities with features for tracking resources, costs, and progress. While powerful, these specialized tools typically involve steeper learning curves and higher price points than other options.
Web-based apps and platforms
Web-based timeline tools offer flexibility and team-wide access that desktop solutions can't match. Office Timeline Online leads this category with its focus on creating presentation-quality Gantt charts that executives and clients immediately understand. While platforms like Asana, Monday.com, and ClickUp include Gantt views as one feature among many, Office Timeline Online specializes in visual timeline creation that communicates project status clearly.
Most teams using Office Timeline Online appreciate the ability to develop timelines collaboratively online, then transfer them directly to PowerPoint presentations without rebuilding or reformatting. This workflow eliminates the frustrating experience of creating a project timeline in one system, then spending hours recreating it for the next executive meeting.
The platform offers templates designed for different industries and reporting needs, reducing the time needed to create professional visuals. For organizations where both team planning and stakeholder presentations matter equally, this hybrid approach brings together collaboration tools and presentation software.
Spreadsheet solutions
Excel and Google Sheets provide Gantt chart templates and functionality through bar charts or specialized add-ons. While less powerful than dedicated solutions, spreadsheets can work well for simpler projects.
When selecting a Gantt chart maker, consider:
- project size and complexity;
- number of team members who need access;
- budget constraints;
- required features (resource management, cost tracking, etc.);
- integration with other tools you use.
Most Gantt diagram makers follow similar steps for creating a chart:
- list all project tasks;
- estimate the duration of each task;
- identify dependencies between tasks;
- assign resources to tasks;
- set milestones and deadlines;
- review and adjust the timeline.
Many tools allow you to toggle between Gantt view and other project views like lists or Kanban boards, giving you flexibility in how you visualize your project.
Getting started quickly: customizable Gantt chart templates
Why start from scratch when you can use Gantt chart templates? Templates provide pre-built structures for common project types, saving time and ensuring you don’t miss important tasks. Additionally, there are various free Gantt chart templates customized for specific applications such as marketing, web design, construction, and event planning.
Templates typically include:
- common task categories for that project type;
- reasonable time estimates;
- standard dependencies;
- typical milestones;
- resource allocation frameworks.
You can find Gantt chart templates for:
Construction projects: With phases for planning, site preparation, foundation, framing, electrical, plumbing, finishing, and inspections.
Software development: Including requirements gathering, design, development, testing, deployment, and maintenance.
Marketing campaigns: With sections for research, strategy development, content creation, design, review cycles, distribution, and analysis.
Event planning: Covering venue selection, vendor management, promotions, logistics, and day-of coordination.
Product launches: Including development, testing, manufacturing, marketing, sales preparation, and distribution.
How to use the templates
To use a template effectively:
- Select a template that matches your project type.
- Customize task names and descriptions.
- Adjust durations to fit your specific project.
- Add or remove tasks as needed.
- Update resource assignments to match your team.
Ready!
If you're starting a project from scratch, templates save significant setup time while ensuring professional results. Office Timeline's template collection features ready-made Gantt charts designed for specific industries and project types. These templates provide proven structures with realistic timelines, dependencies, and milestones already in place.
With tens of customizable designs across industries like IT, construction, marketing, and product development, you'll find patterns that match your specific project needs. Each template contains industry-standard task groupings and timeline structures based on real-world project patterns, giving you both a practical head start and visual inspiration.
Browse Office Timeline's Gantt template gallery to find and download project timelines tailored to your industry. These templates work immediately in both the PowerPoint add-in and online platform, letting you customize colors, dates, and tasks while maintaining professional styling that communicates clearly to stakeholders and team members alike.
Key elements for effective Gantt chart timelines
Creating a useful Gantt chart timeline requires attention to several key elements:
Task breakdown structure
Break larger tasks into smaller, manageable pieces. This provides more accurate scheduling and makes progress easier to track. For example, instead of a single “Website Development” task, break it into “Homepage Design,” “Product Page Templates,” “Shopping Cart Implementation,” etc.
Accurate time estimation
Be realistic about how long tasks will take. Consider team member experience, potential obstacles, and past performance on similar tasks. Include some buffer for unexpected delays.
Dependencies
Identify and map relationships between tasks:
- Finish-to-Start: Task B can’t start until Task A finishes (most common)
- Start-to-Start: Task B can’t start until Task A starts
- Finish-to-Finish: Task B can’t finish until Task A finishes
- Start-to-Finish: Task B can’t finish until Task A starts
Resource allocation
Assign people and other resources to tasks, making sure no one is overloaded. Look for resource conflicts where one person is assigned to multiple simultaneous tasks.
Milestones
Mark significant points in the project that represent major accomplishments or deliverables. Milestones have no duration but serve as checkpoints to measure progress.
Visual clarity
Use color coding to distinguish different types of tasks or to indicate status. Group related tasks together visually. Don’t overcrowd the chart with too much detail. Utilizing a visual project management tool can enhance the representation of project schedules, making it easier to plan effectively and ensure timely, budget-conscious delivery.
Maintenance
Update the Gantt chart regularly as the project progresses. Record actual start and finish dates compared to planned dates. Adjust future tasks based on current progress.
A Gantt chart timeline is a living document that evolves with your project. Regular updates keep it relevant and useful as a communication and planning tool.
Common challenges and solutions when using Gantt charts
Even the best project plans hit unexpected obstacles. Let's explore the typical problems that derail project timelines and practical ways to overcome them without adding unnecessary complexity:
Scope creep
We've all seen it happen - what started as a straightforward project gradually expands as new requirements sneak in.
Solution: Create a simple change request process where any new addition requires evaluation of its timeline impact before approval. Some teams use a "one in, one out" rule where adding a feature means removing something of equivalent effort.
Unrealistic timelines
Optimism and external pressure often lead to schedules that look good on paper but prove impossible in practice.
Solution: Check your estimates against similar past projects rather than wishful thinking. Add buffer time to tasks with historical variability. Many experienced project managers follow the "multiply by pi" rule - whatever time estimate you first think of, multiply by 3.14 for a more realistic timeframe.
Dependency bottlenecks
When too many tasks funnel through one person or milestone, the entire project becomes vulnerable.
Solution: Run a "what if" analysis on your Gantt chart. Ask "what happens if this key task runs late?" for critical path items. Where the answers reveal major risks, develop backup plans like identifying alternate resources or splitting deliverables.
Outdated charts
A Gantt chart becomes worthless when it doesn't reflect reality.
Solution: Schedule 15-minute weekly updates where team members report actual progress versus planned progress. Using tools with simple update mechanisms (like Office Timeline's drag-and-drop interface) removes excuses for letting charts become outdated.
Too much detail
Charts showing every minor task become overwhelming and impossible to maintain.
Solution: Create multi-level views - an executive summary showing major phases, with detail available through expansion when needed. Focus your main chart on deliverables rather than activities, which keeps the timeline focused on results rather than process steps.
Practical applications: when to use a Gantt chart in project management
Gantt charts work well for projects with multiple interdependent tasks that must be completed in a specific sequence. They’re particularly valuable in:
- Construction: A construction project requires precise coordination of materials, labor, and equipment. A Gantt chart timeline ensures foundation work finishes before framing begins, and electrical work happens before drywall installation.
- Software development: Development teams use Gantt charts to coordinate design, coding, testing, and deployment phases, keeping everyone aligned on deadlines and dependencies.
- Event planning: From conferences to weddings, event organizers use Gantt charts to track venue booking, vendor coordination, marketing, and logistics.
- Product launches: Companies map out product development, manufacturing, marketing, and distribution on Gantt charts to ensure all elements come together for launch day.
- Marketing campaigns: Marketers coordinate content creation, design work, approvals, and media placements using Gantt charts.
The benefits of using Gantt chart timelines include:
- Clear visualization of the project timeline
- Better understanding of task dependencies
- Effective resource allocation
- Early identification of scheduling conflicts
- Improved communication with stakeholders
When you can see the entire project laid out visually, it’s easier to spot potential bottlenecks and adjust plans accordingly.
Gantt chart application examples
These examples demonstrate how Gantt charts adapt to different industries while maintaining their core function - showing what happens when, who's responsible, and how tasks connect to create successful projects:
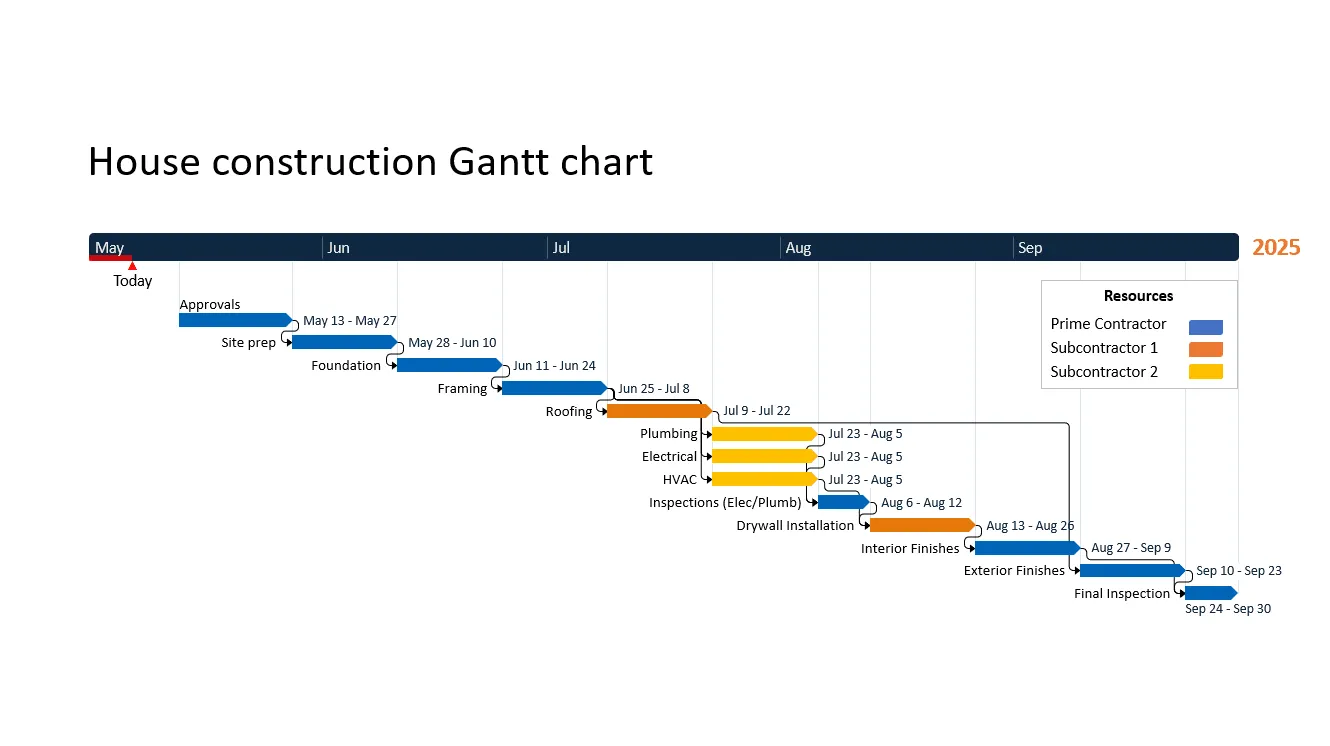
House construction Gantt chart
Construction Gantt charts typically show the logical progression from permits and site preparation through foundation, framing, roofing, electrical, plumbing, drywall, finishing, and final inspection. They highlight critical dependencies - you can’t install drywall before electrical and plumbing work is complete and inspected.
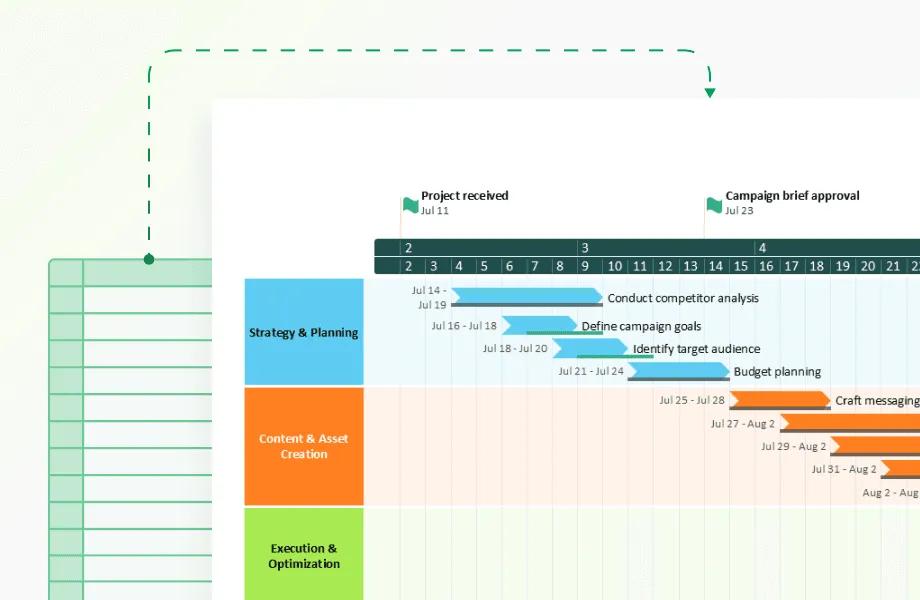
Software deployment Gantt chart
This Gantt chart illustrates a structured software deployment process, from initial project approval to final hand-off. It breaks the rollout into clear, time-bound stages, helping teams monitor progress and dependencies across multiple tasks.
The early phases focus on image analysis and preparation for both PC and smartphone environments, steps that ensure each system configuration is ready for testing. Midway through the project, optimization, testing, and sign-off activities confirm that all software images meet performance and compatibility requirements before release.
Milestones like Image Rolled Out and Image Approved mark key checkpoints, while the Today marker provides an instant snapshot of current progress. The closing stages (documentation, helpdesk training, and project hand-off to production) ensure the deployment transitions smoothly into full operational use.
Overall, this Gantt chart offers a clear view of the rollout schedule, making it easy to track dependencies, validate deliverables, and keep the deployment on schedule.

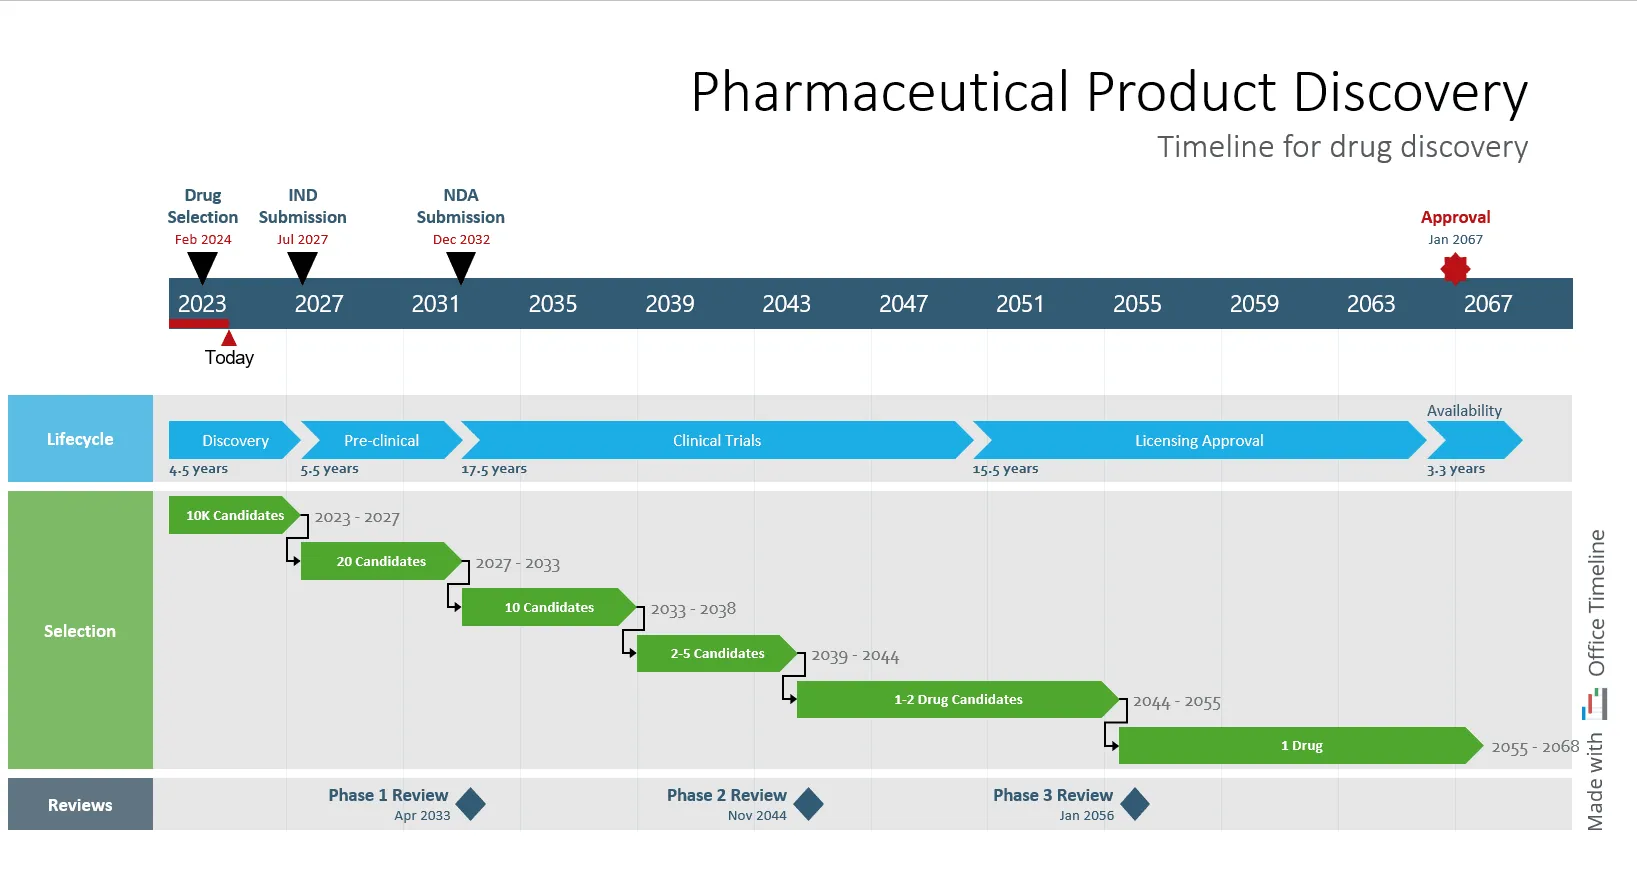
Pharmaceutical development Gantt chart
This Gantt chart shows the drug development process from initial screening to market. Note how it displays R&D phases with timeframes: Discovery (4-5 years), Preclinical testing, and three phases of clinical trials.
Regulatory checkpoints appear as milestones: IND submission before human testing begins and NDA filing preceding final review. The visual representation shows how research compounds progressively narrow to a single approved therapy.
This Gantt chart can help research teams visualize the extended development sequence and anticipate regulatory decision points throughout the pharmaceutical development pathway.
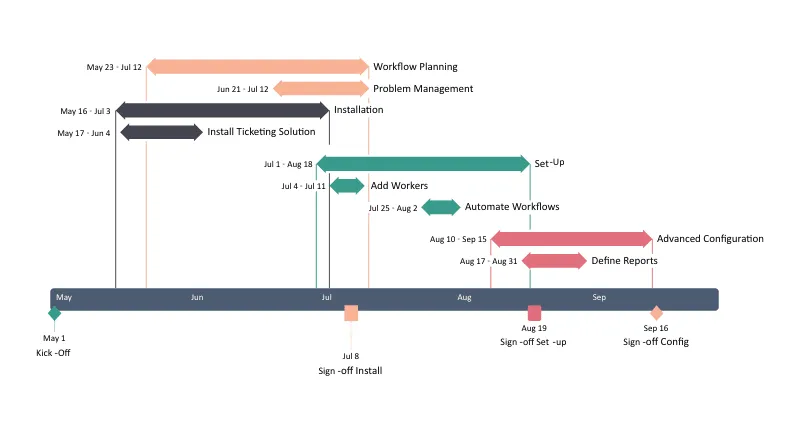
Event planning
This Gantt chart shows an event plan across four stages. Each stage contains specific activities represented by horizontal bars showing their exact timeframes (like Activity A running August 19-September 27).
Important dates appear as diamond markers throughout the timeline - such as Milestone 1 on August 19 when planning concludes and Milestone 2 on September 27 when venue arrangements finish.
The visual format makes meetings more productive since everyone sees exactly what happens when, who owns which tasks, and which activities must finish before others begin.

Each of these examples demonstrates how Gantt charts solve real coordination problems by visualizing task sequences and dependencies.
Effective Gantt chart examples share these characteristics:
- clear organization of tasks into logical groups,
- realistic time estimates,
- well-defined dependencies,
- strategic placement of milestones,
- balanced resource allocation,
- visual distinction between different types of tasks.
These examples show how to manage many tasks and connections while keeping everything clear. Making your own Gantt chart is straightforward once you know the basic steps for your project.
Conclusion: making timelines work for you
Gantt chart timelines turn complex projects into clear, manageable visual plans. You'll see exactly when each task happens, who handles it, and how tasks connect, and can spot problems weeks before they happen.
You've got options: specialized software like Office Timeline's PowerPoint add-in, web platforms, or spreadsheet templates. If you're just starting out, grab a template from Office Timeline's library to see how professionals structure projects in your field. Then adjust as you learn what works for your specific situation.
The best project timelines show enough detail without drowning in it. Many teams start too complex, then simplify as they go. Focus on making your timeline practical: something your team uses daily, not something that sits untouched after the kickoff meeting.
Remember: a good timeline saves time, reduces stress, and prevents those emergency meetings where everyone scrambles to fix problems nobody saw coming.
Frequently asked questions about Gantt chart timelines
Project management becomes significantly easier with the right visual tools. Before diving into our comprehensive guide on Gantt chart timelines, here are quick answers to the most frequently asked questions:
While basic timelines show when events happen, Gantt charts display task relationships, who's responsible for each task, and how changes to one task affect others. This interconnected view helps teams spot potential delays before they happen.
No. While dedicated tools like Office Timeline offer more features, you can create basic Gantt charts in Excel or Google Sheets. For professional-looking timelines that integrate with presentations, Office Timeline's PowerPoint add-in combines ease of use with professional results.
Include enough detail to guide your project without overwhelming the team. Most effective Gantt charts show major tasks (not every small step), clear dependencies, team assignments, and key milestones. Start simple and add detail as needed.
Gantt charts work for projects of any size with multiple tasks and deadlines. Even for small projects with 5-10 tasks, the visual format helps everyone understand timing and responsibilities better than text-based lists or spreadsheets.
