
Translating overused PM jargon into visual clarity for teams and executives
See how visual timelines outperform PM jargon by making progress obvious, reducing confusion, and helping project managers drive real delivery.

Explore why tools often fail to reflect reality and how the right approach (and the right tools) bring clarity.
The right project visualization tool makes a world of difference
"Wait, what? What do you mean it isn’t ready?" Despite relying on complex tech stacks that promise full visibility into project progress, the majority of project managers still get blindsided.
What happens is you spend so much time feeding data into too many tools and compiling detailed reports from siloed systems that you lose sight of real progress. Instead of gaining more efficient workflows and relevant insights, your company ends up dealing with costly administrative overhead, inaccurate data, and delayed decision-making.
The worst part is that the unaddressed disconnect between reported and real progress quietly erodes budgets and trust long before dashboards show there’s a problem.
So far, adding more tools in an attempt to cover more areas has only deepened this blind spot. What’s often overlooked is that clarity and better results come from investing in those solutions that streamline reporting and give stakeholders an accurate view of real-time progress against plans.
You’re not a project manager if you’re not caught up checking multiple tools every day, all telling you that the project is moving along. But is that real progress?
Jira boards, burndown charts, and dashboards track activity such as tickets being moved across columns, tasks updated, and hours logged, yet that activity doesn’t guarantee tangible results are being delivered.
Project managers get stuck in the middle of this fake visibility. They translate between people who use the same words but mean very different things, piecing together fragments of information from disconnected project management systems and chat conversations into a coherent story.
In doing so, project managers report a version of progress shaped by partially correct data rather than on-the-ground reality. This creates the illusion of progress without real alignment, the perfect recipe for timeline slippage, budget overruns, and poor executive decisions driven by misleading data.
Picture a team launching a new onboarding flow. Most tickets in Jira are already marked ‘done’, the burndown chart looks healthy, and the dashboard says the project is 90% complete. Even a closer look shows hours logged and tasks completed.
But when you sit in on a sales demo, the reality is very different. Technically, the onboarding flow exists, but it’s stitched together from half-finished decisions.
Error messages are still placeholder text, the legal disclaimer is pending review, and the analytics events needed to track drop-offs are pushed to the next sprint. What’s more, customer support hasn’t even seen this flow, so all help articles are now outdated.
How can this chaos be tracked as ‘done’?
Each team was telling the truth in their own system. Each team completed their tasks and every tool reflected that progress, or rather activity disguised as progress.
As a project manager, you reported progress based on what the systems showed, yet no tool helped you answer a key question: can a customer successfully use this today? Unfortunately, this realization only comes when the launch slips and leadership asks what went wrong.
Agile teams are digitally connected but physically distributed, so collaboration happens through tools like Teams, Jira, Asana, Slack, and email. While these tools help teams deliver outcomes on time and within budget, many project managers I’ve talked to feel that communication focuses more on updating systems than on shared understanding.
They worry that tools have replaced the conversations that make projects succeed, rather than support the people who get the work done. Their concern extends to the wave of AI integrations we’ve all experienced recently.
Using AI to automate repetitive tasks can free project managers to focus on higher-value work, while also providing benefits such as real-time predictive insights and optimized resource allocation.
However, it can’t solve complex team alignment challenges. That’s the job of tools that integrate with other systems, create context for stakeholders, and visually deliver real progress updates. And no more “nearly complete” projects that couldn’t go live.
Tools should be drivers of communication and alignment, not substitutes for it. When project status is visual and contextual by default, teams align easily, accountability becomes a habit, and stakeholders can make informed decisions.
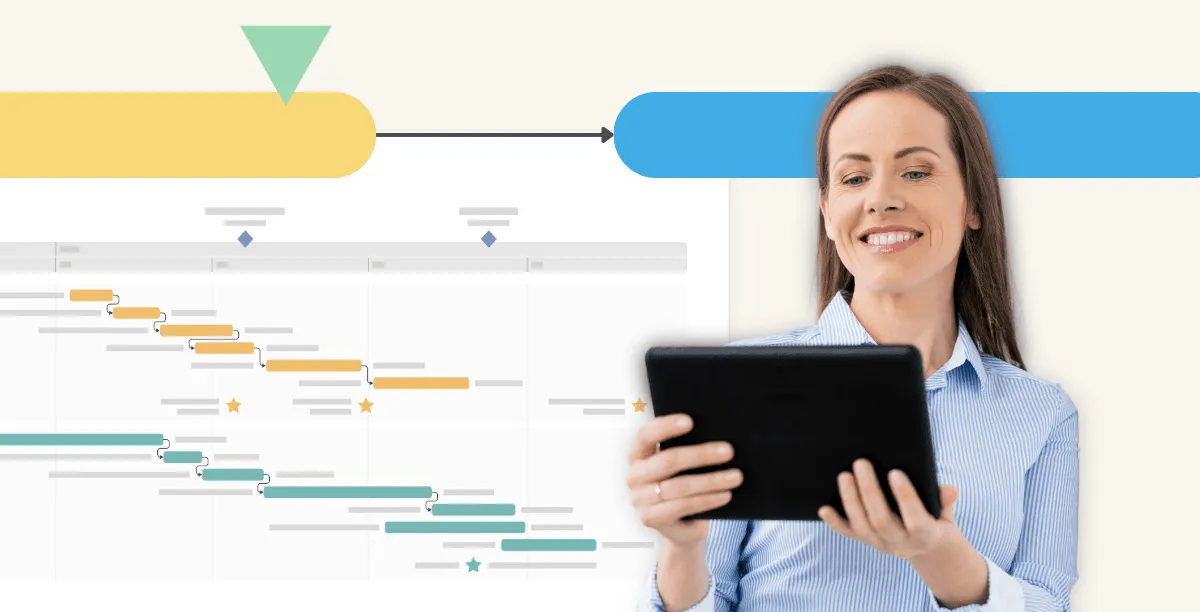
A project progress visualization tool translates complex interdependencies into visuals that teams, executives, and other stakeholders can intuitively understand and act on. This supports more meaningful conversations, simplifies progress reporting, and brings both real progress and blockers into focus.
Familiarity matters too: the tool you choose should integrate with your existing workflow and work the way your team expects. Tools that integrate directly with PowerPoint, the go-to corporate presentation software, eliminate the need for PMs and stakeholders to switch between multiple apps.
At the same time, planned vs. actual features add a much-needed layer of clarity for executive meetings, enabling side-by-side comparisons between real progress and the original plan. There’s no need to scroll through slides or give lengthy explanations that derail the discussions.
Stakeholders can instantly see task progress, whether the project is ahead or behind, and where blockers are at a glance. And unlike static PowerPoint slides or Excel sheets, these visuals automatically update as work moves forward, helping teams stay proactive.
Despite outdated project management beliefs, project success starts with clear visibility into what’s actually happening on the ground. The problem is that most tech stacks unintentionally create an illusion of progress that leads to costly adjustments.
Visualization tools transform the way teams interact. When real progress is easy to see, conversations become more transparent, decisions more confident, and teams more aligned around the work that drives results.
Consider this your invitation to explore how real-world companies are turning progress visibility into meaningful results.
Eddy is Founder & Chief Product Officer for Office Timeline, building a user-friendly but powerful app that makes timelines, Gantt charts and roadmaps directly in PowerPoint.
Tagged With:
Visual accountabilityGet the advanced features of Office Timeline free for 14 days.

See how visual timelines outperform PM jargon by making progress obvious, reducing confusion, and helping project managers drive real delivery.
Learn how visual project timelines help managers replace confusion with clarity, foster ownership, and build a culture of proactive accountability.
Discover how to build a culture of shared accountability and how PMs can add value to projects with easy-to-understand visuals.