How to make a timeline grid
Discover what timeline grids are, how you can create and use them when managing projects. Free PowerPoint template included.

Timeline grids – an easy way to organize and track data and plans
Timeline grids provide a simple yet effective visual support to those who want to present a series of events occurring over a well-defined period of time. Whether these events are historic, related to a crime case or marking the gradual development of a project, having them displayed on a timeline grid makes it easier for everybody to clearly understand their chronological relationship.
It is within the field of project management that this type of graphic proves most useful, as it helps professionals visualize major milestones and deadlines for a sequence of planned events.
If you need to convey important plans or schedules in an easy-to-follow manner, we recommend using a timeline grid for this purpose. Get started faster with the free resources we gathered for you in this blog post dedicated to timelines grids.
What is a timeline grid?
A timeline grid is a type of swimlane diagram that illustrates a list of events in chronological order. It usually contains a long horizontal bar (called timeband or timescale) along which relevant dates are labelled in parallel positions within distinctly delimited swimlanes.
The scale of the timeband varies depending on the type of events you want to represent, with each unit of distance corresponding to a set amount of time. For instance, a timeline grid for weekly schedules will use a timescale in days, whereas one dedicated to a project’s lifecycle can use a larger timespan (in weeks, months, or quarters).
What are timeline grids used for?
Due to their chronological display of data, timeline grids prove valuable in fields that rely on using such an approach for better understanding a topic, process, or trend. Education, research, product development and project management are the most common domains that use timelines grids to:
- show the evolution or general overview of some particular events, with specific time lapses between them, durations, or overlaps of spans;
- describe the planned course of a project from start to finish;
- group related activities in overarching categories, stages or departments based on their time reference;
- highlight important milestones that need to be achieved under a given schedule;
- communicate project details other than due dates such as approvals, supplementary assets, task assignments, and resource allocation;
- review the status of phases or tasks that are in progress.
Tips for creating an accurate timeline grid
To start building a clear timeline grid, follow the steps below:
- Identify the main components (i.e., eras, stages, or categories) of the overall period or process you want to illustrate and list them vertically.
- Set a separate horizontal swimlane (container) for each of these vertically displayed items.
- Draw a horizontal axis (representing the total span of the period/process you want to depict) above the items outlined at Step 1 and determine its scale by dividing it into equal sub-segments. For instance, if your timeline grid covers a year, you may want to divide its timeband into quarters or months.
- Break down each of the main components from Step 1 into smaller sub-units, estimate their duration and represent them as shapes (circles, squares, or triangles) into their corresponding swimlane. Use the horizontal time scale at the top as a reference point in their exact positioning.
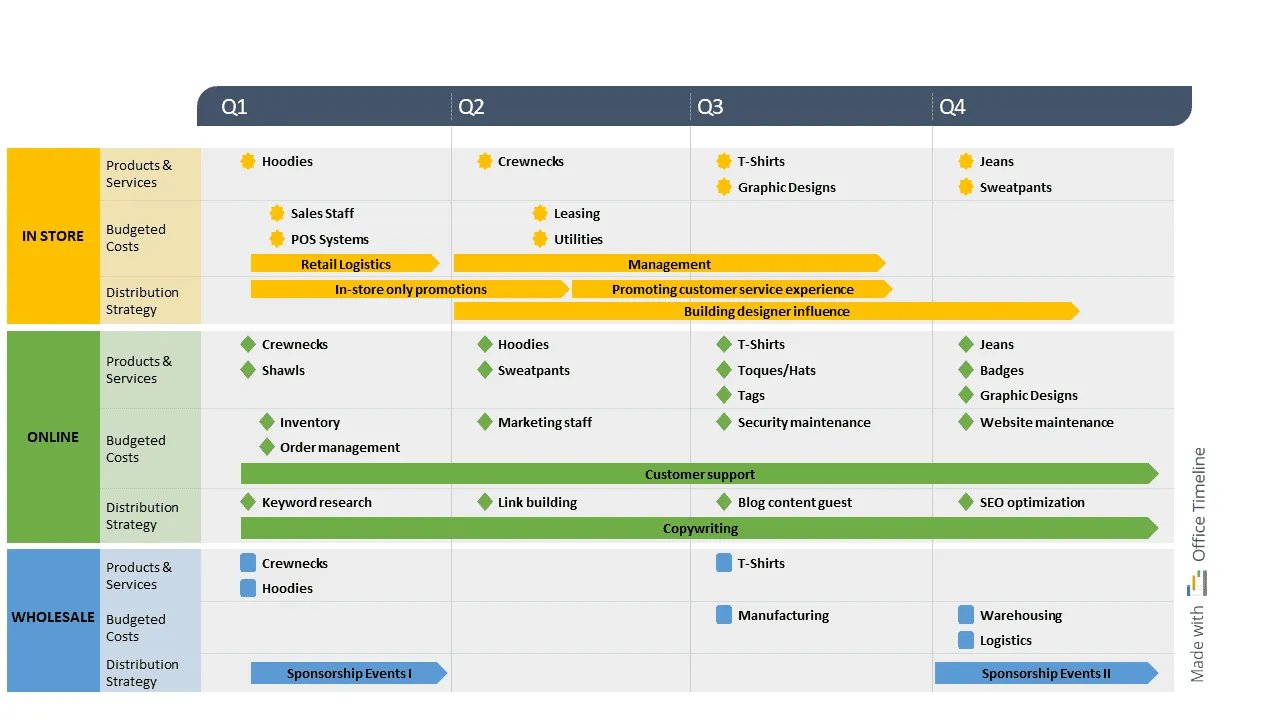
About the timeline grid example for PowerPoint
To help you get a better idea of how a timeline grid looks like, we’ve included here a pre-designed example that you can download as a free PowerPoint template for your own purposes.
The timeline grid sample was created with Office Timeline, a lightweight yet powerful PowerPoint add-in that automatically turns your data into stylish, professional-looking visuals. Download the Office Timeline free trial to try out the available features, further style the provided template or create your very own custom timeline grids.
Project management tips and tricks
Turn project data into professional timelines
Get the advanced features of Office Timeline free for 14 days.
