Want to turn your chaotic project schedule into something you can actually manage? A Gantt chart timeline turns scattered tasks and deadlines into one clear visual that everyone on your team can follow. Project managers use these timelines to plan schedules, track progress, and keep projects moving without missing key milestones.
Gantt charts display your entire project schedule, showing start and end dates for each task and how they overlap or depend on one another. They typically include task lists, timeline bars, milestones, and links that highlight dependencies, helping you track progress and manage resources more effectively. Keeping the chart up to date and involving your team in updates are simple but powerful habits that improve coordination.
If you want to dive deeper into how timelines support professional planning and execution, visit our guide on project management timelines for more insights and examples.
Understanding Gantt chart timelines
Gantt charts are the backbone of visual project management, turning complex projects into clear, manageable pieces that everyone can follow. These charts use horizontal bars to show individual tasks along a timeline, making it easy for teams to see what needs to happen when and how different parts of the project connect. In a Gannt chart, the timeline runs horizontally across the chart, while project phases and tasks are organized vertically.

Where Gantt charts came from
Gantt charts have an interesting backstory that goes back over a century. A Polish engineer named Karol Adamiecki actually created the first version in 1896, calling it a "harmonogram." But it was Henry Gantt, an American engineer, who made these charts popular in the United States around 1910.
Gantt originally designed his chart to track how long factory workers spent on specific tasks. The idea was simple but powerful: show work visually so managers could spot problems and improve efficiency. Over time, these charts evolved from factory tools into the project management standard we use today.
Digital tools have transformed how we create and use Gantt charts. What once required drawing by hand or complex software can now be done with simple online tools that automatically update and share with team members.
Why Gantt charts actually help
Gantt charts solve real problems that project managers face every day. They turn abstract project plans into visual schedules that everyone can understand at a glance. When team members can see exactly when their tasks start and end, coordination becomes much smoother.
Resource management becomes easier when you can see which team members are busy when and where potential conflicts might arise. You can spot overloaded team members before they become bottlenecks and redistribute work more effectively.
The visual nature of Gantt charts makes communication with stakeholders much simpler. Instead of explaining complex project schedules in meetings, you can show a chart that tells the whole story. Clients and executives can quickly understand project status, upcoming milestones, and potential risks without getting lost in details.
Gantt charts also help identify critical paths (the sequence of tasks that determine your project's minimum completion time). When you know which tasks are critical, you can focus your attention and resources where they matter most.
Key components of a Gantt chart timeline
A Gantt chart brings together task lists, timeline bars, milestones, and dependencies to create a complete visual picture of your project schedule and progress. Each piece works together to show what and needs to happen and when, and how everything connects.
Tasks
Tasks form the backbone of your Gantt chart, appearing both as a written breakdown of work and as visual bars on your timeline. You start by listing everything that needs to happen to complete your project, from major deliverables down to smaller action items.
A good task breakdown includes all the details your team needs: what each task involves, how long it should take, when it's due, and who's responsible for getting it done. Breaking your project into manageable pieces using a work breakdown structure helps you track progress and make sure nothing falls through the cracks.
These tasks then become horizontal bars on your chart - the visual elements that make Gantt charts instantly recognizable. Each bar shows when a task starts, when it ends, and how long it takes to complete. The length of each bar corresponds directly to the task's duration, so you can quickly see which tasks will take the most time.
The right level of detail matters. Too many tiny tasks and your chart becomes cluttered. Too few big chunks and you lose the ability to track meaningful progress. Most project managers aim for tasks that take between a few days and a couple of weeks to complete.
Timescale
The timescale provides the time-based framework that runs horizontally across your Gantt chart. This shows the calendar dates, weeks, or months that your project spans, giving everyone a clear reference for when things should happen.
The timeline scale can be adjusted based on your project length, daily increments for short projects, weekly for medium projects, or monthly for longer initiatives. This flexible time framework helps you see the overall project duration and plan work within realistic timeframes.
Milestones
Milestones mark the important moments in your project (major accomplishments, key decisions, or critical deadlines) that everyone needs to hit. Unlike regular tasks, milestones typically appear as diamonds or other distinctive symbols on your chart.
These checkpoints serve multiple purposes: they help prioritize work by showing what leads up to critical moments, celebrate team achievements when major goals are reached, and provide clear progress markers for stakeholders who want to understand project status without diving into details.
Good milestones are specific and meaningful. "Complete user testing" is better than "work on product." They should represent real accomplishments that move your project forward in significant ways.
Dependencies
Dependencies show how tasks connect to each other, which work has to finish before other work can start. In Gantt charts, these relationships typically appear as arrows connecting related task bars.
Understanding dependencies is needed for realistic project planning. If Task B can't start until Task A finishes, that relationship affects your entire schedule. When you map out these connections, you can see the critical path through your project and identify where delays in one area might impact everything else.
Dependencies also help with resource planning. When you know which tasks must happen in sequence versus which can happen simultaneously, you can better distribute work across your team and avoid conflicts where multiple people need the same resources at the same time.
Creating a Gantt chart timeline
Building a Gantt chart for your project starts with understanding what you're trying to accomplish and breaking it down into manageable pieces. The process involves defining your project scope, listing all the work that needs to happen, estimating how long things will take, and then choosing the right tools to bring it all together visually.
Step 1: Define your project scope
Before you start drawing bars and connecting dependencies, you need crystal clear boundaries for your project. Project scope defines what you're trying to achieve, what constraints you're working within, and what success looks like when you're done.
Start by identifying your main objectives using SMART criteria: goals that are specific, measurable, achievable, relevant, and time-bound. Consider your budget limitations, available resources, and hard deadlines that can't be moved. List your major deliverables and understand how they fit into the overall project lifecycle.
Clear project scope serves as your north star throughout the project. When new requests come up or priorities shift, you can refer back to your defined scope to decide what fits and what doesn't. This foundation makes everything else in your Gantt chart more accurate and useful.
Step 2: List tasks and subtasks
Creating a complete task list means thinking through every piece of work required to reach your project goals. This isn't just about the big deliverables; you need to break things down into specific, actionable tasks that team members can actually complete.
For each task, define what needs to be accomplished, who's responsible for getting it done, and roughly how long it should take. Consider how tasks connect to each other and which ones can happen simultaneously versus which must happen in sequence.
The goal is finding the right level of detail. Tasks should be specific enough that progress is measurable, but not so granular that your chart becomes overwhelming. Most effective Gantt charts use tasks that take anywhere from a few days to a couple of weeks to complete.
Step 3: Estimate task durations
Realistic time estimates are what separate useful Gantt charts from wishful thinking. Consider the complexity of each task, the skills and availability of your team members, and any potential roadblocks that might slow things down.
Build in buffer time for unexpected delays. Most projects encounter surprises, and having cushion time helps you stay on track when things don't go according to plan. Look at similar projects you've completed in the past to calibrate your estimates.
Remember that task duration isn't just about the work itself. Factor in time for review cycles, approvals, and any external dependencies that might cause delays. It's better to estimate conservatively and finish early than to create unrealistic expectations.
Step 4: Determine task dependencies
Mapping out how tasks connect to each other is crucial for creating a realistic project flow. Some tasks can't start until others finish, while some can happen simultaneously. Understanding these relationships helps you build a logical sequence and avoid scheduling conflicts.
Consider both hard dependencies (technical requirements where one task must precede another) and soft dependencies (preferences about sequencing that could be changed if needed). Also factor in resource dependencies, situations where the same person or equipment is needed for multiple tasks.
Don't forget to account for non-working days like holidays, planned vacations, or company shutdowns. These gaps affect your timeline and need to be built into your duration estimates and dependency planning.
Step 5: Choose the right Gantt chart tools
The tool you choose can make or break your Gantt chart experience. Look for software that offers an intuitive interface, easy data entry for dates and dependencies, milestone tracking, and good integration with other tools your team uses.
To choose the right Gantt chart tool, consider your team's technical comfort level, collaboration needs, and budget. Office Timeline's drag-and-drop interface makes it accessible for users at any skill level, while still providing the sophisticated features project managers need for complex scheduling and resource planning.
Some tools allow you to import data from spreadsheets or other project management systems, which can save significant setup time if you already have project information organized elsewhere.
Options range from simple solutions like Microsoft Word or Google Sheets to dedicated project management software with advanced features. Office Timeline stands out for its user-friendly approach, offering professional Gantt chart creation directly within PowerPoint, a tool most teams already know and use. This eliminates the learning curve of mastering entirely new software while delivering powerful project visualization capabilities.

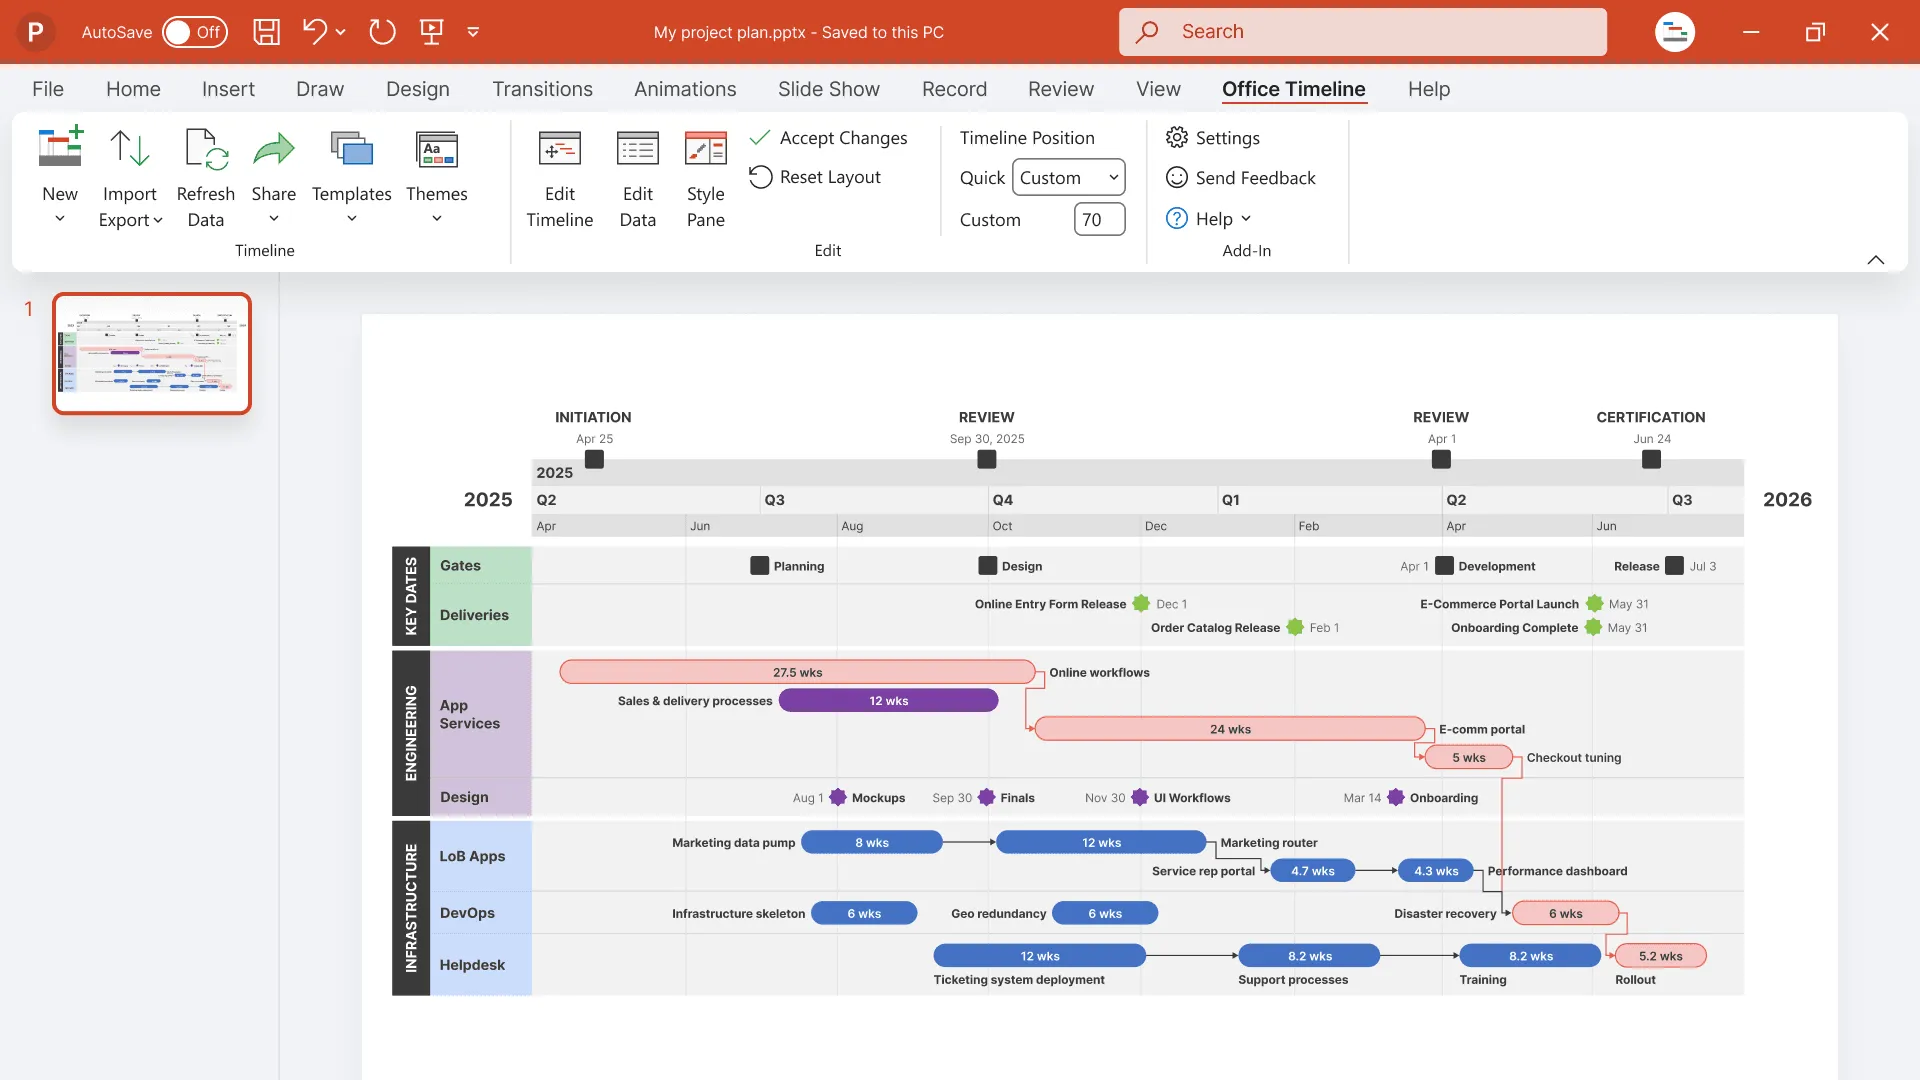
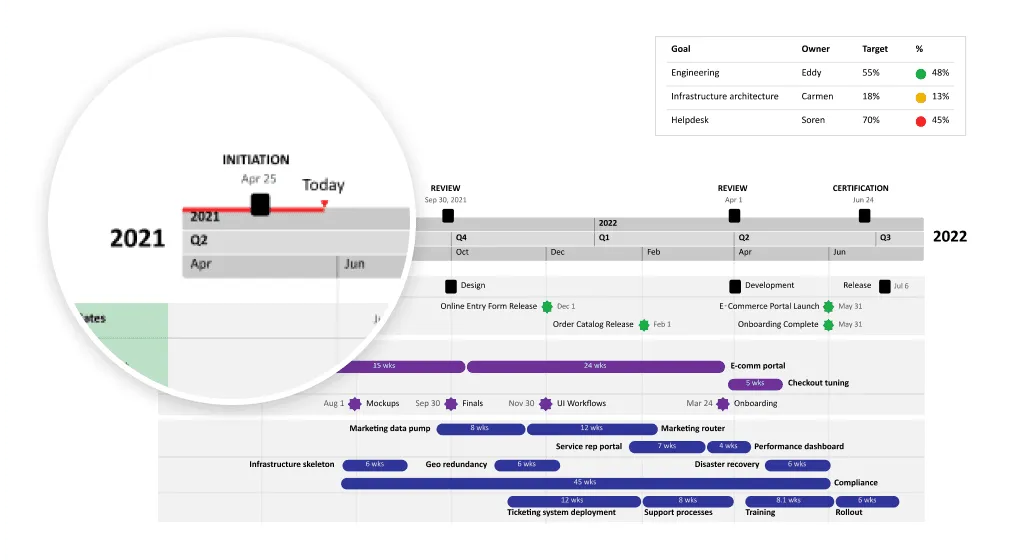
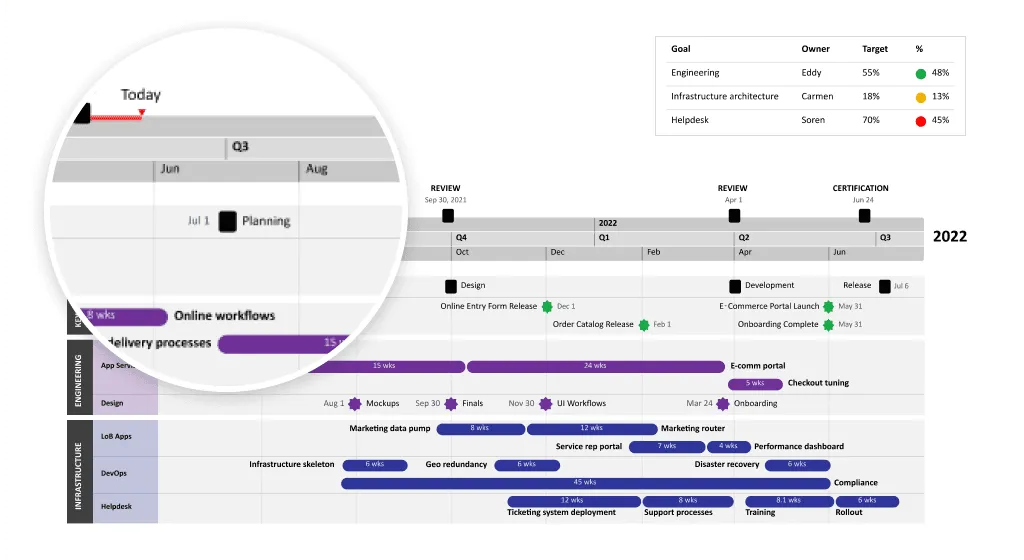
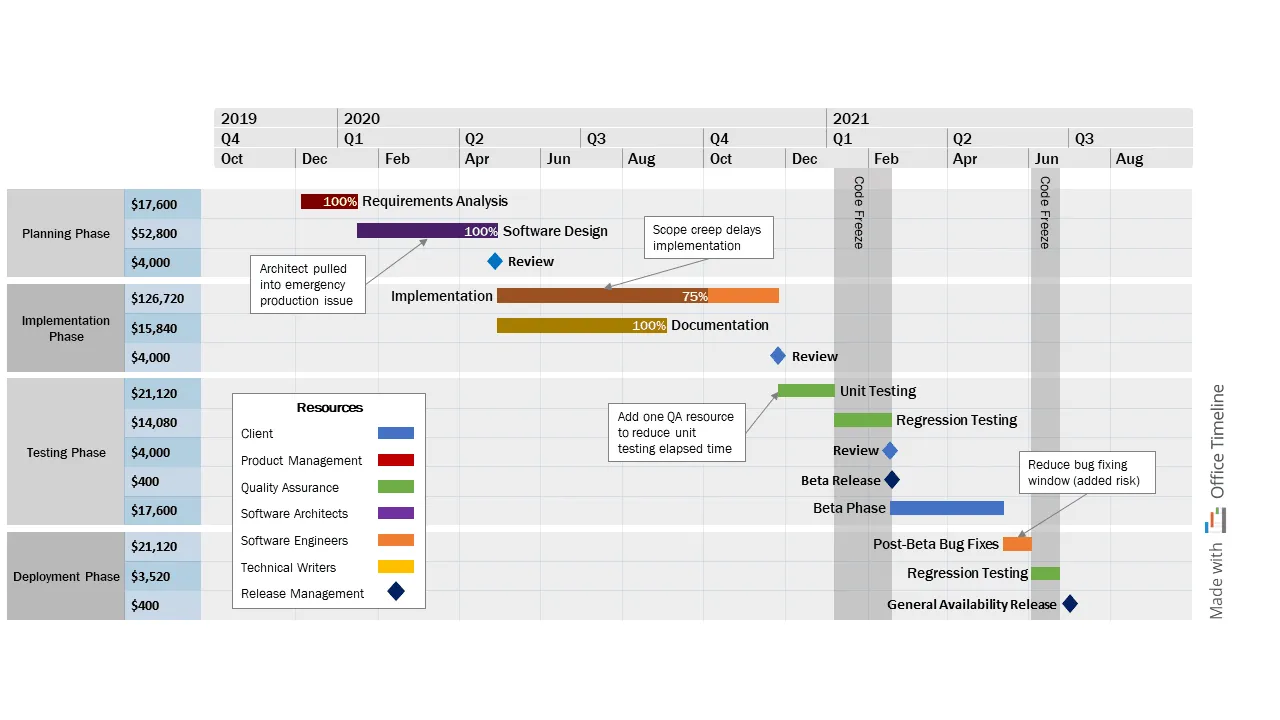
This Gantt chart was created using Office Timeline, a PowerPoint add-in designed for making project visuals that are both clear and presentation ready. It shows a multi-phase project with planning, resource allocation, testing, and production milestones, organized across quarters and color-coded by workstream for easy tracking. This clear layout gives you an instant overview of your entire project schedule and helps with coordination throughout the project's life.
You can download this template for free and customize it to fit your own project. Simply update the tasks, dates, and phases to match your workflow. To do this, make sure you download the free Office Timeline add-in for PowerPoint. It integrates directly into PowerPoint, allowing you to quickly make professional Gantt charts, timelines, and roadmaps, all with drag-and-drop ease.
Step 6: Input your data
Once you've chosen your tool, it's time to enter all your project information. Start with your task list, then add durations, set up dependencies, and mark important milestones. Most tools use arrows to show how tasks connect and special icons like diamonds to highlight deadlines.
Office Timeline excels at data import capabilities, allowing you to bring in information from Excel spreadsheets, CSV files, Microsoft Project files, Smartsheet, JIRA and other project management systems. This import functionality can dramatically speed up setup if you already have project information organized elsewhere. The tool integrates seamlessly with other Microsoft Office applications, so you can pull data directly from existing documents and spreadsheets, and keep data in sync.

The integration extends beyond just data import. Office Timeline works within the PowerPoint environment your team already uses for presentations, making it easy to create project timelines that fit naturally into status reports, stakeholder presentations, and project documentation.
Take time to review your completed chart before sharing it with your team. Check that dependencies make sense, durations seem realistic, and milestones align with your project goals. A well-constructed Gantt chart becomes a valuable communication tool that keeps everyone aligned and moving in the same direction.
Build your Gantt chart in minutes
Try Office Timeline for free. Import tasks, dates, and dependencies directly from Excel or Project and instantly generate a clean project timeline.
Best practices for effective Gantt chart timelines
Creating a Gantt chart is just the beginning. Keeping it useful throughout your project requires following proven practices that maintain accuracy and team engagement. Regular updates, team input, and critical path monitoring transform your chart from a static planning document into a dynamic project management tool.
These practices help project managers spot potential problems early, allocate resources where they're needed most, and keep projects moving according to plan even when circumstances change.
Keep your chart current with regular updates
Your Gantt chart is only as good as the information it contains. Regular updates ensure your chart reflects actual project progress rather than outdated plans that no longer match reality.
Schedule weekly or bi-weekly chart reviews to update task progress, adjust timelines for completed work, and modify schedules when delays occur. This consistent maintenance helps you catch problems early when they're easier to fix, rather than discovering major schedule conflicts weeks later.
Updated charts also keep everyone informed about real project status. When team members can see current progress and upcoming priorities, they make better decisions about how to spend their time and energy. This transparency prevents the confusion that comes from working off outdated information.
Get input from your team
The people actually doing the work often have the best insights about realistic timelines and potential obstacles. Involving team members in Gantt chart planning and updates improves accuracy while building buy-in for project schedules.
Ask team members to review duration estimates for their tasks and provide feedback about dependencies they see between different pieces of work. Their hands-on experience can reveal scheduling conflicts or resource needs that might not be obvious from a high-level planning perspective.
Regular feedback sessions also create accountability. When team members help create the schedule, they're more likely to take ownership of meeting deadlines and communicating early when problems arise. This collaborative approach turns your Gantt chart into a team tool rather than just a management tracking system.
Focus on the critical path
The critical path represents the sequence of tasks that determines your project's minimum completion time. Any delay in critical path tasks automatically delays your entire project, making them your highest priority for monitoring and resource allocation.
Gantt charts make it easy to identify critical path tasks by showing how different work streams connect. Focus your attention on these high-impact tasks, ensuring they have adequate resources and removing any obstacles that might cause delays.
When you understand your critical path, you can also identify opportunities to accelerate the project by adding resources to critical tasks or finding ways to do work in parallel rather than sequence. This strategic focus helps you make smart decisions about where to invest time and effort for maximum project impact.
Monitor dependent tasks carefully to ensure prerequisite work gets completed on time. When critical path tasks depend on other work, those dependencies become critical too. Keep a close eye on anything that could derail your most important timeline elements.
Using Gantt chart timelines in various industries
Gantt charts prove their worth across virtually every industry where complex projects need coordination and timing. From construction sites to software development teams, these visual tools help project managers break down complicated work into manageable pieces and keep everyone moving toward shared deadlines.
The flexibility of Gantt charts makes them valuable whether you're building a skyscraper, launching a software product, or planning a major event. Each industry adapts the basic framework to fit their specific needs and challenges.
Construction projects
Construction projects are natural fits for Gantt chart management because they involve so many moving parts that must happen in the right sequence. A typical construction Gantt chart maps out the major phases: project initiation and planning, pre-construction activities like permitting, procurement of materials and equipment, actual construction work, and post-construction completion tasks.
These charts help general contractors coordinate complex workflows across multiple subcontractors. When the electrical team needs to finish their rough-in work before the drywall crew can start, those dependencies become clear on the chart. Weather delays, material delivery schedules, and inspection requirements all get factored into realistic timelines.
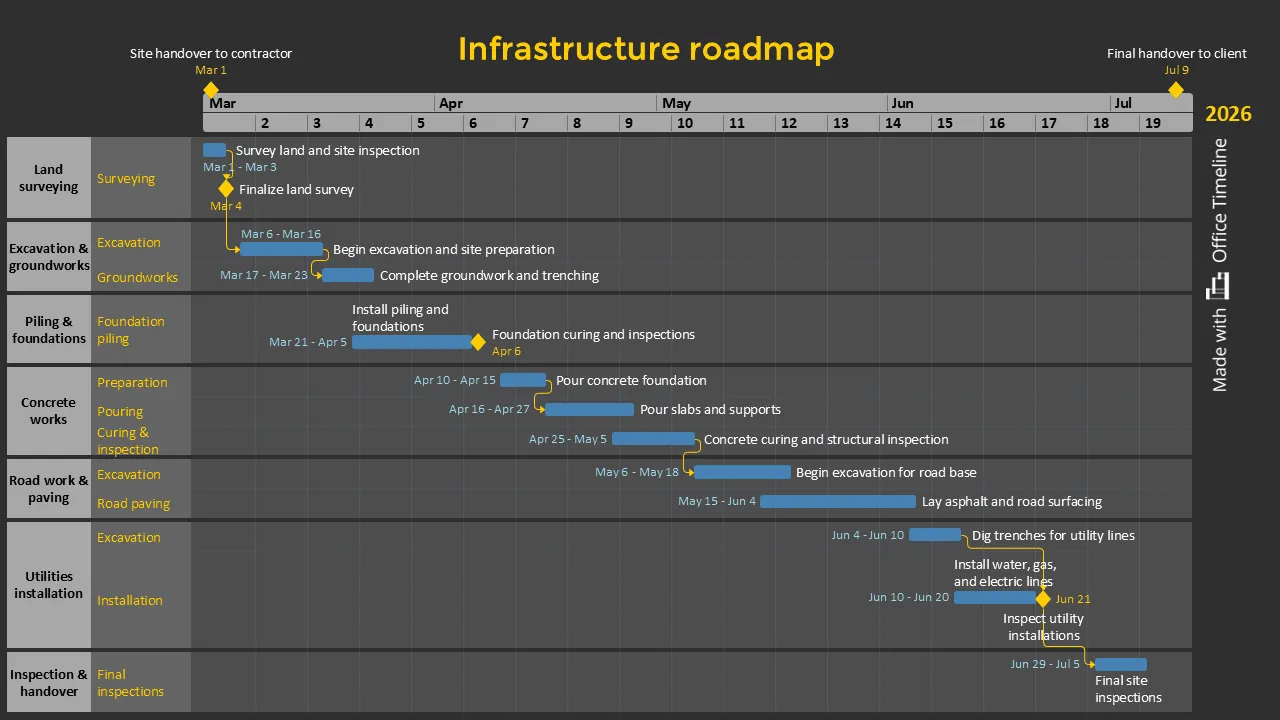
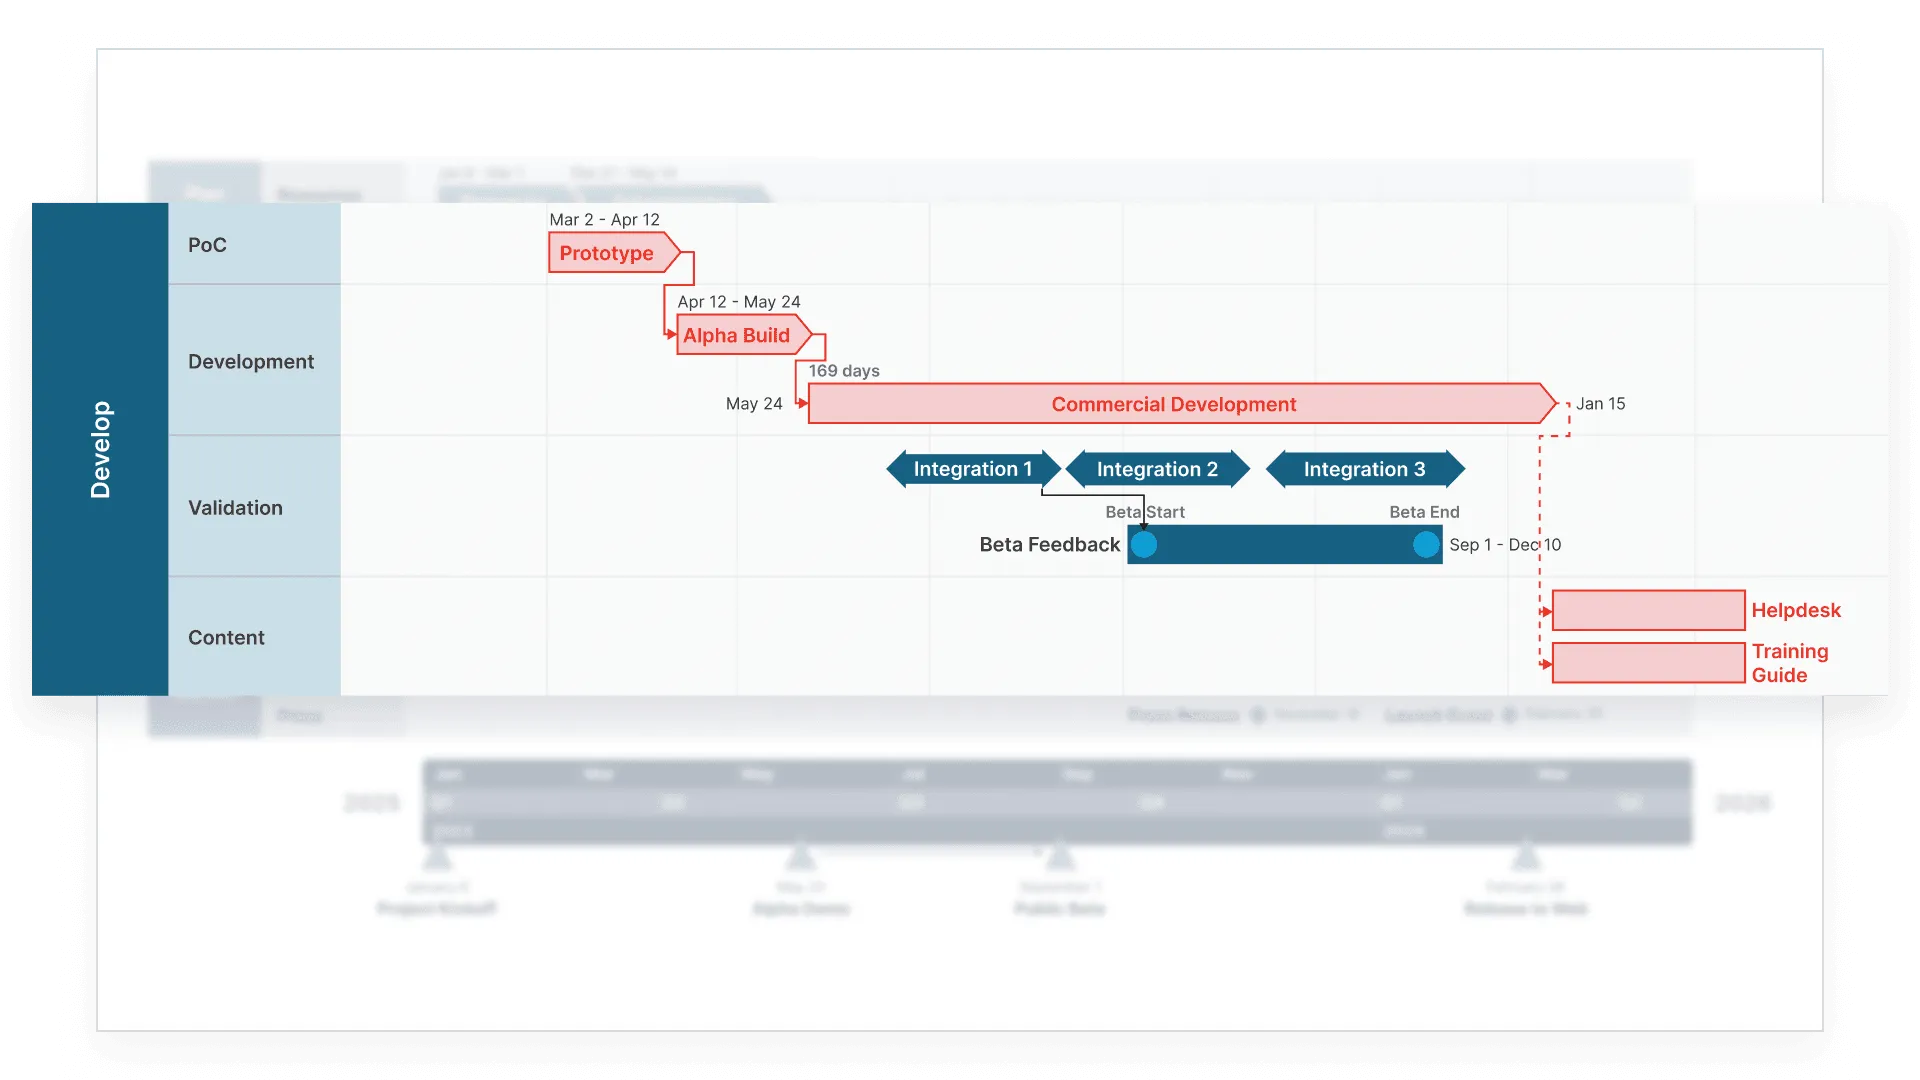
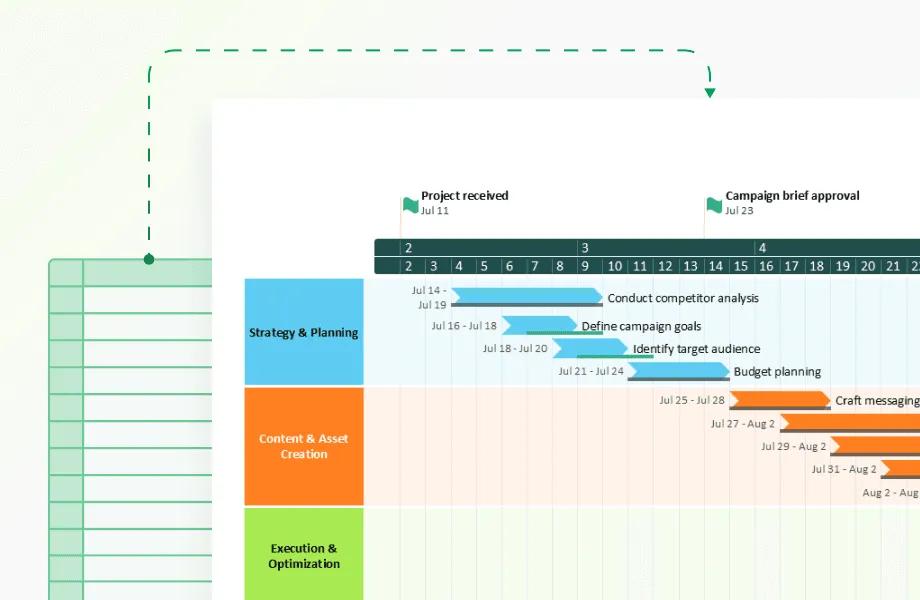
The example above, created with Office Timeline can be used to build clear, professional infrastructure schedules that keep every phase of construction visible and organized. The roadmap displays major work categories aligned under one shared timeline. Each bar shows task duration and overlap, while milestones mark key moments like site handover, foundation curing, inspections, and project completion. This makes it easy for contractors, engineers, and clients to understand dependencies and overall progress at a glance.
Construction Gantt charts also help with resource allocation, ensuring that equipment and specialized crews are available when needed without expensive downtime. The visual nature makes it easy to communicate schedules to subcontractors, clients, and regulatory agencies who need to understand project timing.
IT and software development
Software development teams use Gantt charts to visualize release cycles and align sprint work with broader project milestones. Tools like Jira integrate Gantt chart functionality specifically for development workflows, helping teams track feature development, testing phases, and deployment schedules.
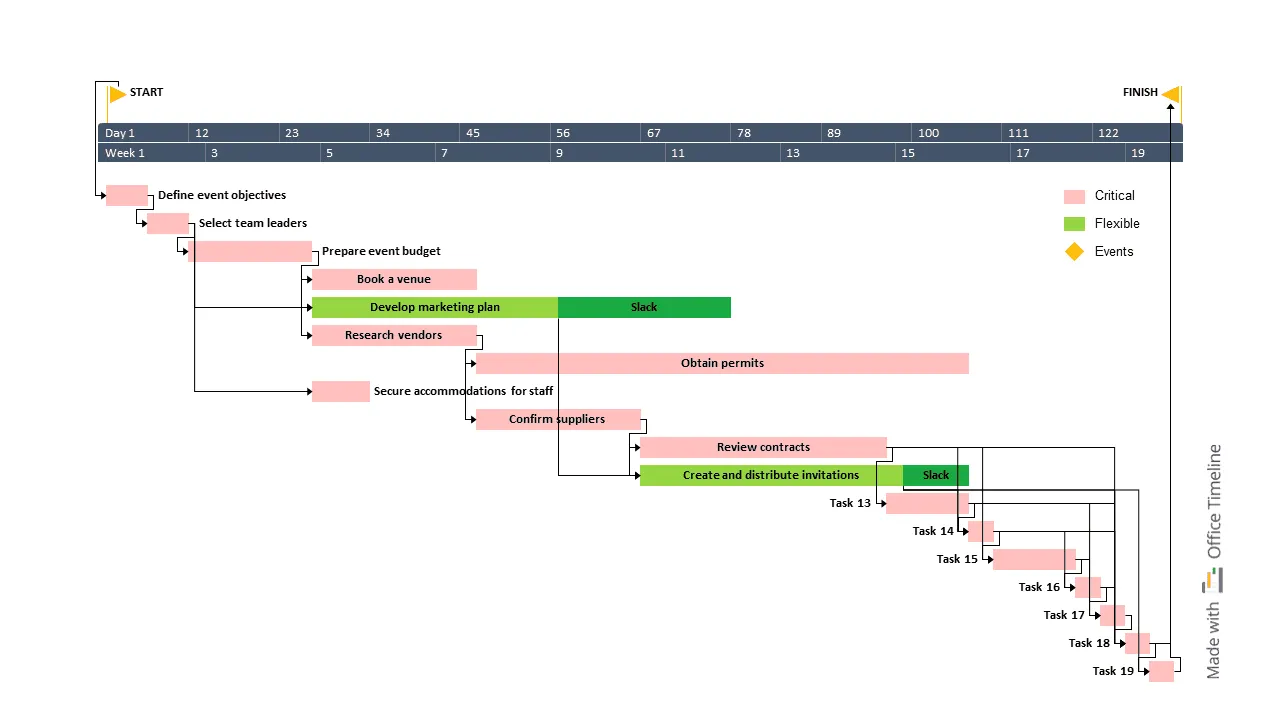
Event planning
Event planners rely on Gantt charts to coordinate vendors, manage logistics, and ensure that everything comes together on time for successful events. These charts help break down complex event projects into manageable tasks with clear deadlines and responsibilities.
A wedding planner might use a Gantt chart to track venue booking, catering arrangements, vendor coordination, and client communications across months of preparation. Corporate event planners map out speaker coordination, venue setup, technology requirements, and marketing timelines to ensure smooth execution.
The visual timeline makes it easy to spot potential conflicts, like needing the same vendor for setup and breakdown activities, and adjust plans accordingly. Event Gantt charts also help communicate timelines to clients and stakeholders who need to understand what's happening when leading up to their event.
Online Gantt chart tools and templates make it easier than ever for event planners to create professional project timelines without specialized software knowledge. These accessible tools help even small event planning businesses organize complex projects with the same systematic approach used by large corporations.
Advanced features of Gantt chart software
Modern Gantt chart software has evolved beyond simple bar charts and timelines. Today's tools include powerful features like automatic scheduling, resource management, and real-time collaboration that help project managers handle complex projects more effectively and respond quickly when things change.
These advanced capabilities can transform Gantt charts from static planning documents into dynamic project management systems that are adaptable and help with coordination across different locations and time zones.
Automatic scheduling
Smart scheduling features automatically adjust your project timeline when task dependencies or durations change. When one task gets delayed, the software automatically shifts dependent tasks to maintain realistic timelines without manual recalculation.
This dynamic adjustment helps project managers spot potential bottlenecks before they become major problems. If a critical task gets extended by three days, you can immediately see how that impacts your final deadline and which other tasks might need attention.
Automatic scheduling also makes it easier to explore "what if" scenarios. You can test how adding resources to certain tasks or changing the sequence of work might improve your overall timeline. This planning flexibility helps you make better decisions about resource allocation and project strategy.
Resource management integration
Advanced Gantt chart tools help you balance workloads across team members and avoid overcommitting your best people. Resource management features show you who's available when and help identify conflicts where multiple tasks need the same person at the same time.
These tools often include cost tracking capabilities that let you monitor resource expenses as they occur and compare actual costs against budgeted amounts. You can see not just whether your project is on schedule, but whether it's staying within financial constraints.
Visual resource allocation helps ensure that tasks have adequate staffing while preventing burnout from overloaded team members. When you can see each person's workload across multiple projects, it becomes easier to distribute work fairly and keep everyone productive without overwhelming anyone.
Real-time collaboration
Modern Gantt chart software enables multiple team members to update and edit project timelines simultaneously, regardless of their location. This real-time collaboration eliminates the confusion of outdated versions and ensures everyone works with current information.
Team members can add comments, attach files, and update task progress directly within the Gantt chart interface. This centralized communication reduces email back-and-forth and creates a clear record of project decisions and changes.
The immediacy of real-time updates helps teams respond quickly to changing circumstances. When a client changes requirements or a vendor delivers materials early, the entire team can see the impact on the project timeline and adjust their work accordingly.
The project manager's role
With these advanced features, the project manager's role shifts from manual timeline maintenance to strategic oversight and team coordination. Project managers still define project scope, identify tasks and dependencies, and allocate resources, but the software handles much of the routine updating and calculation work.
Project managers use these tools to focus on higher-level activities like stakeholder communication, risk management, and strategic planning. The Gantt chart becomes a communication hub that helps project managers keep everyone informed about project status, upcoming priorities, and potential challenges.
Modern Gantt chart software also improves how project managers communicate with stakeholders. Instead of creating separate status reports, they can share live project views that show real-time progress and automatically update as work progresses. This transparency builds trust and keeps everyone aligned on project expectations and timelines.
How to use Gantt chart timelines for project success
Want to turn your project from a stress-filled juggling act into something you can actually manage? Gantt chart timelines help you see the big picture while keeping track of all the moving parts. These visual schedules show what needs to happen when, who's doing what, and how everything connects together.
The best part? Modern Gantt chart tools can automatically figure out your critical path (which tasks absolutely have to happen on time or your whole project gets delayed). This helps you know where to focus your energy and worry less about the stuff that has some wiggle room.
Make sure everything actually matters
Sometimes it can feel like your team is stuck doing busy work that doesn’t really move the project forward. The best Gantt charts fix this by making sure every task has a clear purpose that connects to your main goals.
Take a hard look at each item on your chart and ask yourself: "If this task disappeared tomorrow, would it actually hurt our project?" If the answer is no, cut it or change it. Your team will thank you for not wasting their time on pointless work.
Check in on this regularly throughout your project. When priorities shift or new requirements pop up, update your chart to match. Teams work better when they can see how their daily tasks actually help the project succeed, rather than just checking boxes.
Stay on top of what's really happening
Here's where Gantt charts really shine: they show you the difference between what you planned and what's actually happening. No more guessing whether you're on track or secretly falling behind.
Set up weekly check-ins to update your chart with real progress. When something takes longer than expected, you can immediately see how it affects other work and your final deadline. Sometimes you can catch up by moving people around or doing tasks at the same time instead of one after another.
Catching problems early gives you way more options to fix them. Your Gantt chart becomes like an early warning system. Instead of discovering you're three weeks behind schedule at the last minute, you spot delays when you can still do something about them.
Keep everyone informed without boring them
Nobody likes sitting through long, confusing status meetings. Gantt charts let you show project status in a way people can understand at a glance. Instead of reading through pages of updates, stakeholders can see exactly where things stand and what's coming up.
Adjust what you show based on who you're talking to. Your boss probably wants to see major milestones and overall timing, while your team needs the nitty-gritty details about dependencies and deadlines. The same chart works for both; you just show different levels of detail.
Regular visual updates build trust because people can see real progress happening. When stakeholders understand where the project stands, they're more likely to support you when you need extra resources or have to make tough decisions. Plus, visual updates cut down on those "what's the status?" emails that eat up your day.
Conclusion: bringing it all together
Gantt chart timelines can turn your project nightmare into something you can actually handle. Instead of feeling like you're constantly putting out fires, you get a clear visual plan that shows everyone what needs to happen and when.
What makes Gantt charts so useful is how they take all the messy details floating around in your head and put them on paper (or screen) where you can see everything at once. When you can look at one chart and understand your whole project timeline, who's doing what, and how tasks connect, decisions become way less stressful.
Today's Gantt chart tools are pretty amazing compared to what project managers had to work with even a few years ago. Real-time updates mean your whole team can see changes instantly. Automatic scheduling fixes your timeline when things shift. Resource management features help you avoid overloading your best people. All of this happens while keeping the simple visual format that makes Gantt charts so easy to understand.
From construction and software development to major event planning, Gantt charts offer a proven method for staying organized. The trick is sticking to good habits: keep the chart updated, involve your team in planning, watch for tasks that might cause delays, and use the visual layout to keep stakeholders informed.
Start simple, figure out what you're trying to accomplish, list what needs to get done, estimate how long things will take, and map out what depends on what. Once you're comfortable with the basics, try out fancier features that might make your life easier.
Learning to use these tools well is worth the effort. You'll finish projects more reliably, stress less about what you might be forgetting, and spend less time explaining to people what's going on. Your future self will thank you for getting organized.
Frequently asked questions about Gantt chart timelines
Project managers and team members often have questions about how to get the most out of Gantt chart timelines. Here are answers to the most common questions about creating, using, and maintaining these useful project management tools
A Gantt chart is a visual project management tool that shows your tasks, timelines, and how different pieces of work connect to each other. Think of it as a roadmap for your project that helps you see the big picture while keeping track of all the details. Instead of having scattered notes and deadlines, you get one clear view of what needs to happen when.
Gantt charts make project management much easier by giving you a visual overview of timelines and tasks so you can see how everything fits together. They improve team communication because everyone can look at the same chart and understand project status immediately. Plus, they help with resource planning by showing you when people are busy and when they're available for new work.
A good Gantt chart includes four main parts:
- task lists that break down all the work that needs to happen,
- timeline bars that show when each task starts and ends,
- milestones that mark important deadlines or achievements,
- dependencies that show which tasks have to finish before others can start.
These elements work together to give you a complete picture of your project schedule.
Step 1: Start by figuring out what your project is trying to accomplish and list out all the tasks and subtasks needed to get there.
Step 2: Estimate how long each piece will take and identify which tasks depend on others.
Step 3: Then choose a tool, anything from Google Sheets to specialized project management software, and input your information to create the visual timeline. Start simple and add complexity as you get more comfortable.
Here are some of the best practices for using Gantt charts:
- keep your chart current by updating it regularly with actual progress, not just what you hoped would happen;
- get input from your team when planning and updating since they often have the best sense of realistic timelines;
- focus on your critical path, the tasks that could delay your whole project if they run late;
- use the visual power of your chart to communicate with stakeholders instead of writing long status reports they probably won't read anyway.
A timeline simply shows events in chronological order, while a Gantt chart shows tasks with their durations, dependencies, and resource assignments. Timelines are good for showing what happened when, but Gantt charts are built for managing what needs to happen next. If you're planning and managing work, you need a Gantt chart. If you're just documenting events, a timeline works fine.
Yes, you can create basic Gantt charts in Excel using stacked bar charts, though it takes some formatting work to make them look right. Excel works fine for simple projects with a few tasks, but dedicated Gantt chart software offers features like automatic dependency updates, resource management, and team collaboration that Excel can't match. For serious project management, specialized tools are worth the investment.
