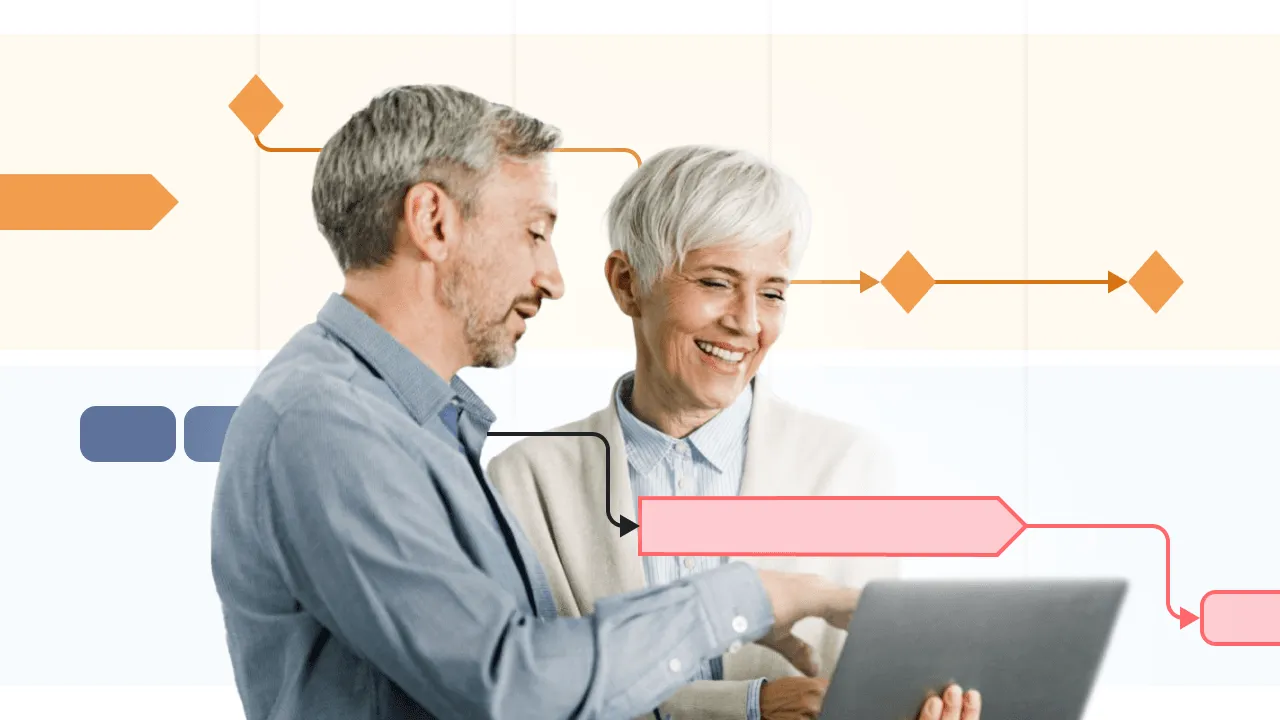
Timelines are visual tools that organize events in chronological order, making complex information easier to follow. They come in different forms, such as chronological timelines, roadmaps, and Gantt charts, each suited for specific purposes in fields like project management and education. Creating an effective timeline involves selecting the right format, using the right templates, and applying clear design principles to improve readability and engagement.
This article explains timelines in detail, covering what they are, how they work, and their main components – all with practical, visual examples. It also looks at how timelines are used in different fields, from project management and research to history, healthcare, and business planning.
For a broader overview of timelines and their uses, explore our introduction to timelines.

Defining a timeline
A timeline visually represents a sequence of events in chronological order, allowing viewers to quickly grasp the progression of events. This visual format clarifies the significance and sequence of each event.
Timelines list dates and events organizing information in a structured way. They clearly detail historical events or project milestones, making it easy for viewers to understand the flow and importance of each event. This structured approach makes timelines valuable in fields, from education, where they help students understand historical events, to project management, where they can be used to track milestones and deadlines in a project plan.
Essential components of a timeline
To create an effective timeline, you need certain basic components. Each event on a timeline typically includes a date, which establishes a clear chronological order so viewers can see when each event happened. Descriptions add context to these events, providing more detail and helping to create a more complete image.
A timeline's main elements typically include:
- Time scale: This defines the duration covered by the timeline, whether it's days, years, or centuries.
- Event markers: These are specific points on the timeline that highlight important events, tasks or milestones.
- Labels and descriptions: These provide context and details about each event, making it easier to understand the significance of each marker.
- Visual elements: Icons, colors, and shapes can be used to differentiate between types of events or to highlight important information.
- Layout: The arrangement of the timeline, whether horizontal, vertical, or interactive, affects how information is presented and consumed.
These components work together to create an informative timeline that clearly communicates its intended message.
How timelines are used
Timelines can be used for storytelling as well as visualizing projects and processes. Complex information becomes easier to understand when presented in a clear, chronological order. For instance, in project management, timelines help track progress and ensure that tasks are completed on schedule. In education, timelines are used to illustrate historical events, making it easier for students to grasp the sequence and significance of past events.
Main types of timelines
Timelines are designed to serve different purposes, audiences, and contexts. Each timeline type offers a particular way to organize and present information based on the nature of the data and how it needs to be understood. The most common types include:
- Sequential timelines: visually represent events in the order they occur, facilitating the understanding of historical developments and project progress.
- Gantt charts: visual project management tools that display tasks, their durations, and dependencies along a horizontal timeline, showing project progress.
- Roadmaps: outline strategic plans and steps necessary to achieve business objectives.
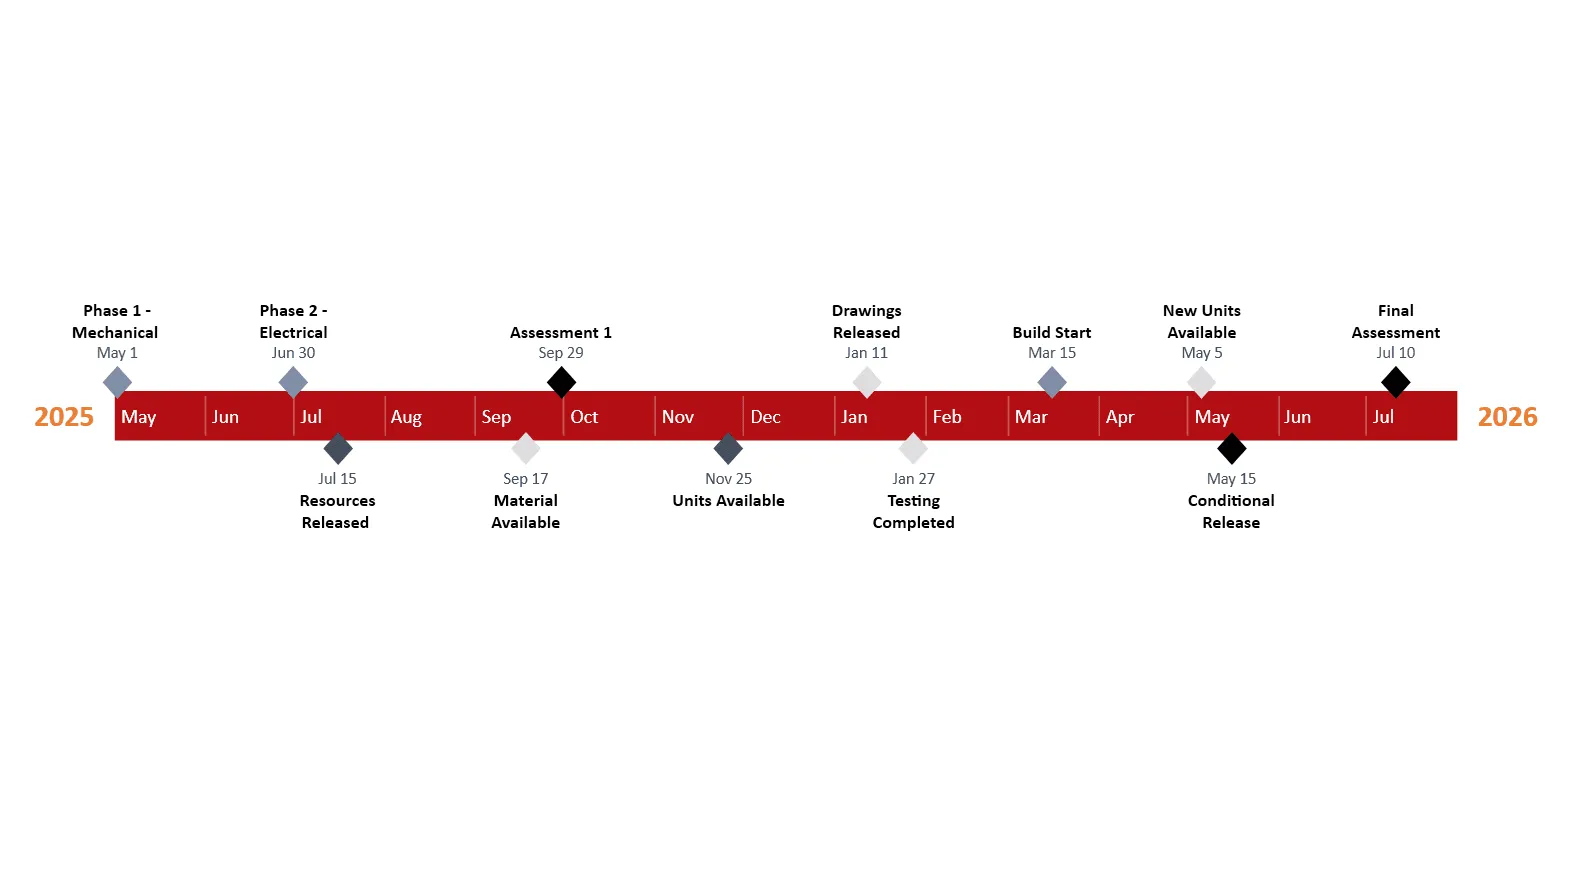
Sequential (chronological) timelines
Sequential timelines are designed to represent events in the order they occur, helping to visualize the progression of key events and their relationships.
Horizontal timelines are commonly used for chronological events, providing a clear and straightforward way to follow the sequence of occurrences. Vertical timelines are ideal for hierarchical data or when space is limited (e.g., mobile screens).
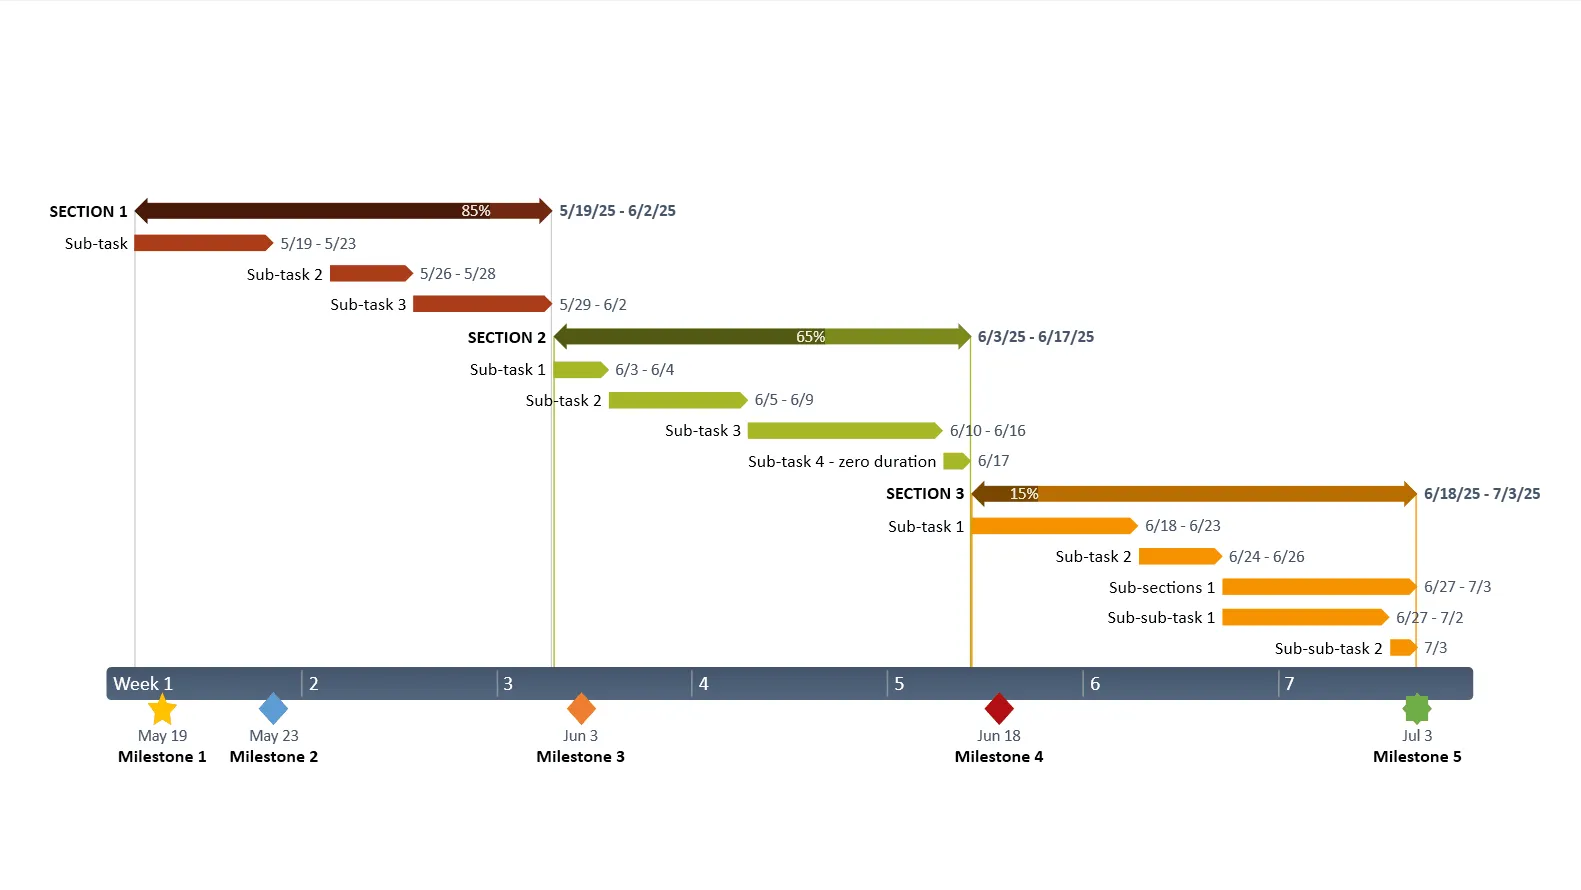
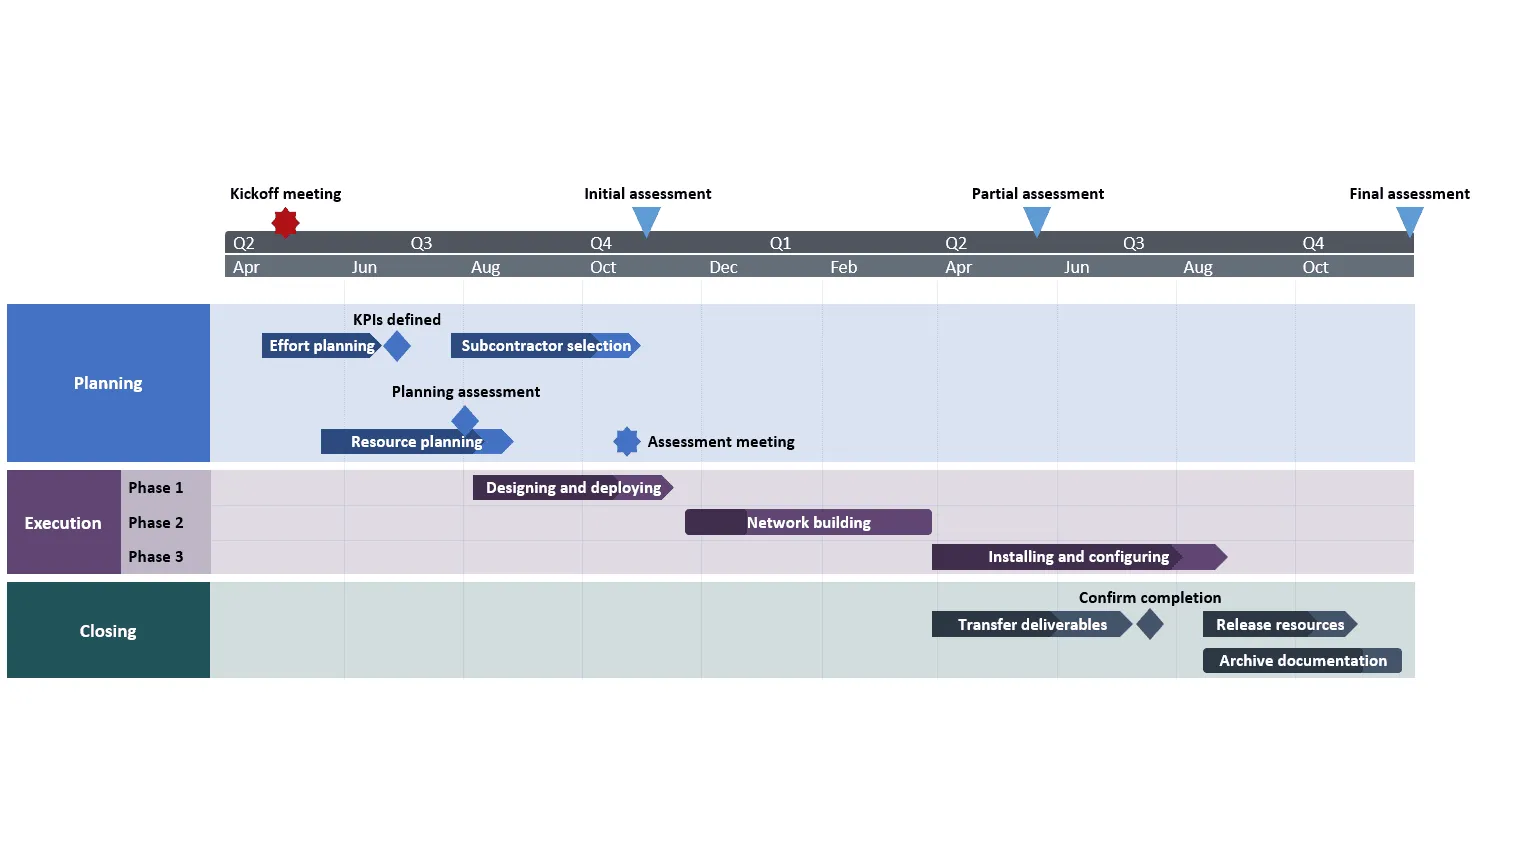
Gantt charts
Gantt charts are tools needed in project management, providing a visual representation of project timelines. They help project managers track progress, manage tasks, and meet deadlines effectively. Gantt charts display task schedules visually, enabling teams to see what needs to be done and when.
These charts typically include editable milestones that highlight key dates and progress markers, making it easier to track the project’s status and communicate with stakeholders. Gantt charts streamline project management by enhancing clarity on timelines, improving communication, and supporting deadline adherence.
Roadmaps
Roadmap timelines are strategic tools used to outline a company’s planning and steps necessary to achieve business objectives. They provide a visual representation of long-term goals and the milestones needed to reach them, aligning project goals with broader business objectives. This alignment ensures that all team members understand the strategic direction and their role in achieving it.
Roadmaps often include key milestones and deliverables, which assist in tracking progress toward long-term goals. Roadmaps offer a clear, structured overview, helping project managers and teams stay focused on the big picture and ensuring important events and deadlines aren’t overlooked.
Creating your own timeline
Creating a timeline, whether from scratch or using a pre-designed template, involves organizing and presenting information in a clear, structural way that effectively communicates your intended message to your audience.
Timeline templates can streamline the process by providing a ready-made framework that can be customized to fit specific projects. This can save time and also ensures that the timeline is professionally designed and easy to understand.
Choosing the right format
The format of your timeline significantly impacts how your information is perceived:
- Horizontal timelines work well for chronological events spanning definite periods
- Vertical timelines are ideal for detailed processes or when space is limited
- Spiral or circular timelines can effectively show cyclical events or ongoing processes
- Interactive timelines allow viewers to explore information at their own pace
Consider your audience's needs and viewing context. For presentations, simpler formats with fewer entries often work best, while detailed research might benefit from comprehensive formats with multiple layers.
Customizing your timeline
Customization is key to creating a timeline that is both visually appealing and easy to understand. Incorporating distinct colors can enhance readability and make important events stand out. Using icons that resonate with the content can also add visual interest and make the timeline more relatable.
Here are some aspects to take into account for improved customization:
- Color coding: Use consistent colors to group related events or indicate importance.
- Typography: Choose readable fonts and establish a hierarchy with different sizes and weights.
- Icons and visuals: Select relevant images that complement rather than distract from your content
- White space: Include adequate spacing between elements to prevent visual overload
- Consistent scale: Maintain proportional time intervals to accurately represent chronology
Personalizing your timeline with design elements creates a more engaging storytelling experience. This approach not only improves clarity but also ensures that your audience remains interested and invested in the narrative.
Advanced tips
Crafting an effective timeline is both an art and a science - a delicate balance between storytelling and information design. The following tips will help you create timelines that not only communicate facts but also engage your audience in meaningful exploration through time.
Create a draft timeline before finalizing to ensure logical flow and completeness.
Begin by sketching a rough draft of your timeline. This allows you to visualize the sequence of events and identify any gaps or inconsistencies in your data. Ensure that the chronology is accurate and that all essential events are included. This draft stage helps prevent errors and ensures smooth, logical progression in the final version. Consider using sticky notes or a whiteboard to easily rearrange events.
Limit the amount of text for each event to maintain clarity.
Keep event descriptions concise and focused. Use keywords and short phrases to convey the essential information. Avoid lengthy paragraphs that can overwhelm the viewer. Aim for clarity and readability. If more detailed information is necessary, consider using tooltips, pop-up boxes, or hyperlinks to supplementary resources. A good rule of thumb is to focus on the 'who, what, when, and where' of each event.
Include a clear title and, if necessary, a brief explanatory introduction.
A clear, descriptive title immediately informs the viewer about the timeline's subject. If the topic is complex or requires context, provide a brief introductory paragraph. This introduction should set the stage, explain the timeline's scope, and highlight its purpose. For example, “A timeline of the industrial revolution: 1760-1840” or “Project X timeline: from concept to launch”.
Consider adding context with brief annotations for key events.
Annotations can provide valuable background information and explain the significance of key events. Use brief notes or callouts to highlight the impact or consequence of a particular event. For instance, you could add a note explaining the political climate surrounding a historical event or the technological advancements that led to a project milestone. Use annotations to enhance understanding and provide deeper insights.
Test your timeline with someone unfamiliar with the content to ensure it’s intuitive.
Before finalizing your timeline, ask someone who is unfamiliar with the subject matter to review it. Observe their reactions and ask for feedback. This testing process helps identify any areas where the timeline may be confusing or unclear. Pay attention to how easily they can follow the sequence of events and understand the relationships between them. Their feedback will help you refine the design and ensure that the timeline is accessible to a wider audience.
Remember that the most effective timelines balance information density with visual clarity, guiding viewers through the narrative while keeping them engaged.
Tools and software for timeline creation
The right software can transform timeline creation from a tedious task into a streamlined process with professional results. Specialized timeline tools offer intuitive interfaces, pre-built templates, and powerful customization options that manual methods simply cannot match.
Advantages of timeline software
- Efficiency: Reduce creation time by up to 70% compared to general-purpose design tools.
- Consistency: Maintain visual coherence across multiple timelines and presentations.
- Data integration: Import event data directly from Excel, Project, or other data sources.
- Collaboration: Enable real-time team editing with version control and commenting features.
- Adaptability: Quickly adjust timelines when schedules change or new information emerges.
Popular timeline creation tools
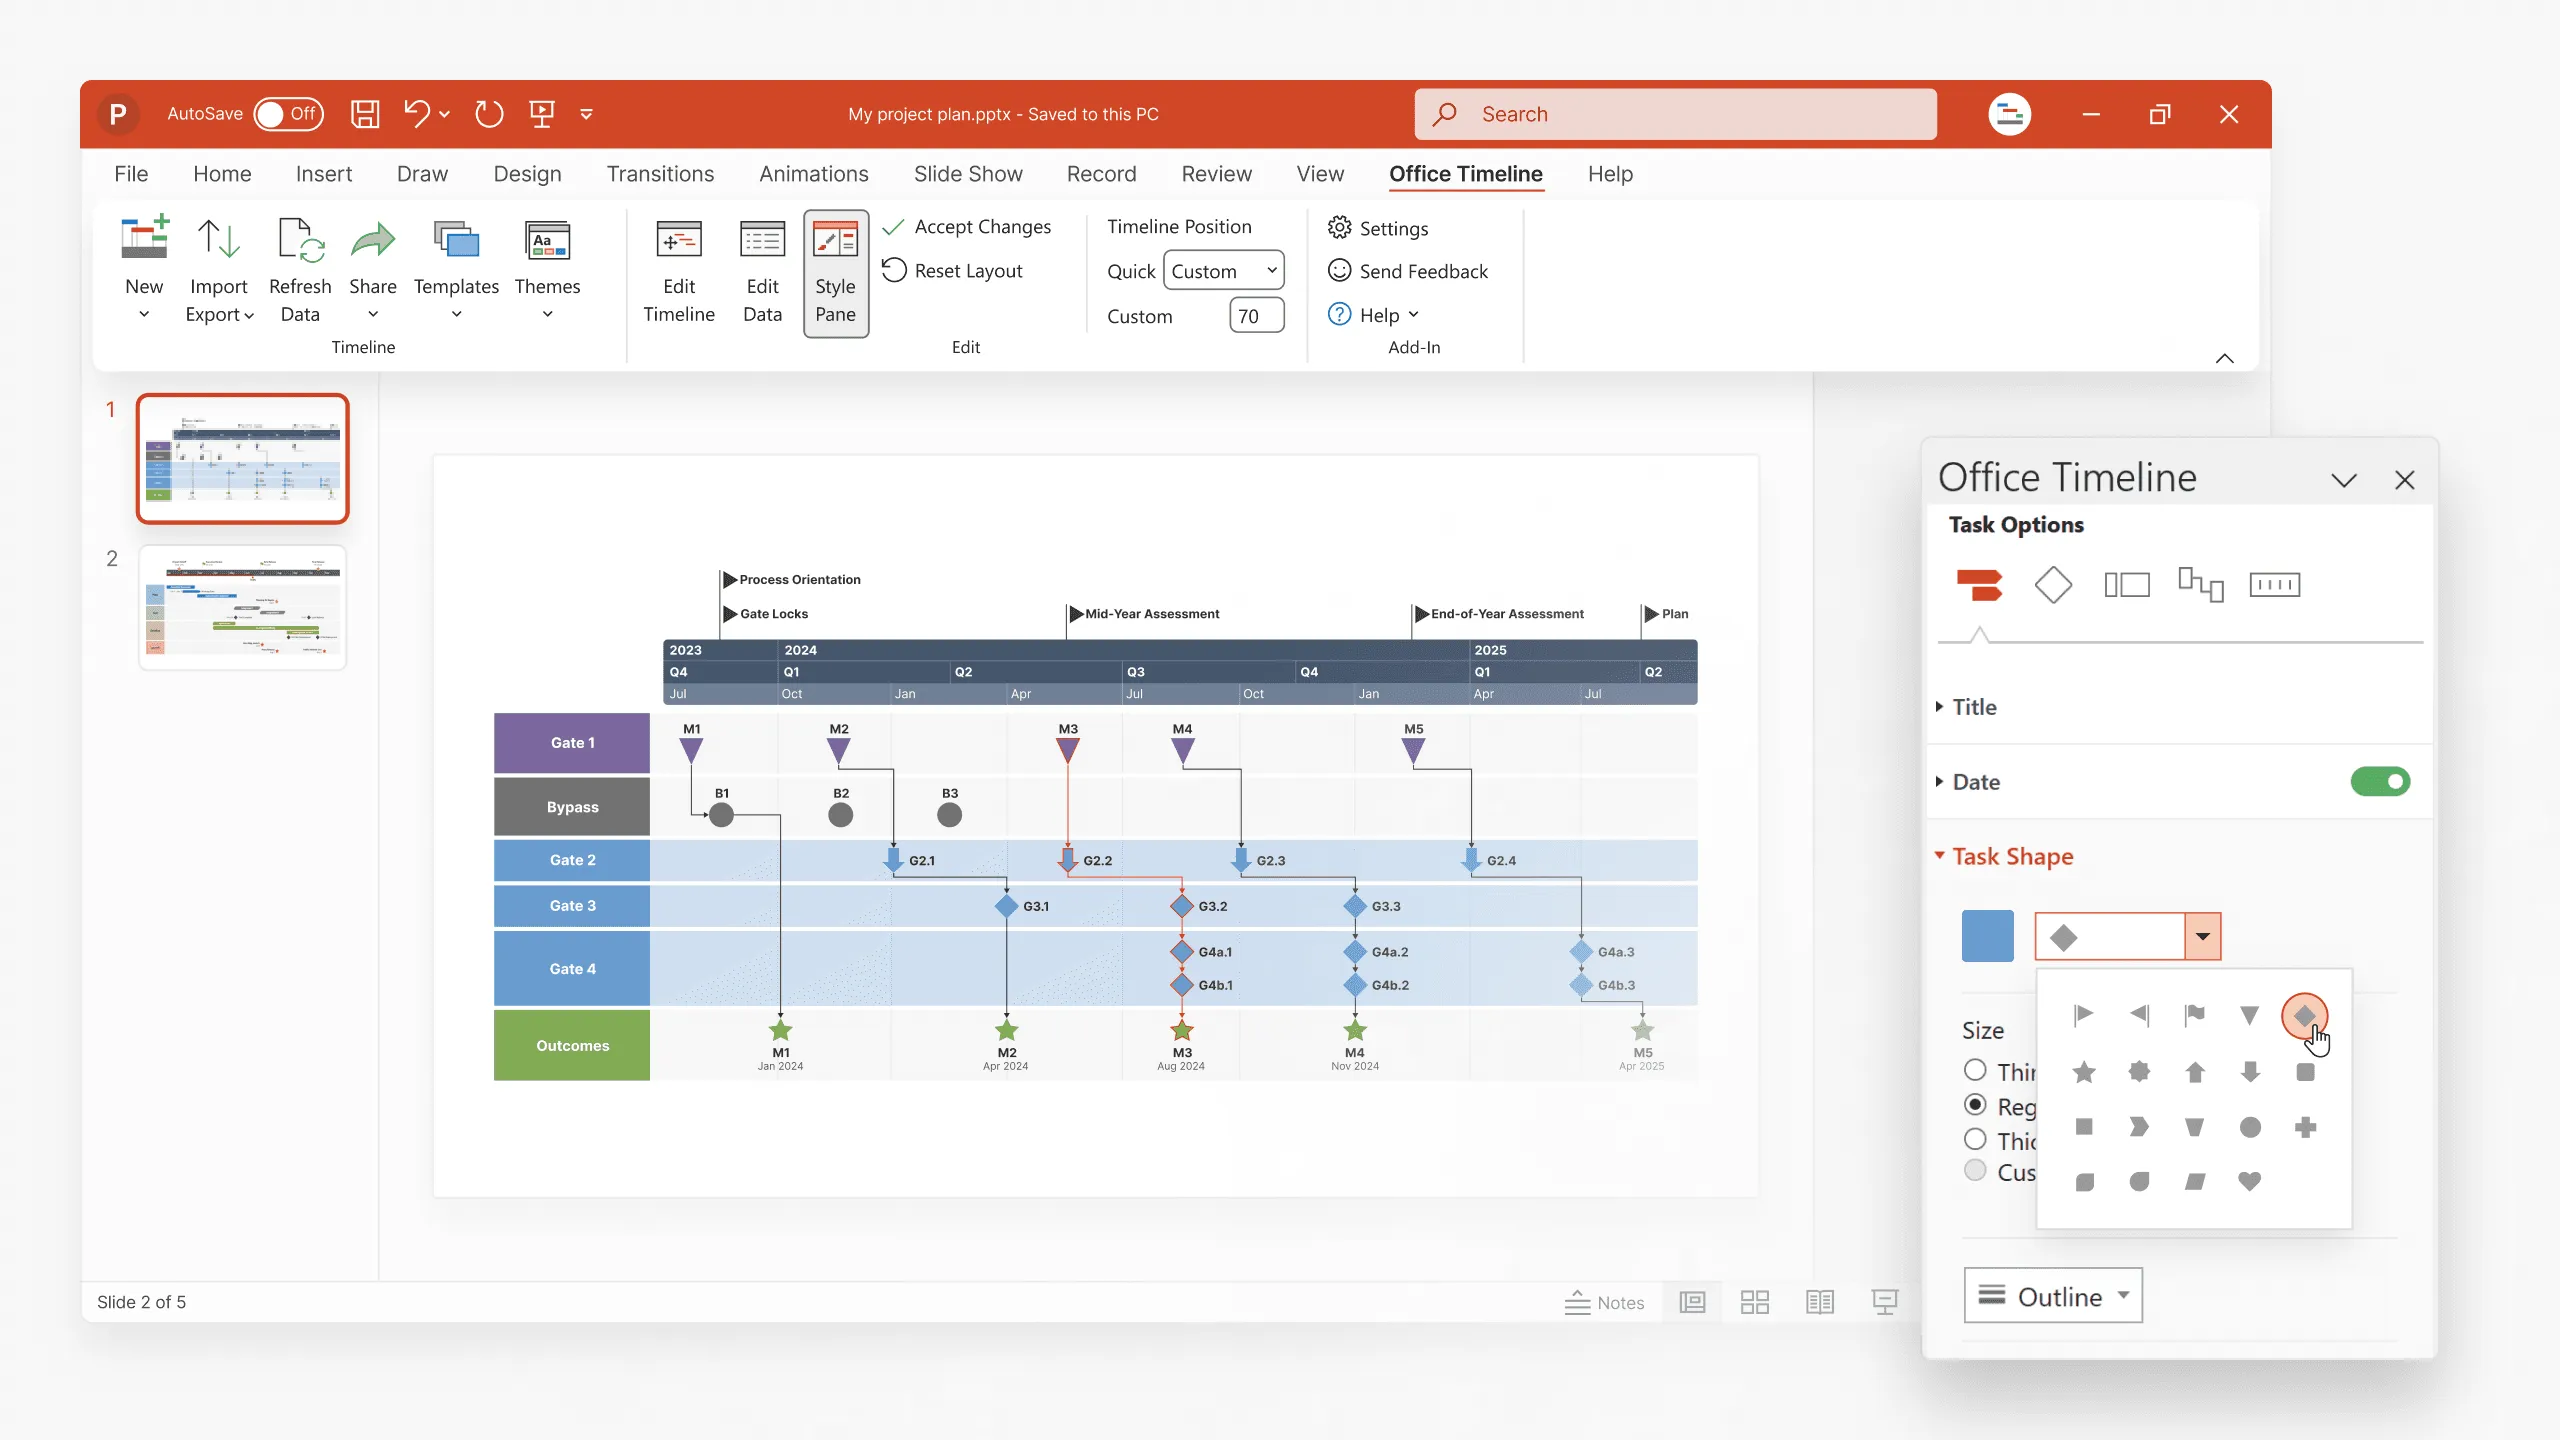
- Office Timeline: PowerPoint add-in that creates professional timelines and Gantt charts directly in familiar presentation software. Particularly effective for business and project management contexts. Integrates with Jira, MS Project®, Excel®, and Smartsheet.
- Office Timeline Online: Web-based version that offers similar functionality to the PowerPoint add-in but works in browsers without requiring desktop software installation, making it accessible across different devices and operating systems. Integrates with Google Sheets.
- Preceden: Web-based application with layering capabilities that excel at displaying complex chronologies with multiple parallel tracks of events.
- Lucidchart: Diagramming tool with specialized timeline templates that integrate seamlessly with team collaboration platforms like Slack and Microsoft Teams.
- Visme: Visual content creation platform with timeline infographic templates that balance aesthetic appeal with clear information presentation.
For teams working on collaborative projects, these tools provide shared workspaces where members can contribute information, suggest edits, and maintain a single source of truth for project chronologies. Most platforms offer cloud storage options, ensuring that the latest version is always accessible to all stakeholders regardless of location.
Start building better timelines
Try Office Timeline for free. Build polished, easy-to-understand timelines in PowerPoint. No learning curve.
Examples of timelines
Timelines are versatile tools that can be used across various fields. Different styles of timelines suit different needs, such as project management timelines, historical event timelines, and product development timelines.
These examples illustrate how timelines are used in different contexts to enhance clarity and organization, from historical events to managing project tasks and deadlines.
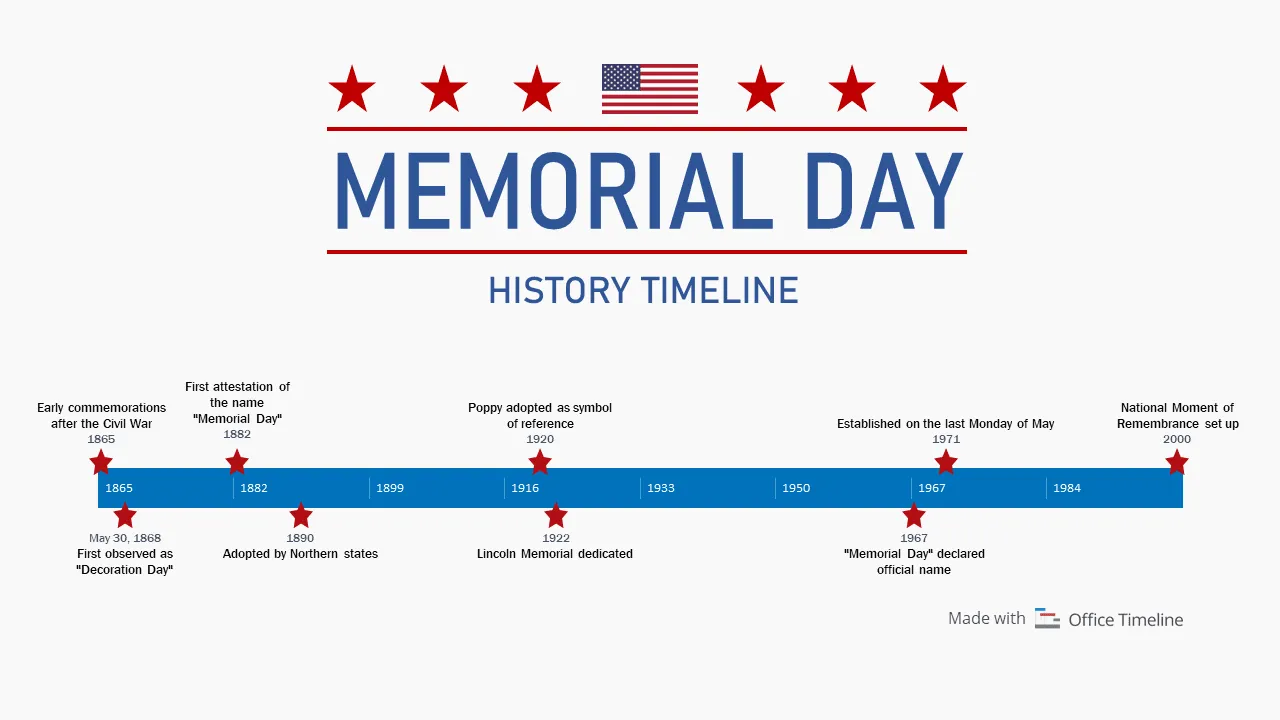
Historical event timeline
Historical timelines are excellent tools for illustrating significant events and their interconnections. For example, a timeline of the American Revolution and the Civil War can provide a clear chronological order of these events, helping us understand their sequence and significance. In education, such timelines are often used to help students grasp the progression of historical events and their impact on society.
Sequential timelines, like those used to illustrate the evolution of technology or historical progressions, offer a straightforward method for displaying historical data. This approach aids in the analysis and interpretation of trends, making it easier to comprehend the broader context of historical events.
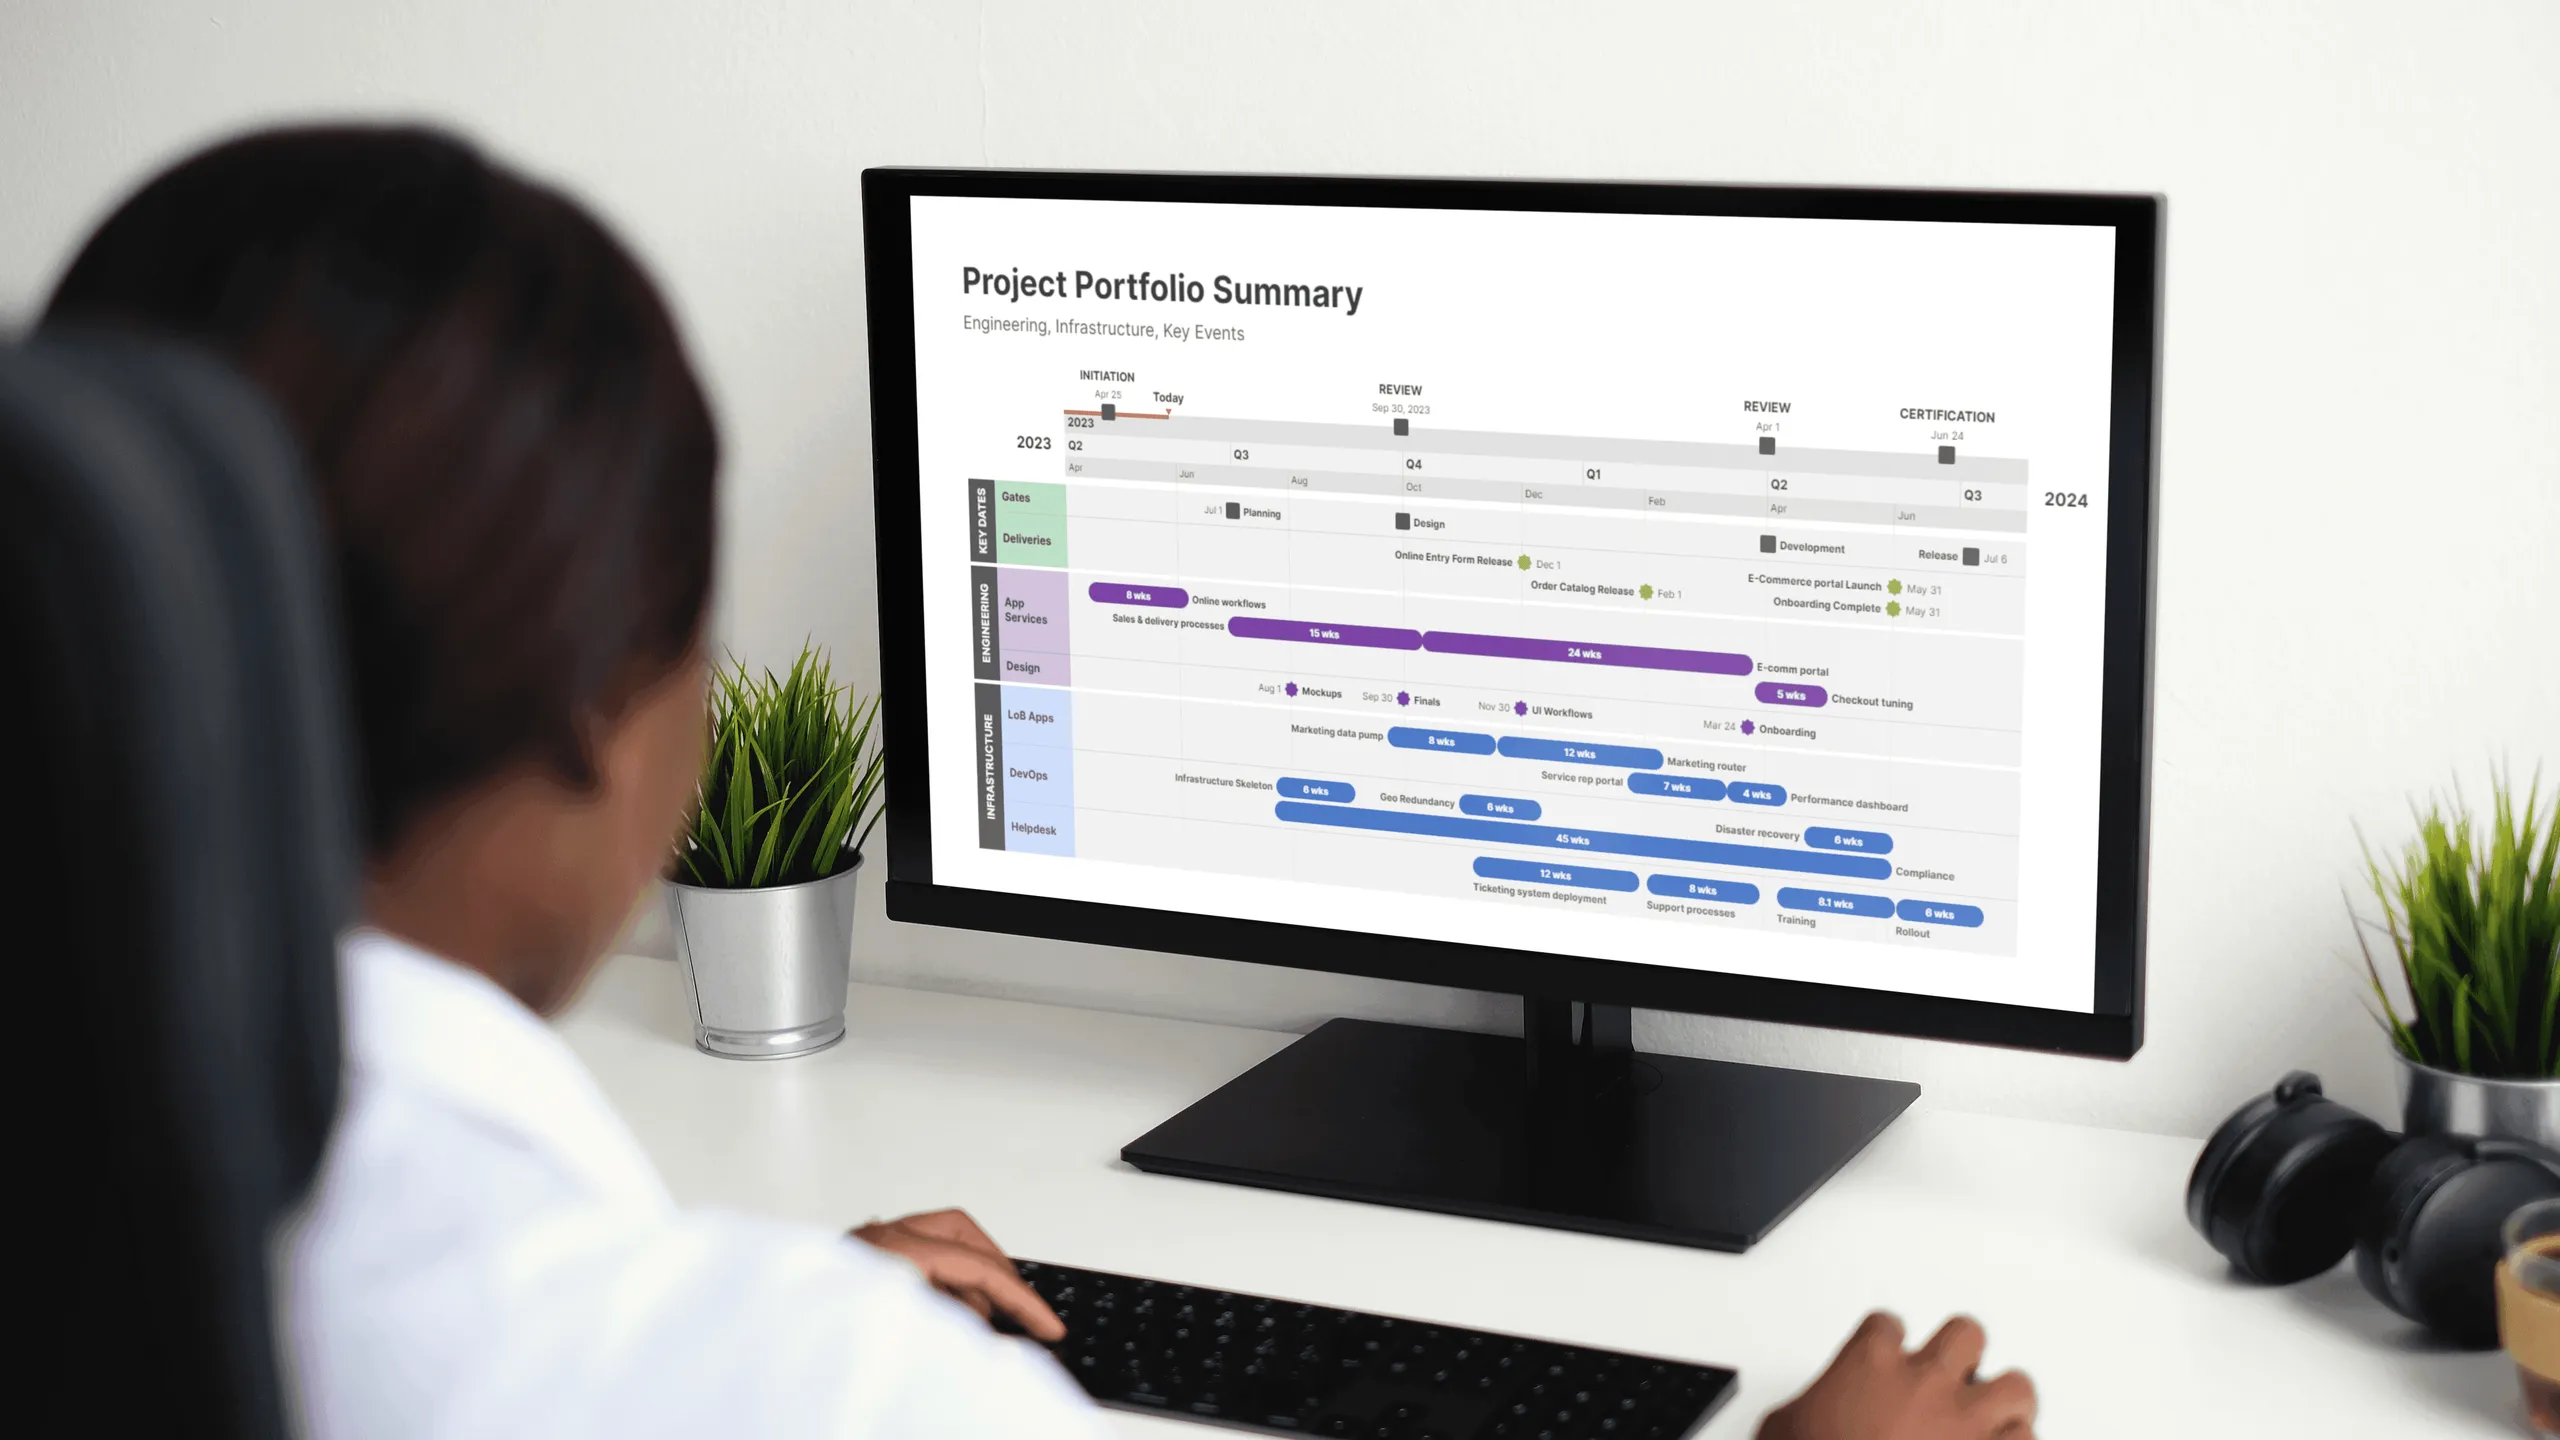
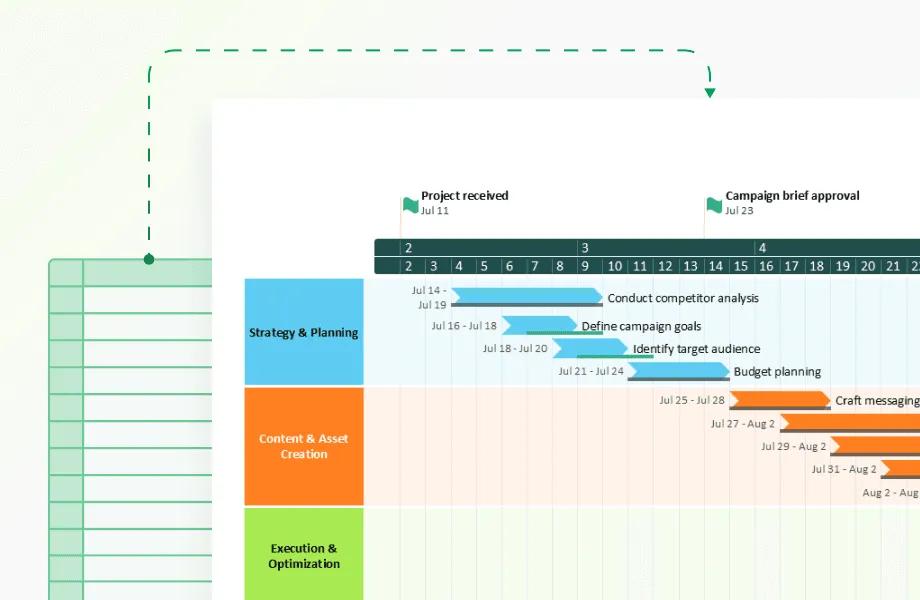
Project management timeline
A project management timeline is a visual representation of the project schedule, showcasing all tasks, events, and deadlines in a chronological order to facilitate tracking and management. Essential components of a project timeline include the tasks to be completed, deadlines, dependencies between tasks, milestones, and progress markers. This overview helps project managers track progress, meet deadlines, and prioritize tasks based on their timelines and dependencies.
Using a project timeline enables better communication with stakeholders, enhances accountability among team members, and provides clear visibility into project progress.

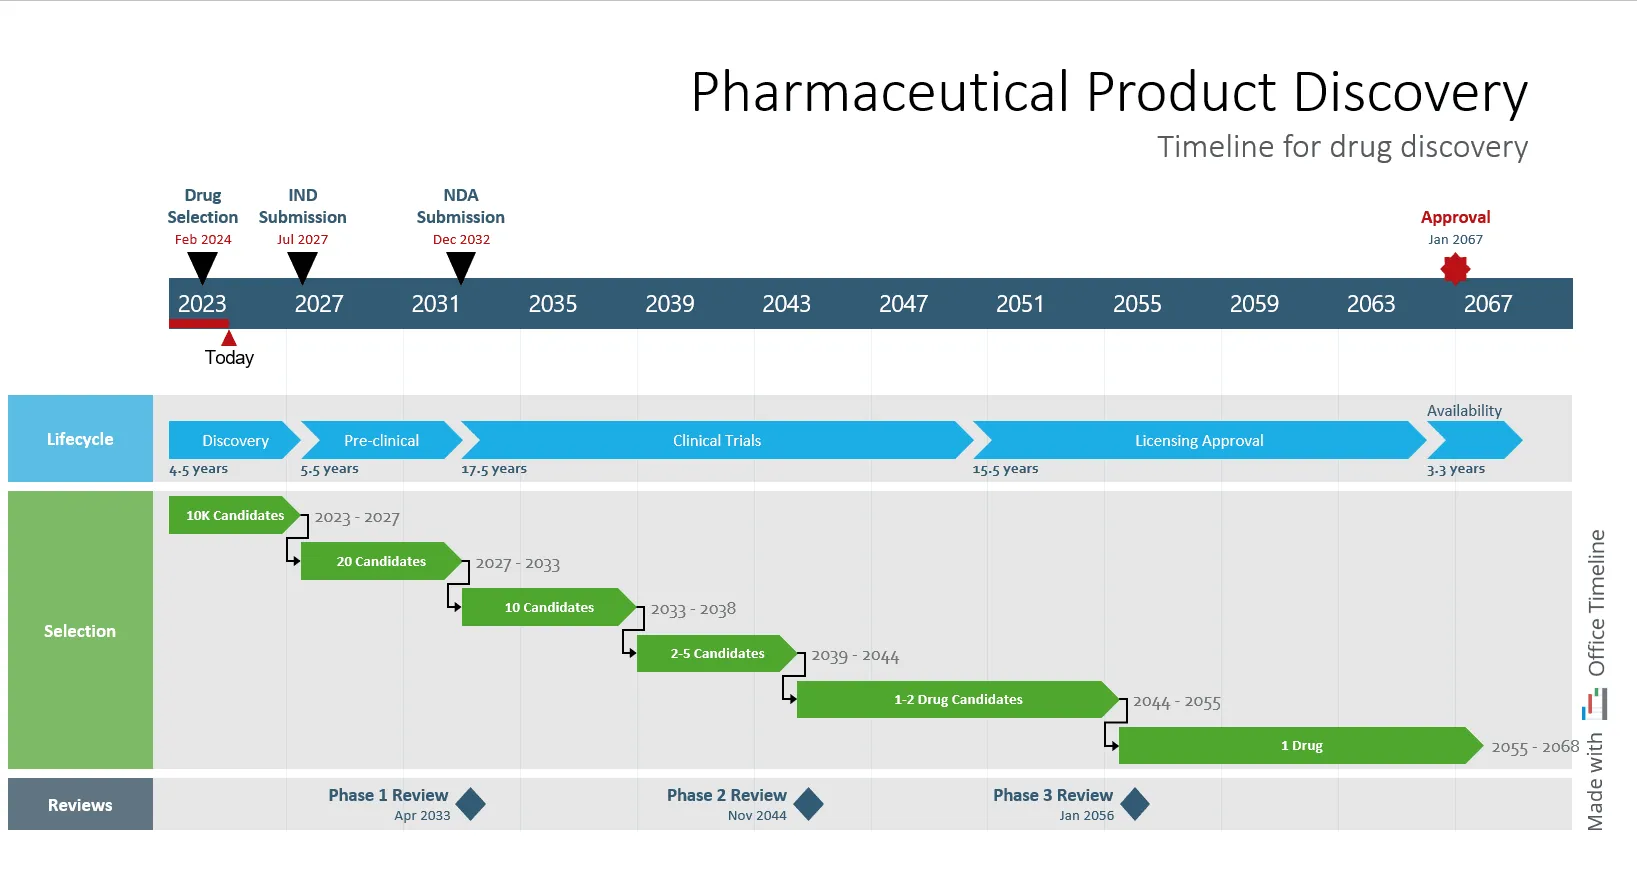
Product development timeline
Product development timelines are used to keep track of the various stages involved in bringing a product to market.
For instance, a pharmaceutical product discovery timeline documents the journey from research to commercialization, helping professionals stay on track in drug development. This timeline outlines key milestones like research phases, clinical trials, and regulatory approvals, ensuring timely completion of all necessary steps.
Product timelines offer a clear, organized overview of the development process, helping teams stay focused and aligned with their goals. This structured approach is crucial for the successful development and launch of new products.
Benefits of using timelines
Timelines provide clear advantages in various fields, from project management to historical research. They transform abstract information into visual sequences that show relationships between events and deadlines.
Enhancing visual storytelling
Timelines organize information chronologically, making complex sequences easier to understand and see at a glance. For example:
- In legal cases, juries grasp event sequences better when presented visually rather than through testimony alone.
- Historical timelines show connections between events that might otherwise seem unrelated.
- Medical case timelines help doctors track symptom progression and treatment effects.
- Education timelines break down complex historical periods into digestible segments.
This visual format highlights cause-and-effect relationships that might be missed in text-based presentations. Educational research shows viewers retain 65% more information when it's presented in a visual timeline format compared to text alone.
Improving project management
Project timelines give project managers and teams practical tools to:
- show exact start and end dates for each task;
- display task dependencies (which tasks must finish before others can begin);
- highlight bottlenecks before they cause delays;
- mark milestones to celebrate progress;
- allocate resources more efficiently by showing when team members are needed.
For example, a software development timeline might show the UI design must be completed before coding begins, and testing must happen before release. Without this visual representation, teams often miss these dependencies until problems arise.
Facilitating historical analysis
For historians, timelines provide a structured way to analyze historical events over time. A historical timeline can effectively represent major events in chronological order, helping to visualize the progression of history. This visualization allows historians to identify and examine the connections between different historical events, providing deeper insights into historical trends and patterns.
Historians use timelines to:
- place events in precise chronological order;
- compare developments across different regions or civilizations;
- spot patterns that emerge over decades or centuries;
- identify periods of rapid change versus stability;
- examine how long-term trends develop.
A well-constructed historical timeline might reveal that technological innovations often cluster together, or that social changes frequently follow economic shifts by predictable intervals. These patterns become visible when events are laid out sequentially, allowing researchers to form more accurate theories about historical cause and effect.
When analyzing the Industrial Revolution, for instance, a timeline makes it clear that steam engine improvements, factory system development, and transportation innovations happened in close sequence, not as isolated events.
Conclusion
Timelines turn complex information into simple visual sequences. They work by arranging events in order, showing what happened when, and how events connect to each other.
This guide covered the basics of timelines - from what they are and what parts they need, to the different types that work for specific purposes. We looked at real examples from historical records to business projects, and product planning.
Good timelines do three things well:
- make stories easier to follow;
- keep projects on schedule;
- show patterns in history and data.
Whether you need a simple project schedule or a detailed historical record, the right timeline makes information clearer and more meaningful. Use timelines when you need to explain "when" and "in what order" - they show these things better than paragraphs of text or tables of numbers.
Ready to create professional timelines without the learning curve? Office Timeline offers an intuitive solution that turns your project data into stunning visual timelines in minutes.
Try Office Timeline and experience how easily you can transform complex schedules into clear, impressive presentations that keep stakeholders aligned and projects on track. No design skills required — just your project information and a few clicks to communicate your timeline effectively.
FAQs
Here are the answers to some frequently asked questions about timelines.
A timeline should consist of events, dates, descriptions, and visual markers to effectively convey the chronological order of occurrences. These components are vital for creating a clear and engaging representation.
Timelines serve to illustrate key phases, deadlines, and task dependencies in project management. They help monitor progress and prioritize tasks effectively. This facilitates the timely completion of projects, ensuring efficiency and clarity in the workflow.
The common types of timelines are chronological timelines, roadmaps, and graph charts. Each serves a distinct purpose, catering to historical events, strategic planning, or data visualization.
Timelines enhance visual storytelling by simplifying complex sequences into a chronological format, making narratives easier to understand and communicate effectively. This clarity is particularly beneficial in fields such as legal cases, historical analysis, and research.
