
Timeline data surrounds us everywhere. Stock prices fluctuate by the minute, website traffic ebbs and flows throughout the day, and sales numbers climb and dip across seasons. While traditional timelines show events in chronological order, statistical timeline models dig deeper; they reveal patterns, predict future trends, and transform raw chronological data into predictive intelligence.
Statistical timeline models represent a sophisticated approach to understanding data that changes over time. These models use mathematical techniques to identify patterns, forecast future values, and make sense of complex temporal relationships that would otherwise remain invisible in simple chronological displays. For readers interested in the technical side of temporal modeling, our guide on timelines in data science offers additional context.
This article explores how these powerful analytical tools work and demonstrates their practical applications across various industries.
What are statistical timeline models?
Statistical timeline models are mathematical frameworks that analyze data points collected over time to identify patterns, trends, and relationships. Unlike basic timelines that simply display events chronologically, these models apply statistical methods to timeline data to extract meaningful insights and make predictions.
These models work by examining how values change across time periods, identifying recurring patterns, and using this information to forecast future behavior. They can process everything from daily temperature readings to quarterly business metrics, transforming chronological data into predictive intelligence.
The power of statistical timeline models lies in their ability to separate signal from noise. While raw timeline data might appear chaotic, these models can identify underlying trends, seasonal patterns, and cyclical behaviors that inform decision-making.
Before diving into specific modeling techniques, it's important to understand how time series analysis breaks down complex timeline data into manageable components.
Core components of time series analysis
Time series analysis forms the backbone of statistical timeline models by decomposing data into four distinct components that work together to explain temporal behavior.
- Trend analysis identifies the general direction of data over time. Think of a company's revenue growing 15% annually or a website's traffic declining after a competitor launch. These underlying movement patterns might span months or years, providing the foundational trajectory that other components build upon.
- Seasonal patterns capture recurring fluctuations that happen at predictable intervals. Ice cream sales peak every summer, tax software downloads surge in spring, and streaming services see viewership spikes during winter holidays. These patterns repeat with clockwork precision, making them highly predictable once identified.
- Cyclical variations represent longer-term fluctuations that don't follow fixed periods. Economic recessions might occur every 8-12 years, housing markets cycle over decades, and technology adoption follows irregular waves. Unlike seasonal patterns, cyclical variations have variable lengths and amplitudes.
- Random noise represents unpredictable fluctuations that don't follow any discernible pattern. A server outage causing a traffic dip, an unexpected mention on social media driving sales, or measurement errors in data collection all contribute to random variation that statistical models must account for.
Understanding these components separately allows analysts to build more accurate models and make better predictions. With this foundation in place, we can explore the specific mathematical approaches that capture these patterns.
Types of time series models
Choosing the right statistical model can make the difference between accurate predictions and misleading forecasts. A retail company analyzing daily sales needs different modeling approaches than a manufacturing plant tracking hourly production rates or a financial analyst predicting quarterly earnings. The key lies in matching model characteristics to your data's specific patterns and forecasting requirements.
Autoregressive (AR) models
AR models predict future values based on past observations of the same variable. These models assume that current values depend on recent historical values, making them effective for data with clear temporal dependencies.
An AR model might use the past five days of stock prices to predict tomorrow's price, or analyze the previous quarter's sales figures to forecast next quarter's performance.
Moving average (MA) models
Moving average models focus on the error terms from previous predictions rather than the actual values. These models excel at smoothing out short-term fluctuations to reveal underlying trends.
The simple moving average technique replaces current values with averages of recent observations, reducing noise and clarifying long-term patterns. This approach proves particularly valuable for volatile data where individual observations might be misleading.
ARIMA models
Autoregressive integrated moving average (ARIMA) models combine AR and MA approaches while accounting for non-stationary data—data whose statistical properties change over time.
ARIMA models handle three components:
- autoregressive (AR) elements that use past values;
- integrated (I) components that difference the data to achieve stationarity;
- moving average (MA) parts that incorporate past forecast errors.
This combination makes ARIMA models particularly robust for real-world data that exhibits complex patterns and changing statistical properties.
Advanced modeling approaches
Stock prices that swing wildly during earnings announcements, website traffic that spikes unpredictably during viral social media events, or manufacturing output that depends on dozens of interconnected variables - these scenarios require modeling techniques that go beyond basic statistical approaches.
Exponential smoothing models work like a weighted memory system; recent observations carry more influence than older ones through exponentially decreasing weights. This makes them particularly effective for data where yesterday's values matter more than last month's.
Double exponential smoothing adds trend handling for growing or declining datasets, while triple exponential smoothing (Holt-Winters method) manages both trends and seasonal patterns simultaneously. Use these when your data shows clear patterns but you want recent changes to influence predictions more heavily.
Multivariate time series models recognize that most real-world phenomena don't exist in isolation. A restaurant's daily revenue depends on weather, local events, competitor actions, and economic conditions, not just historical sales patterns. These models incorporate multiple variables simultaneously, creating more robust predictions. For example, an energy company might combine temperature forecasts, economic indicators, and historical usage patterns to predict electricity demand more accurately than using consumption data alone.
Machine learning models like recurrent neural networks and LSTM (Long Short-Term Memory) networks excel at detecting subtle, non-linear patterns that traditional statistical methods miss. They can identify complex relationships in high-frequency trading data, recognize speech patterns in audio timelines, or predict equipment failures from sensor data streams. While more computationally intensive, these models often outperform traditional approaches when dealing with large datasets containing intricate patterns.
Understanding these different modeling approaches provides the foundation for applying them effectively. The real value emerges when these statistical techniques solve actual business problems and research challenges across various industries.
Practical applications in timeline analysis
A hedge fund manager needs to predict whether Tesla's stock will rise or fall in the next hour. An Amazon warehouse supervisor must forecast how many workers to schedule for next week's Black Friday rush. A hospital administrator wants to predict ICU bed demand during flu season. These aren't abstract statistical problems; they're real decisions where accurate timeline analysis directly impacts profits, operations, and lives.
Financial analysis transforms market chaos into trading strategies through precise statistical modeling. High-frequency trading algorithms analyze microsecond price movements to execute thousands of trades per second, while portfolio managers use ARIMA models to predict quarterly returns and adjust asset allocations. Credit card companies apply time series models to detect fraudulent spending patterns by comparing current transactions to historical user behavior, flagging unusual activity within seconds of a purchase.
Business forecasting turns sales data into operational intelligence that drives million-dollar decisions. Zara uses statistical timeline models to predict fashion trends and adjust production weeks before competitors, while Netflix analyzes viewing patterns to decide which shows to renew and when to release new content for maximum engagement. Ride-sharing companies like Uber deploy real-time forecasting models that predict demand surges and automatically adjust pricing to balance supply and demand across thousands of city zones.
Scientific research relies on timeline analysis to uncover patterns that span decades or detect changes that occur in milliseconds. Climate scientists use statistical models to separate natural temperature variations from human-caused warming trends, analyzing data spanning centuries. Medical researchers track drug effectiveness over time, identifying optimal dosing schedules and predicting patient responses. Seismologists apply advanced time series techniques to earthquake data, improving early warning systems that provide precious seconds of advance notice.
Operations management prevents costly failures and optimizes performance through predictive timeline analysis. Airlines use statistical models to predict engine maintenance needs, scheduling repairs before breakdowns occur and avoiding flight cancellations. Manufacturing plants monitor production line data in real-time, detecting quality issues before defective products reach customers. Logistics companies optimize delivery routes by forecasting traffic patterns, weather conditions, and package volumes to minimize fuel costs and delivery times.
These powerful applications demonstrate the potential of statistical timeline models, but achieving such results requires careful planning and execution. Success depends on following proven methodologies for model development and implementation.
Building effective statistical timeline models
Building statistical timeline models that deliver reliable predictions requires more than theoretical knowledge, you need a systematic approach that transforms raw data into actionable forecasts. Here's a practical roadmap that works whether you're analyzing sales data in Excel or building machine learning models in Python.
Data preparation workflow
Start with a data audit before diving into analysis. Examine at least two years of historical data to capture seasonal patterns, and ensure you have consistent measurement intervals - daily, weekly, or monthly data points work best for most business applications.
Step 1: Data collection and validation
- Download data from multiple sources (CRM systems, web analytics, financial databases) into a centralized location.
- Use tools like Excel's Data Validation or Python's pandas.describe() to check for consistency.
- Verify timestamps are correctly formatted and aligned across datasets.
- Aim for at least 100-200 data points for basic models, 500+ for complex seasonal patterns.
Step 2: Missing data strategies
- For gaps under 5% of total data, use linear interpolation in Excel (Data > Fill > Series) or pandas.interpolate() in Python.
- For seasonal data with missing periods, apply seasonal decomposition to estimate missing values.
- Never delete entire time periods. This breaks the temporal sequence that models depend on.
Step 3: Outlier detection and treatment
- Plot your data first using simple line charts to visually identify extreme values.
- Apply the IQR method: values beyond Q1 - 1.5×IQR or Q3 + 1.5×IQR are potential outliers.
- Don't automatically remove outliers. Investigate whether they represent real events (product launches, marketing campaigns) or data errors.
Step 4: Data transformation techniques
- Test for stationarity using visual inspection (constant mean and variance over time).
- Apply first differencing for trending data: subtract each value from the previous value.
- Use log transformation for data with increasing variance over time.
Practical model selection guide
Choose models based on your specific situation rather than complexity. A simple exponential smoothing model that you understand and can maintain often outperforms a complex neural network that becomes a "black box."
For business forecasting (sales, revenue, website traffic):
- Start with Holt-Winters exponential smoothing if you see clear seasonal patterns.
- Use ARIMA models when you need to explain results to stakeholders.
- Consider Prophet (Facebook's open-source tool) for data with strong holiday effects.
For operational data (manufacturing, logistics, quality metrics):
- Apply simple moving averages for stable processes with minimal trends.
- Use ARIMA models for processes with gradual changes over time.
- Implement control charts alongside forecasting for real-time monitoring.
Tool recommendations by skill level:
- Beginner: Excel with Analysis ToolPak, Google Sheets with timeline charts.
- Intermediate: R with forecast package, Python with statsmodels library.
- Advanced: Python with TensorFlow/PyTorch for neural networks, specialized software like SAS or SPSS.
Timeline visualization and communication
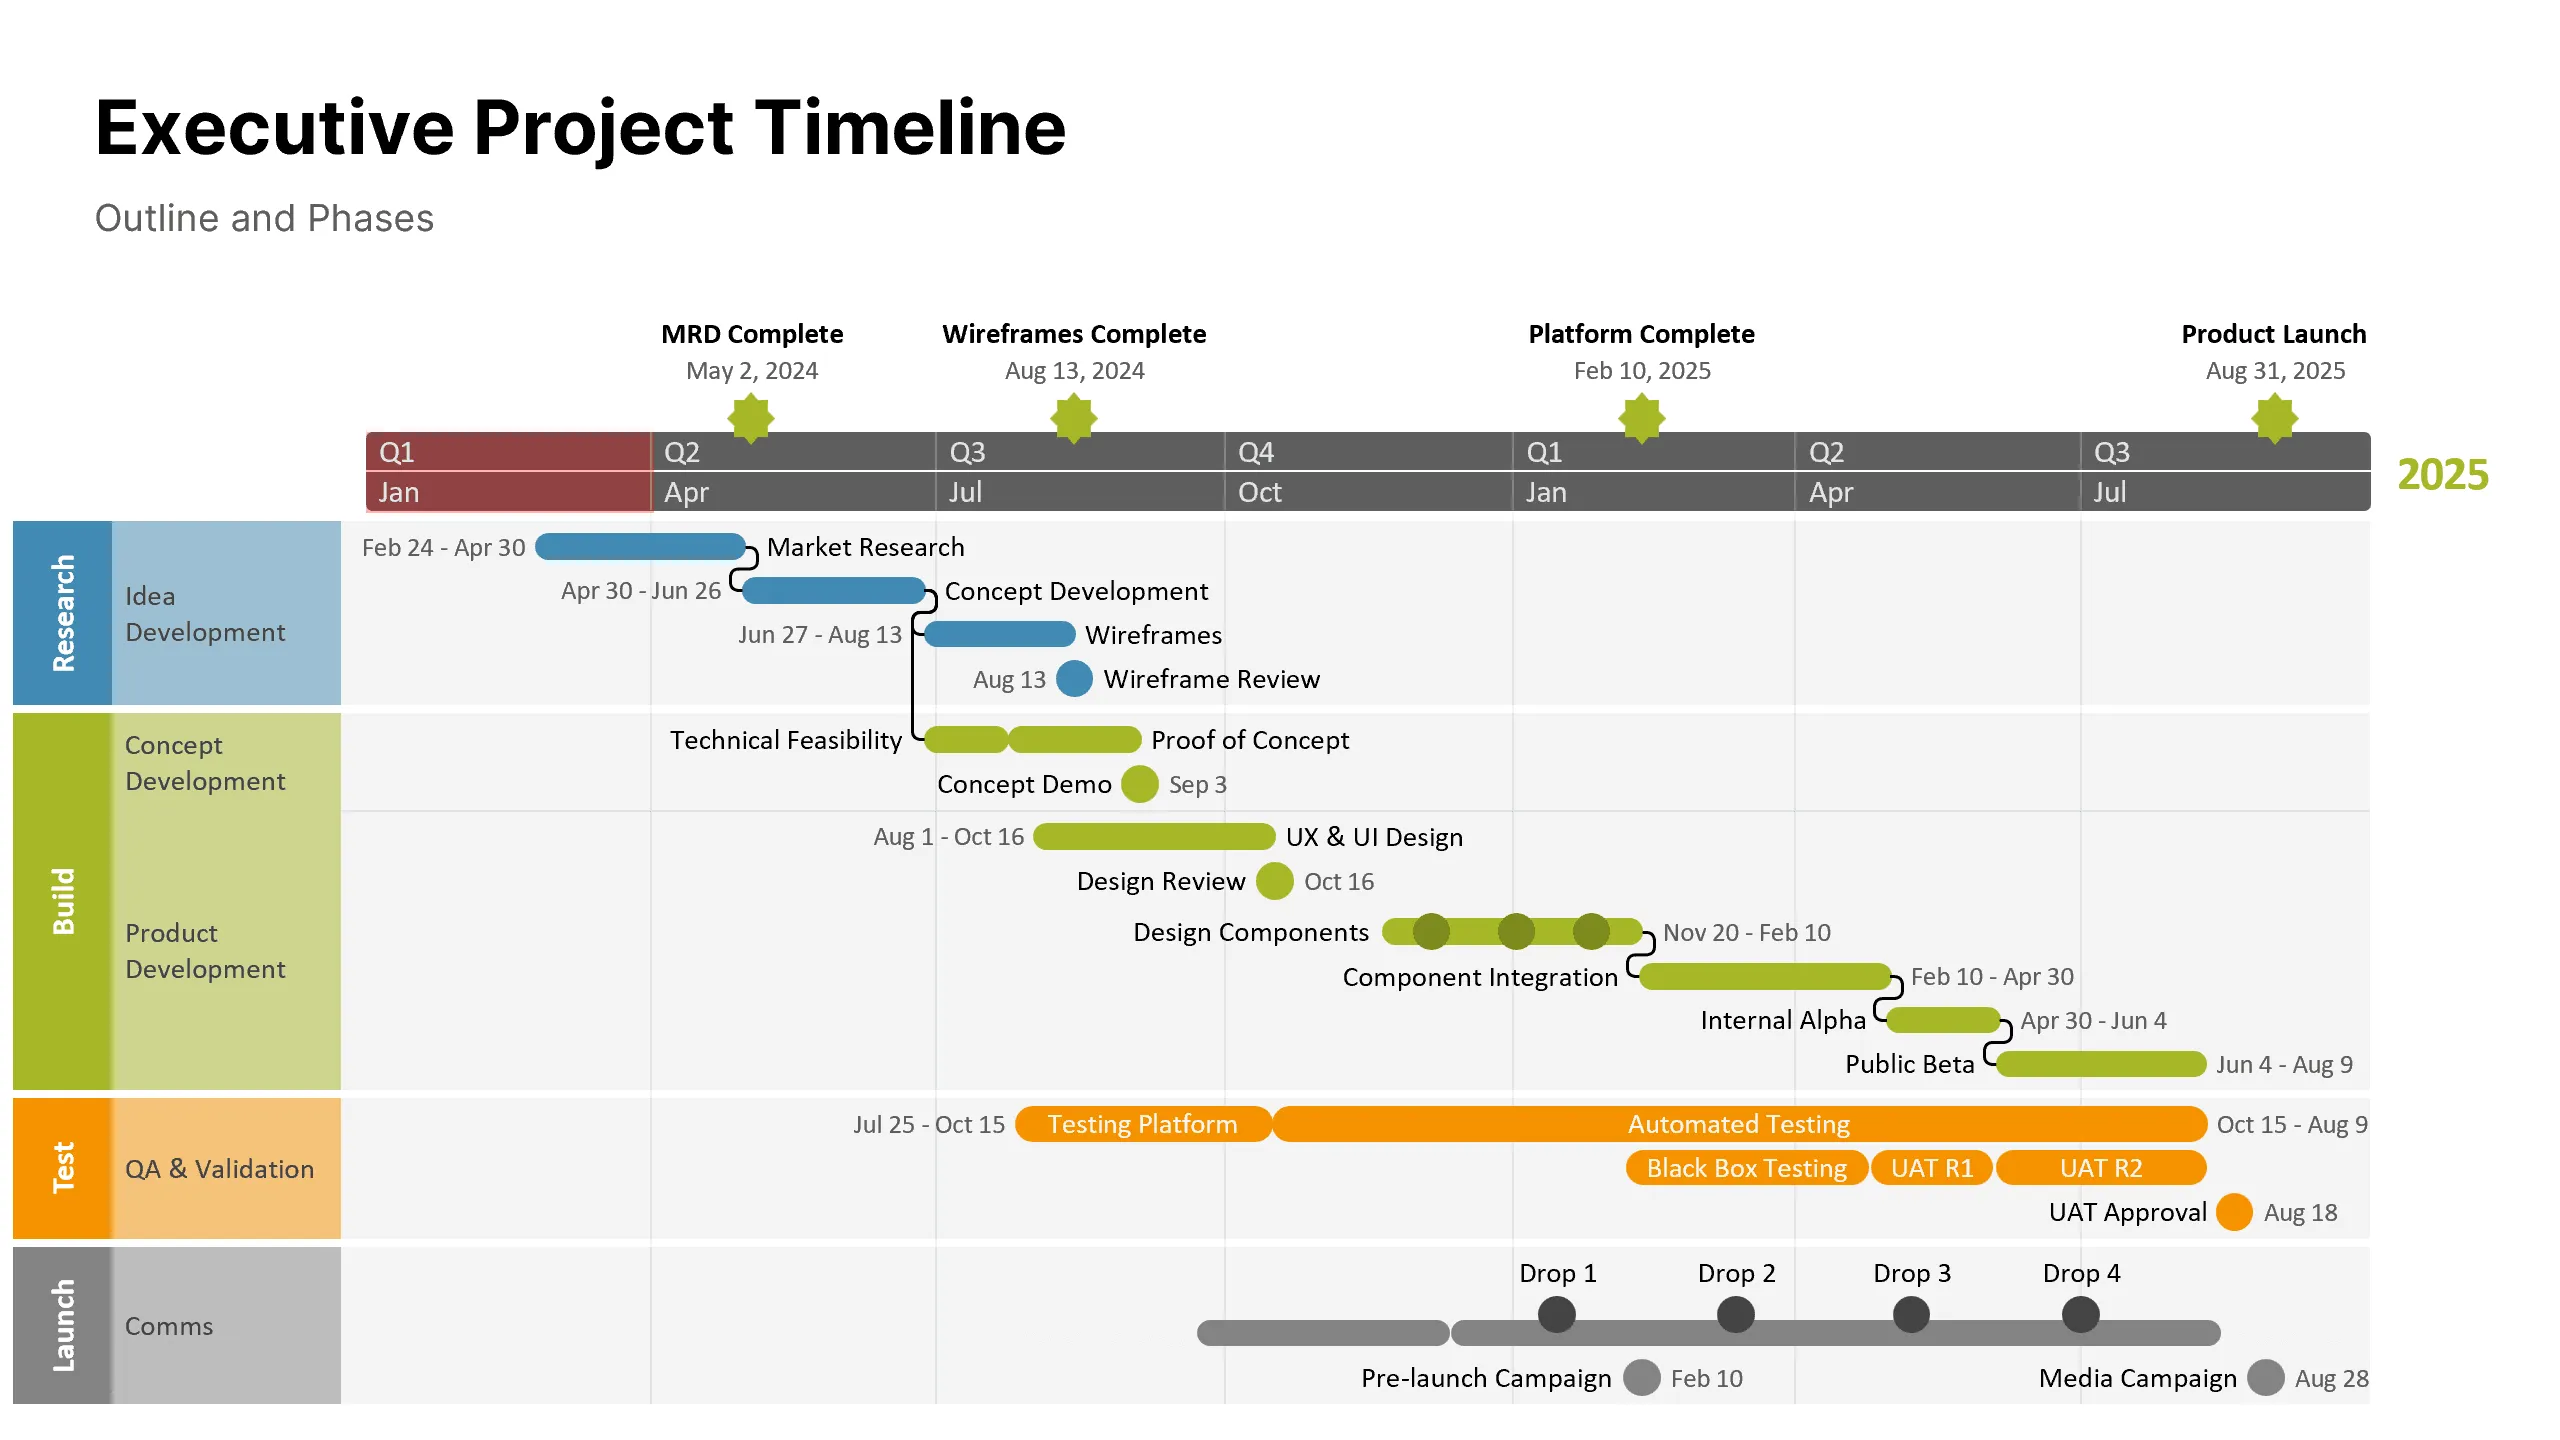
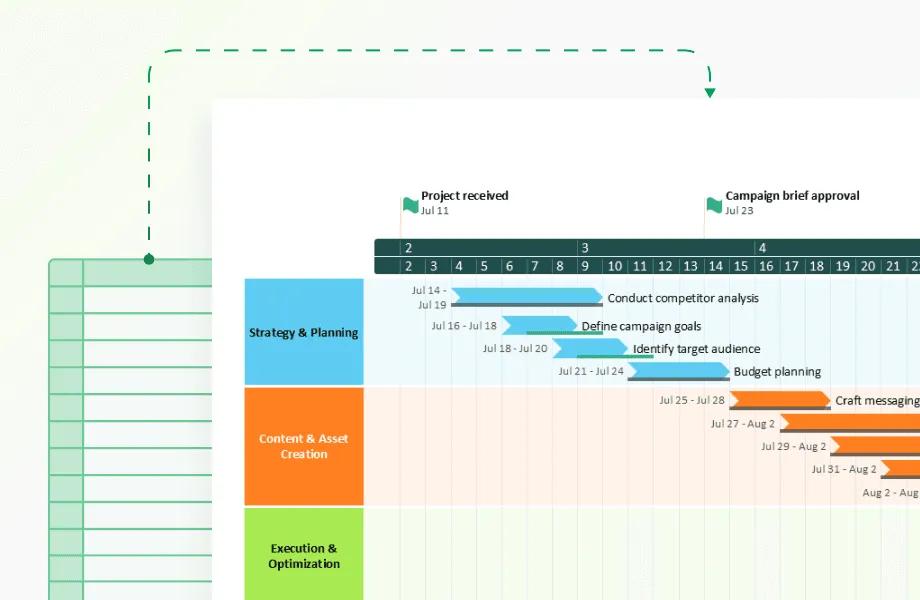
Effective statistical models need clear presentation to drive decisions. The professional timeline maker from Office Timeline transforms complex forecasting data into professional visual presentations that executives and stakeholders can immediately understand. This PowerPoint add-in specializes in creating timeline visualizations that combine historical trends with statistical forecasts, making it particularly valuable for presenting quarterly business reviews, project planning scenarios, and strategic forecasting results.
Timeline making tools like Office Timeline excel at displaying statistical timeline models because they automatically format dates, handles multiple data series, and creates clean, publication-ready charts that work well in board presentations. With Office Timeline, you can import forecast data directly from Excel or statistical software, then use templates to create compelling visuals that show confidence intervals, seasonal patterns, and trend projections without requiring design expertise.
Similar tools like Tableau, Power BI, Plotly, and D3.js offer different strengths for statistical timeline visualization. Tableau provides interactive dashboards perfect for exploring forecast scenarios, while Power BI integrates seamlessly with Microsoft's business ecosystem. Plotly excels at creating interactive web-based timeline charts, and D3.js offers unlimited customization for technical audiences.
Once you've selected your visualization tool and prepared your statistical model output, focus on creating timeline displays that tell a clear story. The goal is transforming numerical predictions into visual narratives that guide decision-making and highlight the most important insights from your analysis.
Create visual timelines that show:
- historical data as a solid line with confidence intervals displayed as shaded bands;
- forecast periods in different colors or line styles to distinguish predictions from observations;
- key events marked on the timeline (product launches, market changes, regulatory changes);
- multiple scenarios (optimistic, realistic, pessimistic forecasts) as separate series or overlays.
These visualization elements work together to create comprehensive timeline presentations that communicate both the certainty of historical trends and the uncertainty inherent in future predictions, making statistical timeline models accessible to any audience.
Visualize statistical output
Try Office Timeline for free. Transform model outputs into clean PowerPoint timelines that highlight trends, uncertainty, and projections.
Presentation best practices
Creating compelling visuals is only half the battle. Presenting statistical timeline models effectively requires translating technical results into business language that drives action. These practices help bridge the gap between statistical accuracy and stakeholder understanding:
- Include model accuracy metrics (MAPE, RMSE) but explain them in business terms ("typically accurate within 5%").
- Show prediction intervals to communicate uncertainty ("we're 95% confident sales will fall between $2M-$3M").
- Update forecasts regularly as new data becomes available and highlight what changed.
- Document your methodology so others can reproduce and maintain the models.
Following these presentation guidelines transforms statistical timeline models from technical exercises into strategic business tools that inform decisions and build confidence in analytical insights.
Model evaluation and refinement
Statistical timeline models require continuous evaluation and improvement. Common evaluation metrics include mean absolute error (MAE) and mean squared error (MSE), which measure prediction accuracy by comparing forecasts to actual values.
Cross-validation techniques test model performance on unseen data, while walk-forward optimization simulates real-world forecasting scenarios. Regular model updates incorporate new data and adjust parameters to maintain accuracy as conditions change.
Even with careful preparation and evaluation, statistical timeline models face inherent challenges that can impact their effectiveness. Understanding these obstacles and their solutions helps build more robust forecasting systems.
Common challenges and solutions
Statistical timeline models face several challenges that require careful consideration and specialized techniques to address effectively.
Non-stationarity occurs when data's statistical properties change over time. Differencing techniques and detrending methods can transform non-stationary data into stationary series suitable for modeling.
Seasonal complexity presents challenges when data exhibits multiple seasonal patterns or irregular seasonal behavior. Advanced seasonal decomposition methods and specialized seasonal models can handle these complexities.
Data quality issues including missing values, measurement errors, and inconsistent collection methods can significantly impact model performance. Robust preprocessing techniques and quality control measures help mitigate these problems.
Model overfitting happens when models become too complex and perform well on training data but poorly on new data. Regularization techniques, cross-validation, and model selection criteria help prevent overfitting.
Computational demands of complex models can limit practical implementation. Cloud computing resources, parallel processing, and model simplification techniques can address computational constraints.
Integration with timeline visualization
Imagine a sales dashboard that not only shows yesterday's revenue but predicts next month's performance with 95% confidence intervals, automatically highlighting when actual results deviate from forecasts. This seamless integration of statistical models with timeline visualization transforms raw predictions into actionable business intelligence.
Interactive exploration drives deeper insights through timeline visualizations that respond to user input. Click on a forecast spike to see which factors contributed most to the prediction. Hover over confidence bands to understand prediction uncertainty. Drag sliders to explore "what-if" scenarios. See how a 10% price increase might affect sales projections, or how seasonal marketing campaigns could shift demand patterns. Tools like Tableau and Power BI make these interactions possible without programming knowledge.
Real-time dashboard integration turns statistical timeline models into operational command centers. A logistics company's dashboard might display delivery time predictions that update every hour, automatically flagging routes where delays exceed normal patterns. Manufacturing dashboards can show quality metrics with trend predictions, triggering maintenance alerts before equipment failures occur. These systems work because they combine live data feeds with pre-trained statistical models that recalculate predictions continuously.
No-code statistical modeling democratizes advanced timeline analysis through integrated platforms. Salesforce Einstein Analytics automatically applies time series forecasting to CRM data. Google Analytics Intelligence uses machine learning to detect anomalies in website traffic patterns. Microsoft Excel's new forecasting features apply exponential smoothing with a few clicks. These tools embed sophisticated statistical techniques behind user-friendly interfaces, making timeline analysis accessible to business users without statistical training.
Custom integration opportunities exist for organizations with specific needs. APIs from platforms like Prophet, Amazon Forecast, and Azure Machine Learning allow developers to embed statistical timeline models directly into existing business applications. A retail chain might integrate demand forecasting into their inventory management system, while a streaming service could embed viewership predictions into content planning workflows.
The result is statistical timeline modeling that becomes part of daily operations rather than separate analytical exercises, creating organizations that predict and adapt rather than simply react.
As these integration capabilities mature and become more sophisticated, emerging technologies promise to make statistical timeline modeling even more powerful and accessible in the coming years.
Future developments in statistical timeline modeling
The field continues evolving with new techniques and technologies that expand the capabilities of statistical timeline models.
Machine learning integration combines traditional statistical methods with advanced algorithms that can detect complex patterns and relationships in timeline data. These hybrid approaches often outperform pure statistical or pure machine learning methods.
Big data applications handle massive datasets that traditional methods cannot process efficiently. Distributed computing and streaming analytics enable real-time statistical modeling of high-volume timeline data.
Automated model selection uses algorithms to choose optimal models and parameters automatically, reducing the expertise required to build effective statistical timeline models.
Real-time adaptation allows models to adjust continuously as new data arrives, maintaining accuracy in dynamic environments where patterns change rapidly.
These advances point toward a future where statistical timeline modeling becomes more automated, accurate, and accessible. Organizations that begin implementing these techniques now will be better positioned to leverage emerging capabilities as they mature, transforming how businesses understand and predict temporal patterns in their data.
Conclusion
Statistical timeline models transform chronological data from simple sequences of events into sources of predictive intelligence. By applying mathematical techniques to timeline data, these models reveal hidden patterns, quantify relationships, and enable accurate forecasting across diverse applications.
The key to success lies in understanding data characteristics, selecting appropriate modeling techniques, and continuously refining models as new information becomes available. As computational power increases and new methods emerge, statistical timeline models will become even more powerful tools for extracting insights from temporal data.
Whether analyzing business metrics, scientific measurements, or operational data, statistical timeline models provide the analytical foundation for data-driven decision-making in our increasingly complex world.
Frequently asked questions
These questions come from data analysts, business professionals, and researchers implementing statistical timeline models in real-world scenarios. Each answer provides practical guidance based on common implementation challenges.
You need at least 2-3 complete seasonal cycles for seasonal data, typically 24-36 months of monthly observations.
For non-seasonal data, aim for 100-200 data points minimum. However, data quality matters more than quantity. Clean, consistent data from 18 months often produces better results than messy data spanning three years. If you're modeling daily business metrics, one year of data usually suffices for basic forecasting, while complex patterns like customer behavior might require several years to capture properly.
Start with exponential smoothing for business data with clear trends and seasonality - it's easier to interpret and explain to stakeholders.
ARIMA works well when you need to understand why predictions change or when dealing with complex non-seasonal patterns. Machine learning models (neural networks, random forests) excel with large datasets containing multiple variables, but they're harder to explain. For most business applications, begin with simpler models and only move to complex approaches if accuracy gains justify the additional complexity.
No. These models predict patterns, not unprecedented disruptions. They assume future patterns will resemble historical ones.
Statistical models excel at forecasting normal variations, seasonal fluctuations, and gradual trend changes. They cannot predict events like the 2008 financial crisis, COVID-19 impacts, or sudden regulatory changes. However, you can enhance models by incorporating external indicators (economic metrics, news sentiment, social media trends) that might signal unusual conditions. The key is using these models for baseline predictions while maintaining scenario planning for extraordinary events.
Overfitting models to historical data and ignoring business context when interpreting results.
Technical mistakes include using too many parameters relative to data size, failing to validate models on unseen data, and choosing complex algorithms without understanding their assumptions. Business mistakes involve treating model outputs as certainties rather than probabilities, ignoring external factors that models cannot capture, and failing to update models as business conditions change. Always combine statistical predictions with domain expertise and business judgment.
Monthly for business metrics, weekly for rapidly changing data, and immediately after major business changes.
The update frequency depends on your data's stability and business needs. E-commerce sales models might need weekly updates during peak seasons but monthly updates during stable periods. Manufacturing quality models could update daily or even hourly if processes change frequently. Set up automated monitoring to track model performance. When accuracy drops below acceptable thresholds, retrain immediately. Major business changes (new products, market expansion, organizational restructuring) always require model updates regardless of schedule.
