How to turn a messy task list into a structured Excel project plan
Transform a chaotic task list into a professional Excel project plan. Learn the essential columns, structure, and templates for effective project management.

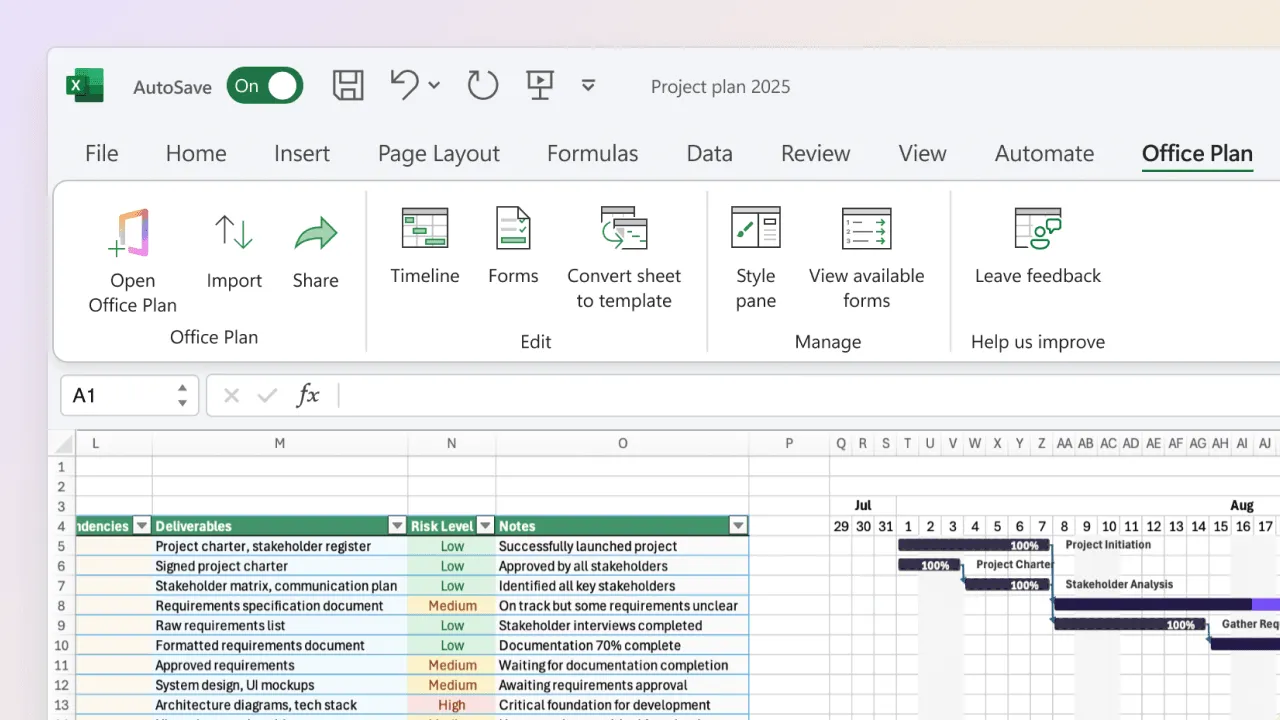
Before and after view of an Excel project plan — a messy unstructured task list on the left transformed into a structured project plan with dates, owners, status tracking, and conditional formatting on the right.
Quick answer
Convert a task list into a structured project plan by adding date columns, owner assignments, duration estimates, dependencies, and status tracking. A well-structured Excel project plan uses specific columns for Task Name, Start Date, End Date, Duration, Owner, % Complete, and Risk/Status flags.
Introduction
You've seen this pattern a hundred times: a team starts with a simple list in Slack, Google Docs, or someone's email inbox. "Build the dashboard," "finalize copy," "test on mobile." Tasks pile up, and suddenly nobody knows which tasks are due today, who owns what, or if the whole thing is even on track.
When it's time to create an actual project plan, many PMs copy these loose task lists directly into Excel and hope for the best. But a task list isn't a project plan—it's the raw material for one. A true project plan has structure: dates are tied to dependencies, ownership is clear, progress is trackable, and you can see at a glance what's at risk.
The gap between a messy task list and a functional project plan is organizational discipline. The good news: it's straightforward to implement. In this guide, we'll walk through how to take that chaotic list and structure it into a proper Excel project plan that works—and that you can actually maintain.
Why task lists fail as project plans
Before we build a plan, let's acknowledge why loose task lists break down:
No timeline visibility. Without clear dates, you don't know when anything happens. "Do the testing" is useless until it's anchored to a date. Without dates, there's no sense of urgency, no way to sequence work, and no baseline for tracking progress.
Unclear ownership. If five people could theoretically own a task, nobody owns it. Ambiguous ownership leads to duplicated effort, dropped balls, and confusion about who to ask for updates.
No duration estimates. Without estimated effort, you can't calculate when tasks finish or spot overallocation. You're flying blind on resource planning.
No status tracking mechanism. A task list tells you what exists, not what's happening. You need a way to track progress (0%, 50%, 100%) and flag risks so nothing surprises you.
No dependency awareness. "Task B can't start until Task A finishes" is a dependency. Task lists don't show these relationships. You end up with tasks starting in the wrong order, or teams waiting for invisible blockers.
No aggregation or roll-up. You can't see phase-level progress or high-level timeline at a glance. Everything is flat and equally important.
A project plan fixes all of these by introducing structure and intentional columns.
The anatomy of a proper Excel project plan
A functional Excel project plan has core columns that work together. Here's the minimum viable structure:
| Column | Purpose | Example |
| Task ID | Unique identifier for tracking and references | T001, T002 |
| Task Name | Clear, concise description | "Design mockups for dashboard" |
| Phase/Category | Groups related tasks (optional but helpful) | "Design," "Development," "Testing" |
| Owner | Person responsible for completing the task | "Sarah Chen" |
| Start Date | When the task should begin | 3/1/2025 |
| Duration (days) | How long the task takes | 5 |
| End Date (formula) | Calculated from start date + duration | =B2+C2 |
| Dependencies | What tasks must finish first | "T001, T003" |
| % Complete | Progress tracking | 0%, 50%, 100% |
| Status | Health indicator | On Track, At Risk, Blocked |
| Risk/Notes | Flags and comments | "Waiting on design approval" |
This structure gives you the full picture: what needs to happen, who's doing it, when it happens, and what the current state is.
Step-by-step: transforming a task list into a structured plan
Step 1: Audit your current task list
First, gather all the tasks currently floating around in emails, Slack, documents, or mental notes. Write them down in a single list—don't worry about order yet. Just get everything out of your head and into one place.
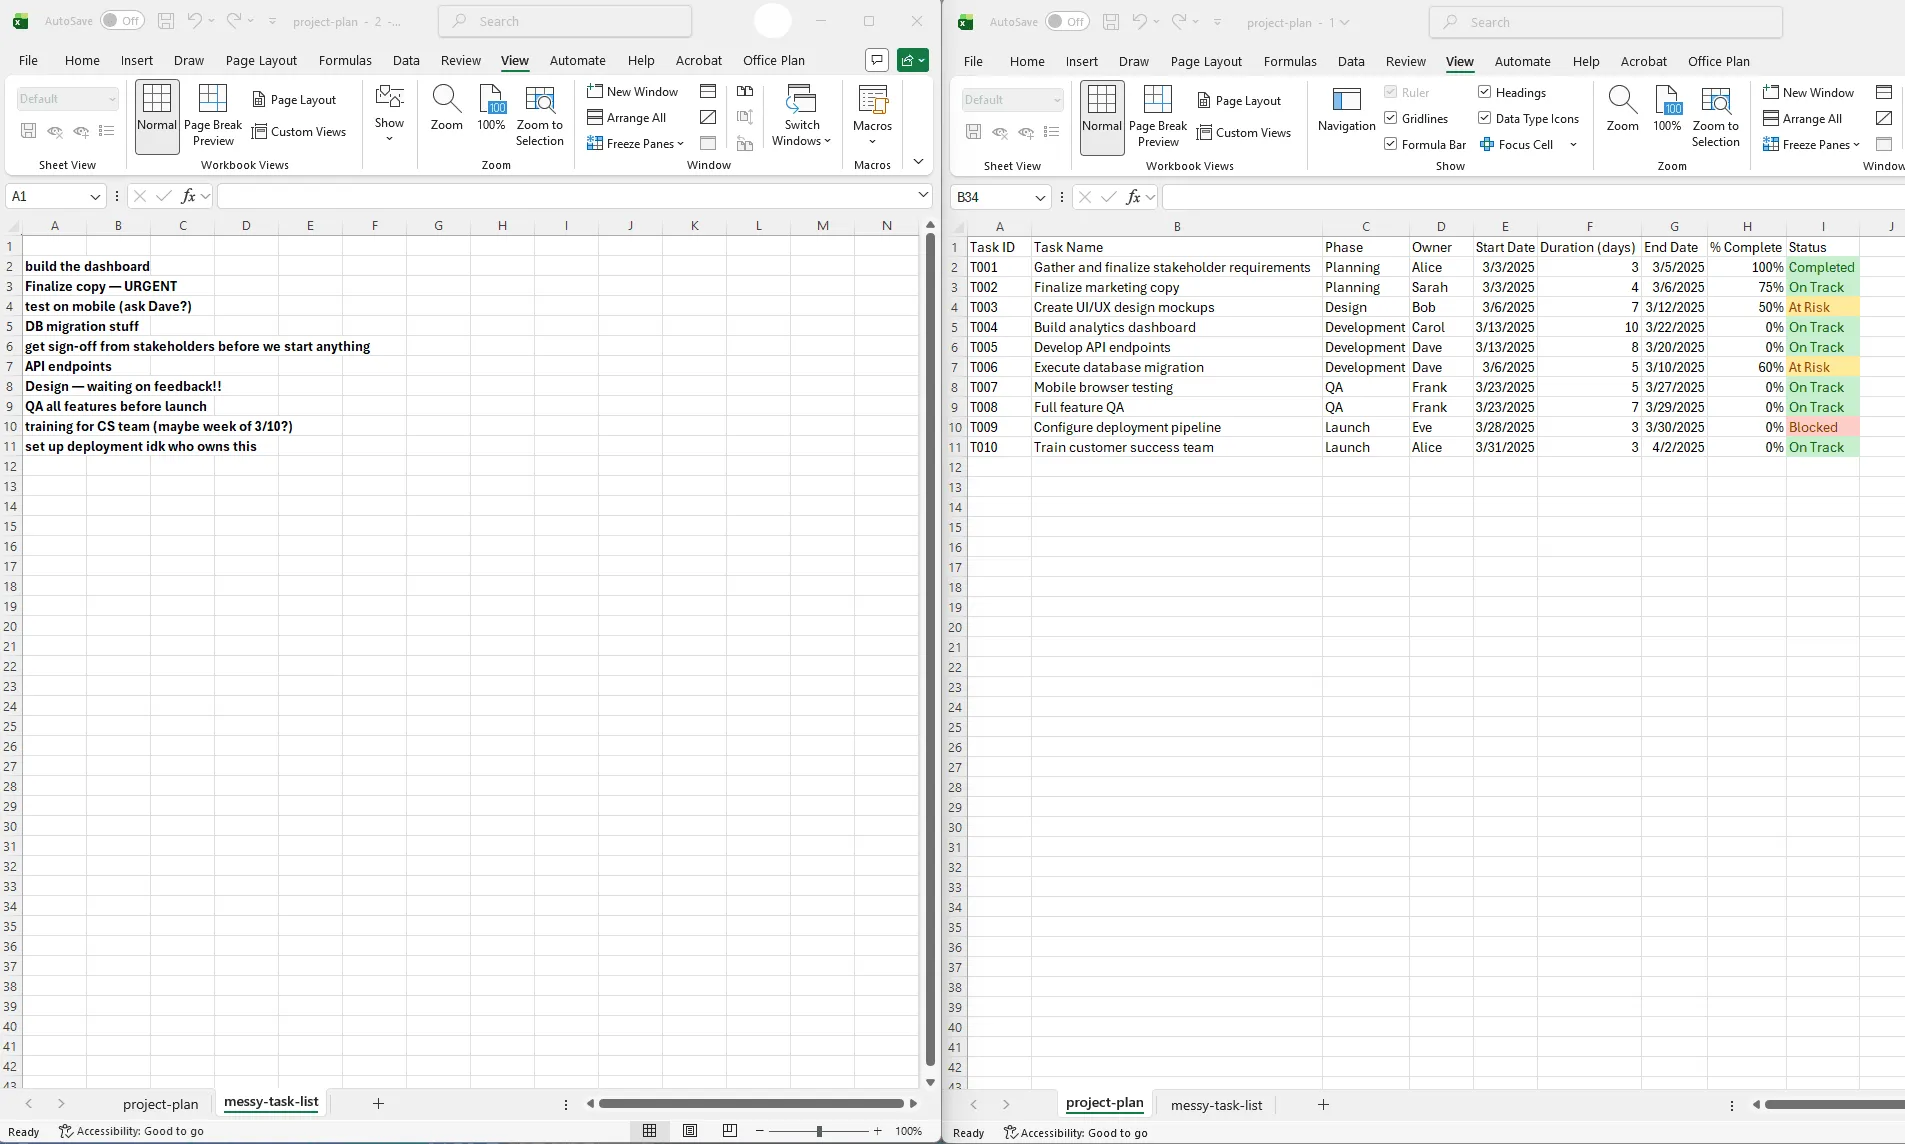
Example messy task list:
- Get stakeholder sign-off on requirements
- Build the database schema
- Design the UI
- Write API endpoints
- Test on mobile browsers
- Set up deployment
- Train customer success team
- QA all features
- Finalize documentation
Count your tasks. If you have more than 50 tasks, consider whether you're mixing projects—focus on one project at a time.
Step 2: Identify your project start date and sequence
Now establish a baseline: When does the project start, and what must happen first?
Review your tasks and order them logically:
- What tasks have no dependencies? These start first.
- What tasks depend on others finishing? These come after.
- What tasks can run in parallel? These have the same or overlapping start dates.
Rough grouping by phase:
- Requirements & Planning: Stakeholder sign-off, requirements finalization
- Design: UI mockups, database schema design
- Development: API endpoints, backend functionality
- QA & Testing: Mobile testing, feature QA
- Deployment & Launch: Deployment setup, training, documentation
This doesn't need to be perfect—it's a logical skeleton to hang your plan on.
Step 3: Build your Excel structure
Create a new spreadsheet with columns as described above. Use row 1 for headers. Format headers with a background color so they stand out.
| Task ID | Task Name | Phase | Owner | Start Date | Duration | End Date | Dependencies | % Complete | Status |
| T001 | Stakeholder sign-off | Planning | Alice | 3/1/2025 | 3 | 0% | On Track |
Freeze the header row (View > Freeze Panes) so it stays visible as you scroll down.
Step 4: Add your tasks and estimate durations
Enter each task in order. For each one, estimate how many days it will take. Be realistic—this is not the time to be optimistic. If you think something takes 2 days, estimate 3. Estimates that are too aggressive will haunt you throughout the project.
Example:
| Task ID | Task Name | Owner | Start Date | Duration | End Date |
| T001 | Stakeholder sign-off | Alice | 3/1/2025 | 3 | =B2+C2 |
| T002 | Database schema design | Bob | 3/4/2025 | 5 | =B3+C3 |
| T003 | UI mockups | Carol | 3/4/2025 | 7 | =B4+C4 |
Notice that T002 and T003 start on the same date (3/4)—they're parallel work, not sequential.
Step 5: Calculate end dates with a formula
In the End Date column, use this formula:
| =Start_Date_Cell + Duration_Cell |
For example, in the End Date cell for row 2:
| =B2+C2 |
Copy this formula down for all tasks. Excel automatically calculates when each task finishes based on its start date and duration.
Step 6: Add ownership and accountability
Make sure every task has a single owner. This is non-negotiable. "Shared ownership" means nobody is responsible. Assign it to the person who has the most control over completion.
If a task requires multiple people (e.g., "design review between product and engineering"), still assign it to one person who's driving the process.
Step 7: Add dependencies and notes
For tasks that depend on others, note which task IDs must finish first. This doesn't make the dependency automatic in Excel—you'll need to manually sequence start dates based on dependencies—but it documents the logic.
Example:
| Task ID | Task Name | Dependencies | Notes |
| T004 | API development | T002 | Depends on database schema |
| T005 | Integration testing | T004, T006 | Both API dev and frontend must be done |
Step 8: Add progress and status tracking
Create two columns: % Complete and Status.
- % Complete: Update this weekly as work progresses (0%, 25%, 50%, 75%, 100%)
- Status: A simple indicator (On Track, At Risk, Blocked, Completed)
Use conditional formatting (Home > Conditional Formatting) to color-code status:
- Green = On Track or Completed
- Yellow = At Risk
- Red = Blocked
This gives you instant visual feedback on project health without reading every row.
Adding owners, dates, and status tracking: a complete example
Here's a fuller example to tie it together:
| Project: Website Redesign Start Date: 3/1/2025 Expected End Date: 4/18/2025 | Task ID | Task Name | Phase | Owner | Start | Duration | End | Dependencies | % Complete | Status | Notes | |---------|-----------|-------|-------|-------|----------|-----|------------|-----------|--------|-------| | T001 | Content audit | Planning | Alice | 3/1 | 3 | 3/4 | — | 100% | Completed | Finished ahead | | T002 | Design concepts | Design | Bob | 3/4 | 7 | 3/11 | T001 | 50% | On Track | 3 concepts approved | | T003 | Development setup | Dev | Carol | 3/4 | 2 | 3/6 | — | 100% | Completed | Staging ready | | T004 | Frontend development | Dev | Dave | 3/11 | 14 | 3/25 | T002, T003 | 30% | At Risk | Designer feedback delayed start | | T005 | Backend APIs | Dev | Eve | 3/6 | 10 | 3/16 | T003 | 80% | On Track | On schedule | | T006 | Testing | QA | Frank | 3/26 | 7 | 4/2 | T004, T005 | 0% | On Track | Starts next week | | T007 | Launch | Launch | Alice | 4/3 | 5 | 4/8 | T006 | 0% | On Track | Deployment ready | |
Notice:
- Tasks are ordered logically (content audit before design concepts)
- Parallel work is visible (Development setup and Content audit start at the same time)
- Dependencies are noted (Frontend development can't start until design is done)
- Status shows at a glance where risks exist (T004 is at risk, probably needs intervention)
- Complete dates roll through based on start + duration
This is a project plan that actually tells a story about what's happening.
Template structure: building a reusable template
Once you've built one project plan correctly, save it as a template for future projects. Remove all task data but keep the column structure, formulas, and conditional formatting.
Your reusable template should include:
- Column headers with appropriate widths
- Frozen header row
- End Date formula pre-filled in the first data row
- Conditional formatting rules for status colors
- A summary section at the top showing: - Project name - Start date - Expected end date - Overall % complete (calculated from all tasks) - Count of at-risk tasks
You can even add a dashboard view at the top:
| Project: [Project Name] Start Date: [Date] | End Date: [Formula for MAX end date] | Days Remaining: [Formula] Status: [Overall status] On Track: [Count] | At Risk: [Count] | Blocked: [Count] | Completed: [Count] |
Use COUNTIF formulas to auto-calculate these summary stats from your task list below.
Turning the plan into a visual timeline
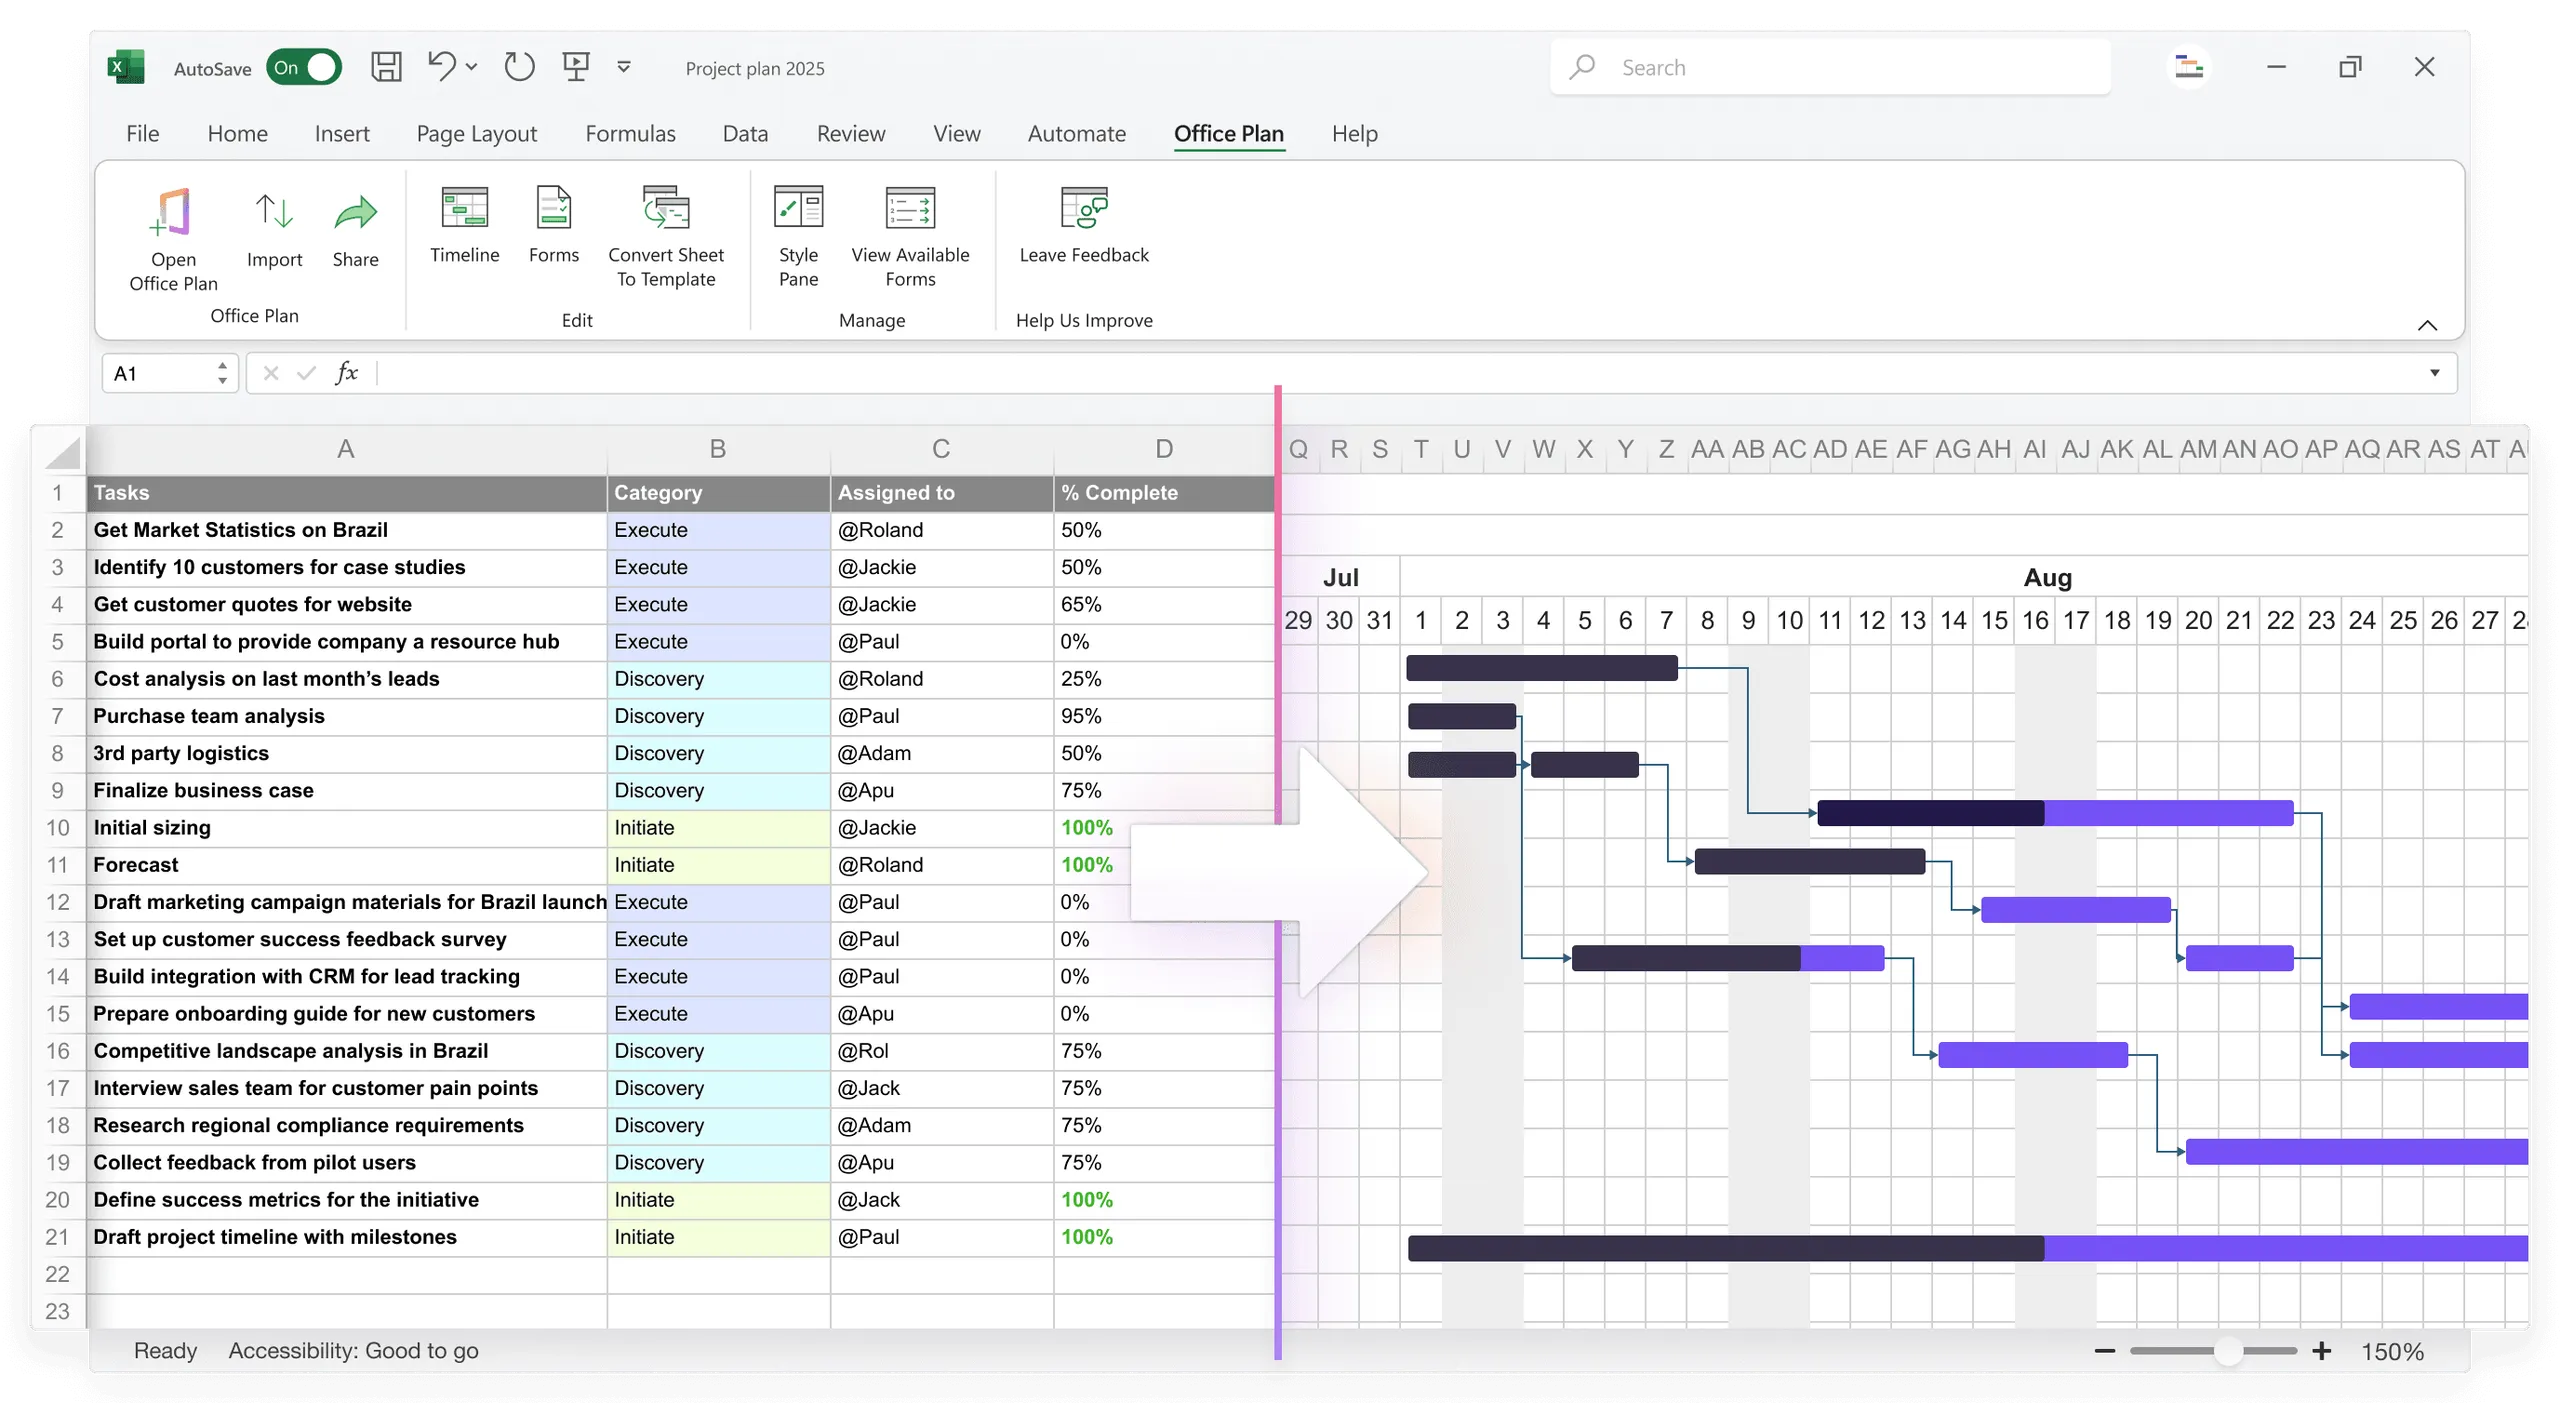
Once your Excel project plan is structured, the next logical step is visualizing it. Your spreadsheet is the source of truth, but your team and stakeholders need a visual — a Gantt chart or timeline that makes the data scannable at a glance.
You have a few options:
Option 1: Build an Excel Gantt chart manually from your plan using conditional formatting and stacked bars. Your structured data flows directly into the visual, but the formatting is tedious and breaks easily.
Option 2: Use an Excel add-in that generates the visual for you. Tools like Office Plan read your structured plan data and create a professional Gantt chart or timeline right inside Excel — no exporting, no app-switching, no manual formatting.
Option 3: Build a basic chart using Excel's built-in bar chart features. This works for simple plans but becomes unwieldy with dependencies and milestones.
The best approach depends on your needs. For small projects, a manual Excel Gantt works. For anything with dependencies, milestones, or stakeholder visibility, an add-in like Office Plan saves hours by turning your structured data into a polished visual automatically — all without leaving Excel.
Frequently asked questions
Assign a placeholder owner (like the project manager) and note that the owner needs to be confirmed. Don't leave tasks unassigned—that's how accountability disappears. Set a date to finalize assignments, then update the plan.
List all dependencies in the Dependencies column (e.g., "T003, T005, T008"). When calculating the start date for dependent tasks, you can't rely on a formula—you'll need to manually check which predecessor finishes latest and use that as your dependent task's start date.
Include tasks that are at least 1-2 days of effort. Tasks that take an hour or two clutter your plan and make it unreadable. Group small tasks into larger work items. You can have a separate detailed task list at the team level, but your project plan should focus on key deliverables and milestones.
Update it weekly at minimum. Set a standing meeting on Monday morning or Friday afternoon to review progress. Spend 15 minutes updating % complete and status. If you let it sit for weeks, it becomes useless and nobody trusts it.
Yes—add whatever columns help you manage your specific project. Just don't over-complicate it. Start with the core structure, then add columns if you genuinely need them. Too many columns make the spreadsheet hard to navigate and update.
Use the formula =AVERAGE(range of % complete cells). This gives you a rough overall completion percentage. A more sophisticated approach: weight each task by duration (e.g., a 2-day task counts half as much as a 4-day task). Use SUMPRODUCT: =SUMPRODUCT(% complete, duration) / SUM(duration).
Key akeaways
- Transform a task list into a project plan by adding structure: dates, owners, durations, and status tracking
- A structured plan requires Task Name, Phase, Owner, Start Date, Duration, End Date, Dependencies, % Complete, and Status
- One owner per task ensures accountability; shared ownership means nobody owns it
- Duration estimates should be realistic and slightly padded to account for unknowns
- Conditional formatting for status provides instant visual health checks
- pdate your plan weekly to keep it relevant and trusted
- Your structured plan is the foundation for visual outputs — tools like Office Plan turn it into Gantt charts and timelines directly inside Excel
Project management tips and tricks
Take the formatting work off your plate
Once you've structured your Excel project plan with all the right columns and tracking, the heavy lifting isn't over — you still need to turn it into a visual your stakeholders can understand. Manually formatting Gantt bars, adjusting timelines, and redoing the layout every time your data changes is tedious and error-prone. Office Plan eliminates that step. It's an Excel add-in that reads your structured project data and automatically generates professional Gantt charts, timelines, and roadmaps — right inside your spreadsheet. Update your data, and your visuals update instantly. No exporting to PowerPoint. No static images. No formatting nightmares. Your project plan and your visuals live in the same place — Excel, where your data already is.