Microsoft Project alternative for visuals
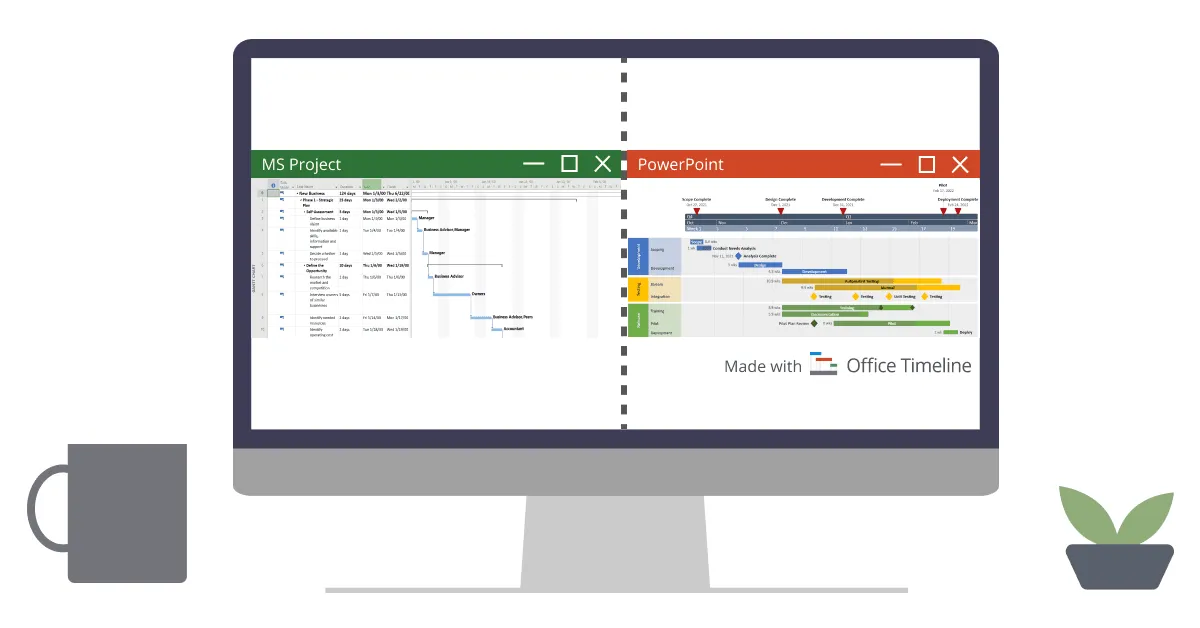
Microsoft Project, the popular project management tool, is not strong at generating high-level project visuals. See how it compares with Office Timeline.

Successful project managers aim to get the optimum balance between the key components of the projects they manage: Resources, Time, Cost, and Quality. For this, they need to schedule, assign resources, manage budgets, track progress, analyze workloads and project data, and make sure that the quality corresponds to the project requirements.
Add to these the communication and presentation skills that good project managers need to own in order to make their work known to teams and clients, and to ensure proper project quality.
But, even when all these key components are in perfect balance, a project would be at risk without good communication and presentation capabilities.
How do you present a project to “wow” your audience?
This can be a challenge, and we all know that project success hugely depends on its presentation. If you do it right, you’ll grab the attention of stakeholders, executives, and clients, and get them to an agreement. Plus, you’ll have the perfect opportunity to communicate essential data to your team members and ensure a seamless workflow.
Here are the top 3 reasons why it’s important to use visuals in your project presentations:
1. Communicate efficiently
Use visuals to say more in less time. Which is faster? Reading a hundred words or looking at an image? Presentations are time limited. With the right visuals you can squeeze in more information, explain arguments faster and talk about more things, all in one strike!
2. Make your presentation memorable
Visuals help your audience remember the presentation and think about the information you present. Images, graphics, timelines, Gantt charts and other visual aids will help keep your audience engaged and create a strong link between ideas, facts, numbers and their visual representation.
3. Make your presentation dynamic
Great visuals help make a presentation more dynamic and convey its content better. Telling a story with colors and shapes captivates the audience. People often feel that time flies and are more participative. Bye-bye boredom!
Which tool is better for project presentations?
Which tool is better for project presentations: an all-in-one project management tool or a specially designed tool for presentations? Will MS Project do for presentations as well or you'll need a specialized presentation tool like Office Timeline? The answer to this question depends on the quality level that you and your audience expect from your presentation. The more at stake, the higher you’ll need your presentation to score.
Microsoft Project is one of the most popular software products for project management because it answers most of the requirements that a project manager needs to meet. It can be used to plan projects, track progress, tasks and activities, find the critical path, and also get a cash flow projection by assigning resources and costs to tasks. So, MS Project is more on the technical side of things, and it could work rather well for team communication.
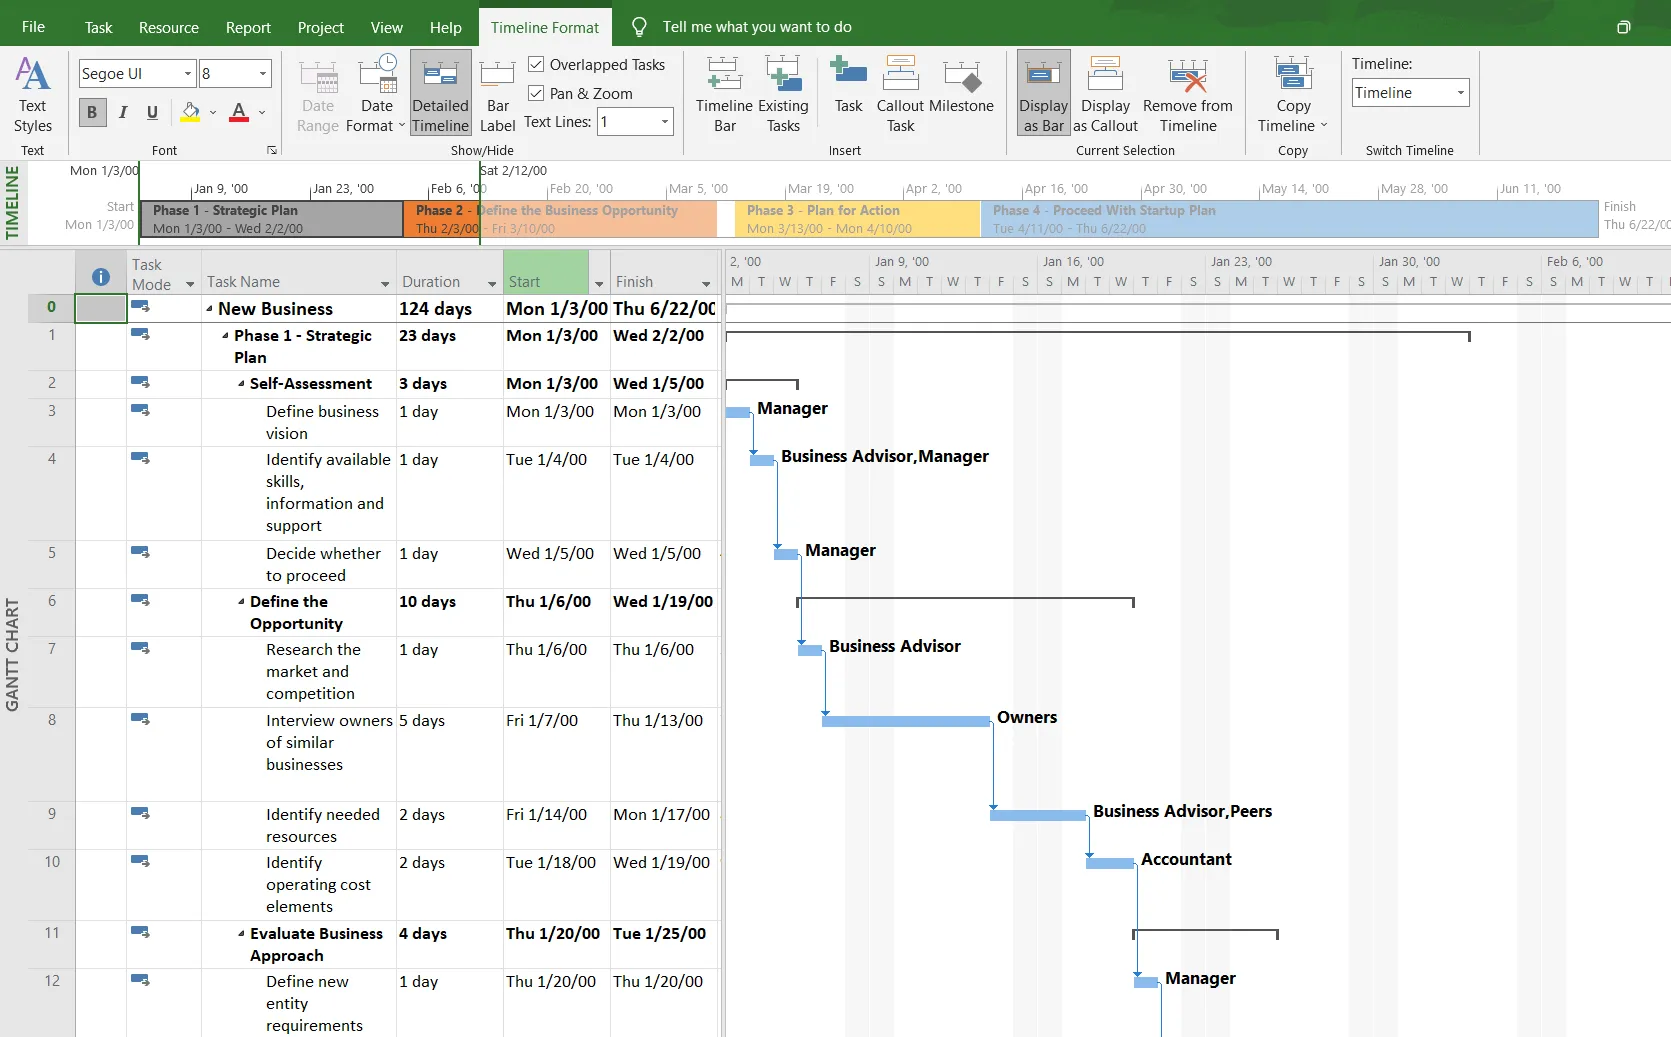
Beyond the great features as a project management tool, generating high-level project visuals is not MS Project’s strong feature. Even the basic visuals that you would need for a presentation, such as Gantt charts or timelines, are intricate and difficult to follow in MS Project. The charts and diagrams in MS Project-based presentations can be confusing and the audience might often have difficulties in getting the big picture, and they are not well suited for a meeting with the project stakeholders.
An executive level presentation should be concise and summarize all main process phases and the planning process and show its progress in a clear and visually appealing way.
Thus, if you are looking for a solution to take your visuals to the next level and make them look professional, fit for executive presentations, there are some great alternatives out there. You can start with PowerPoint, which aces this type of presentations, and get more with the lightweight add-in from Office Timeline, that can be a game changer for your project presentation.
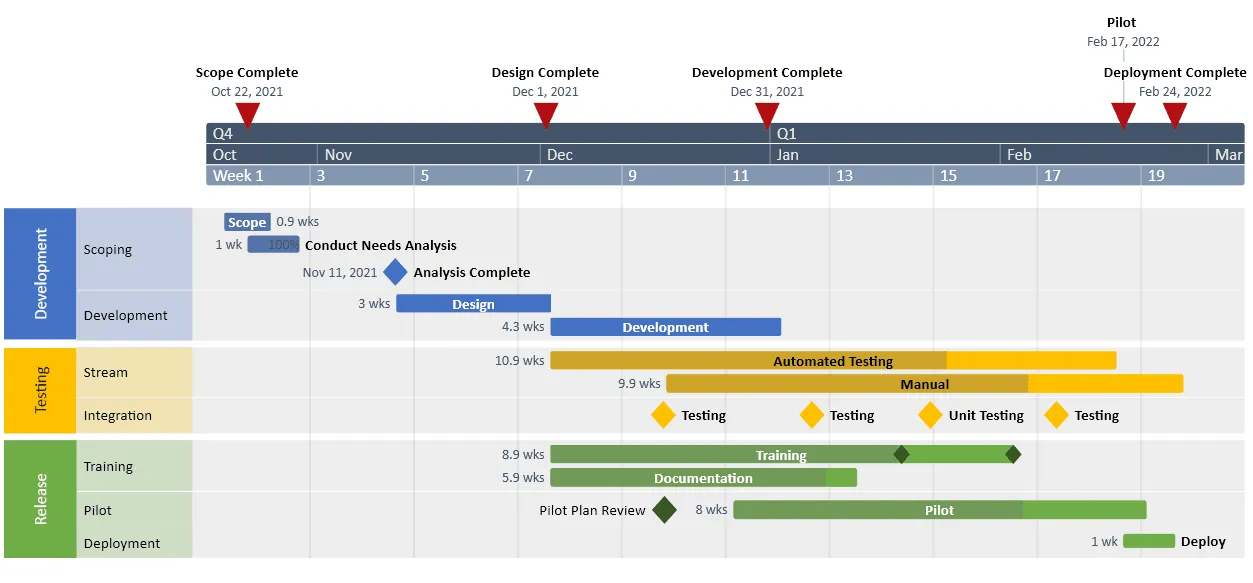
The workflow diagrams created with Office Timeline are crisp and easy to follow, helping the presenter segment the information in a clear way and the audience see in one view all the key components of the critical path of a project, such as tasks scheduling, duration, and tasks dependencies.
Also, with Office Timeline you get the best of both: timelines and Gantt charts. You can include a timescale in your chart on which you can show milestones, but you can also use the timeline to give a time frame for the tasks in the Gantt Chart.
Comparison: Office Timeline vs. MS Project visuals
See how Office Timeline add-in compares with Microsoft Project when it comes to visuals:
| Feature | Office Timeline | MS Project |
|---|---|---|
| Add more than 10 items per timeline Add as many tasks and milestones as you need to create detailed, easy-to-understand timelines. | Yes | Yes |
| Create Swimlanes Show multiple projects on a slide with Swimlanes. | Yes | – |
| Add Sub-Swimlanes inside Swimlanes Show programs with multiple projects or work streams inside a Swimlane. | Yes | – |
| Show multiple timeline scales Simultaneously present up to 3 timescales on your timeline for better calendaring. | Yes | – |
| Add milestones inside Swimlanes Place milestones inside Swimlanes for added accuracy. | Yes | – |
| Timeline and Gantt templates Get a fast start with professional-looking timeline and Gantt templates. | Yes | – |
| Swimlane templates Save time and stand out with impressive Swimlane templates. | Yes | – |
| Sub-Swimlane templates Use professionally designed Sub-Swimlane templates to make a beautiful program roadmap quickly. | Yes | – |
| Create custom templates Create your own templates to use for future work and save time. | Yes | – |
| Timelines in hours & minutes Show timelines scaled down to hours or minutes. | Yes | – |
Conclusion
Project managers will agree on the fact that visualization is critical to data analysis. It is only by visual means that data intricacies can be illustrated, issues revealed, items, tasks and teams organized in an easily readable format within time frames. Thus, all parties have a clear image of what is going on in the project and can take the steps to prepare the front line of attack.
When it comes to insightful data visualization and project presentation features, you might find Office Timeline a better solution, simplifying complex sets of data, transposing them into crisp and clear visuals, which are not only easy to understand, but also fast and easy and to make.
This handy timeline and Gantt chart creator is available as a free version. It can save you a lot of time when prepping for a presentation and help you make your point clearly. For more complex visuals showcasing projects in multi-level time bands and a rich collection of stylish templates, you can also try out for free for 14 days the most advanced edition of Office Timeline.
FAQ about MS Project presentations
Here are our solutions and answers to some of the most frequently asked questions about Microsoft Project visuals.
For timelines – follow these steps:
1. First of all, you’ll need to access the Timeline View by checking the Timeline option in the View tab, Split View section.
2. Then, right click anywhere in the timeline and select Copy Timeline > For Presentation from the shortcut menu.
3. Paste into a PowerPoint slide.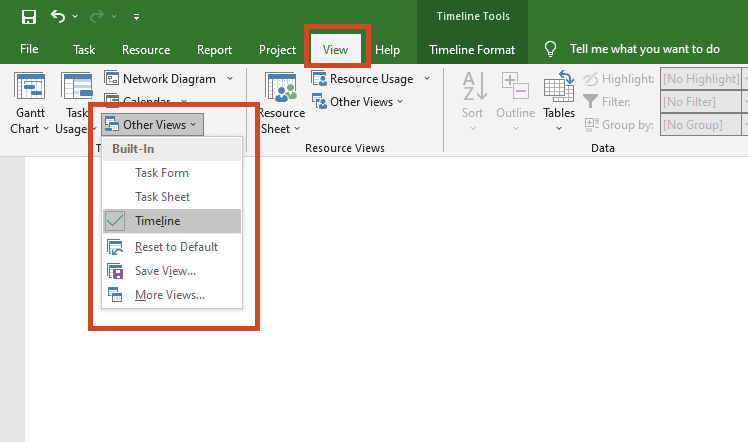
For Gantt charts – there are more steps:
1. The Gantt Chart view is the default vies in MS Project. However, if the view is changed, you can go to the View tab and select the Gantt Chart option.
2. First, set up the Gantt chart view as needed, that is, the way that you want to show it in your presentation.
3. Click the drop-down to the right of the Copy command on the Task tab.
4. Select To GIF image file and specify the file name and location.
5. Insert the picture into your PowerPoint slide.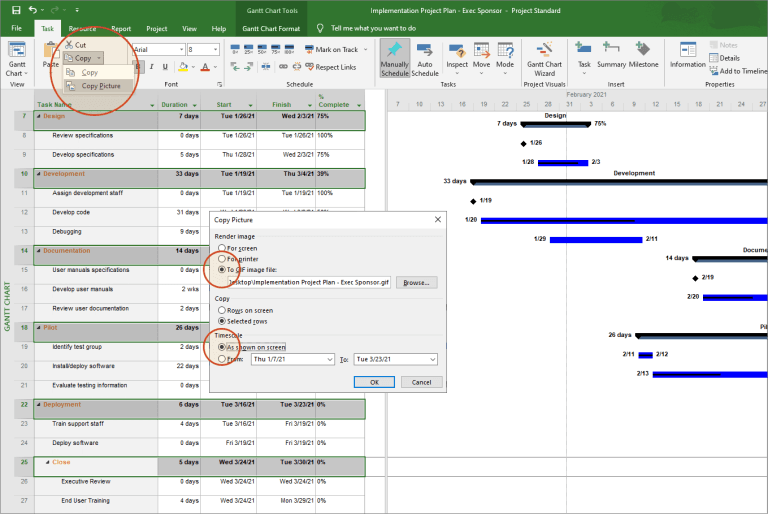
When you print or print preview a Gantt Chart view, it could be a bit difficult to fit Gantt Charts on one page. Most of the time, task bars or columns show on more pages than you need them to be. You have several possibilities to fix this:
1. Manually adjust the timescale.
– In File > Print > Page Setup go to View.
– Uncheck the Fit timescale to end of page box, then click OK.
– If you do not get the result you want, continue to the next step.
– Go back to the Project plan and go to the View > Zoom > Timescale.
– In the Timescale drop-down list, select the last option, Timescale.
– In the Size box, reduce the percentage to reduce (or increase) the width of the timescale to modify the width of the timescale as needed.
2. Fit timescale to end of page
– In File > Print > Page Setup go to View.
– Check the Fit timescale to end of page box, then click OK.
3. Scale the entire project Go to File > Print > Page Setup.
– Click the Page tab.
– In Scaling, choose the scaling option you need.
– Print your project.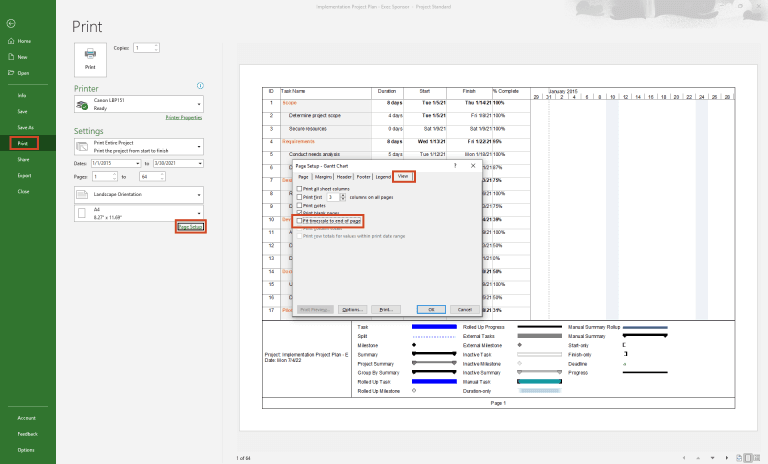
Follow these steps to create a project in MS Project:
– Open a new MS Project file.
– Select a template or search for one using the Search for online templates box. Or select Blank Project to start with a new project from scratch.
– Insert your own data in the table on the left side (replacing the data that is already there, in case you start with a template).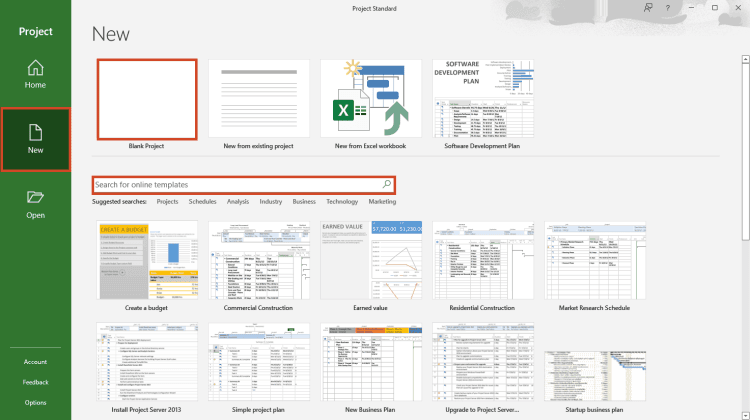
To add tasks to a project:
– Go to the View tab, in the Task Views section on the left, and select Gantt Chart.
– Go to the first empty Task Name field and type a task name and press Enter.
– Repeat step 2 as many times as needed.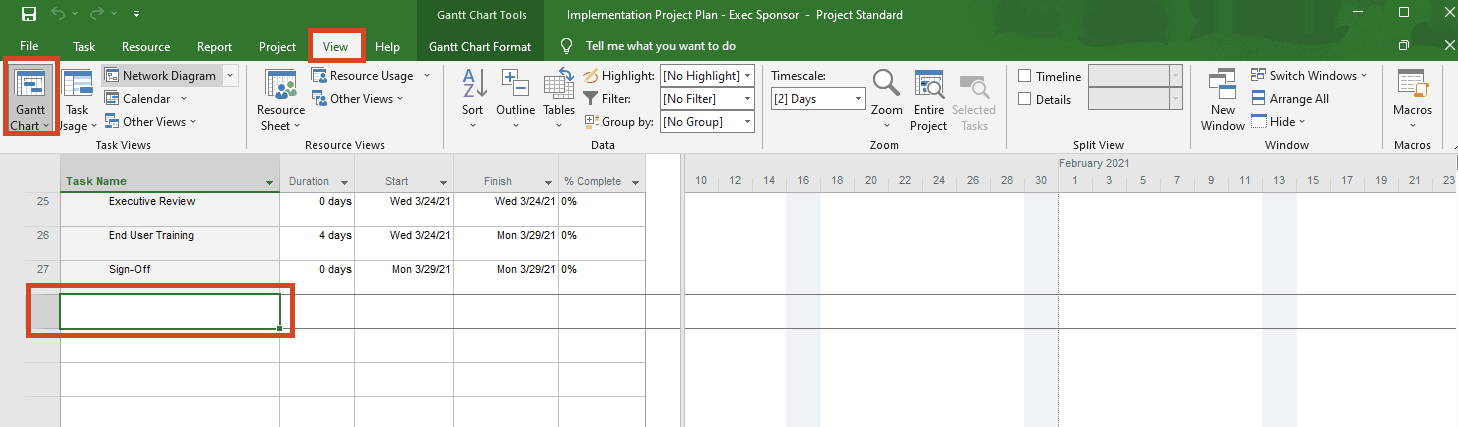
Project management tips and tricks
Turn project data into professional timelines
Get the advanced features of Office Timeline free for 14 days.
