Excel Gantt chart vs. task tracker: which one should you use?
Understand the difference between Gantt charts and task trackers. Learn when to use each tool for project management and how to combine them effectively.

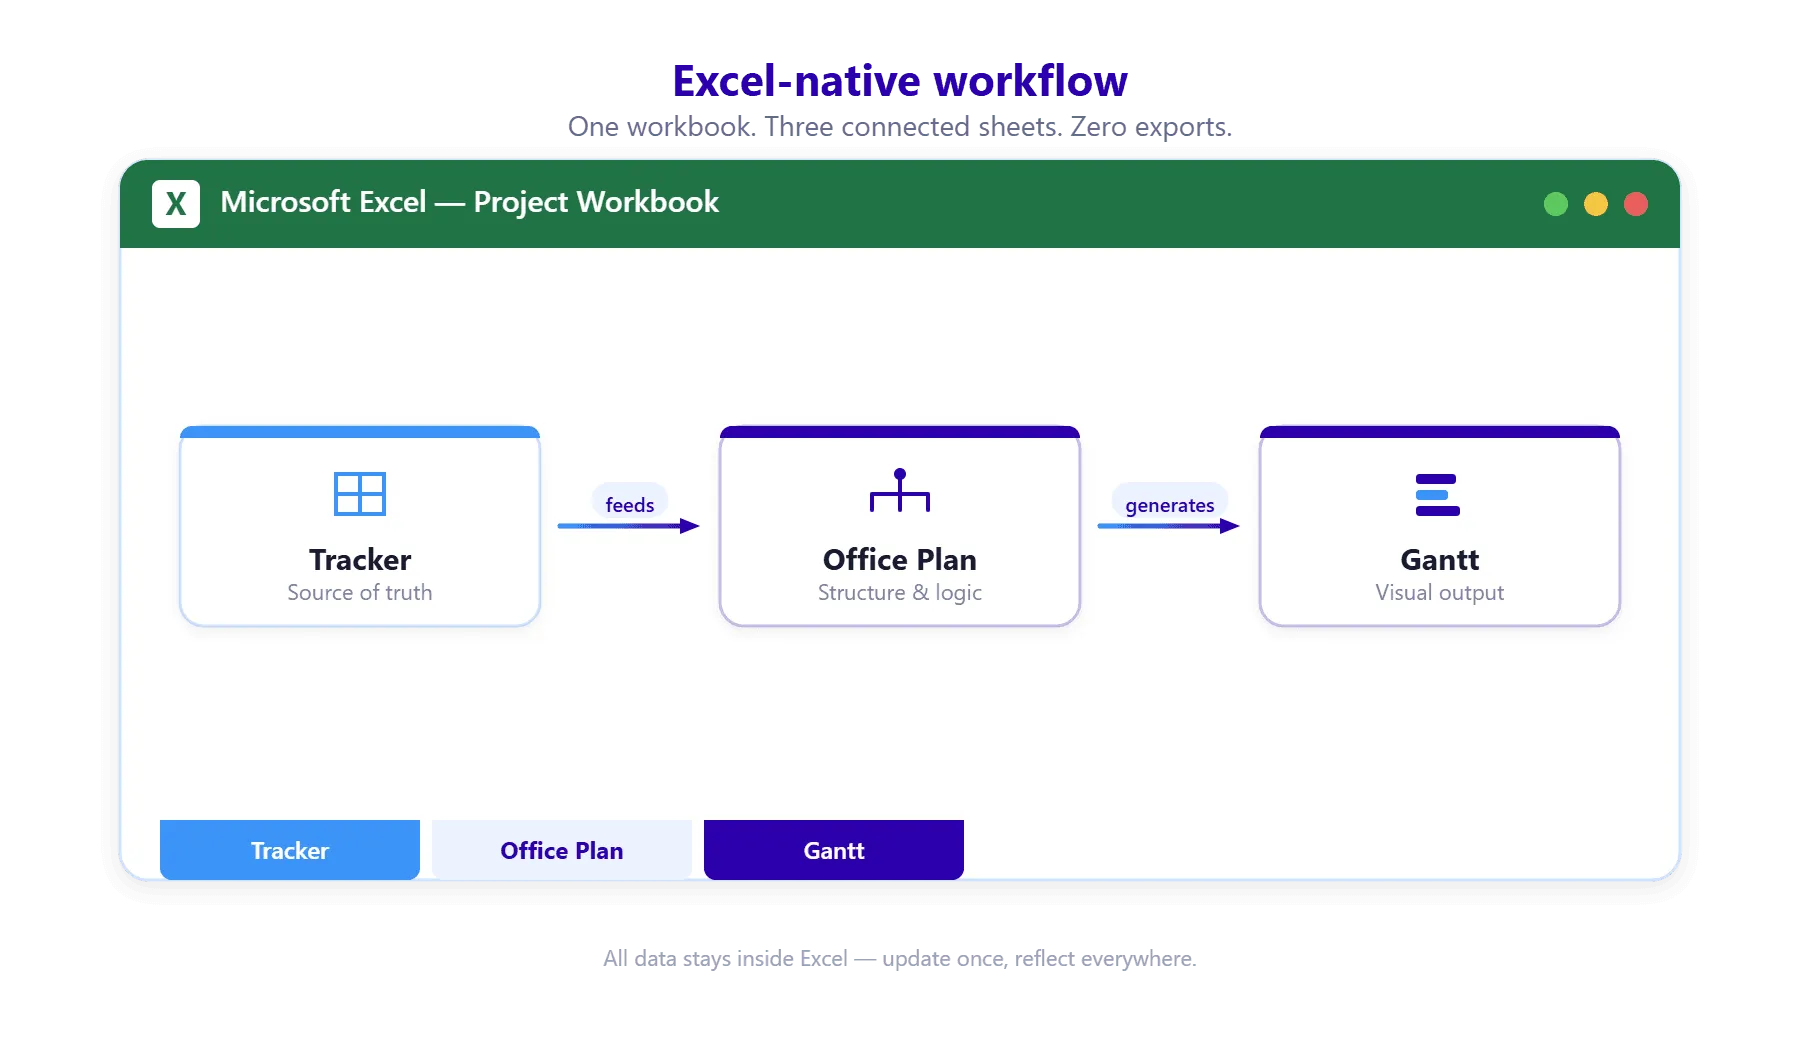
Simple diagram showing the flow: Tracker (source of truth) → Office Plan → Gantt (visual output)
Quick answer
A Gantt chart shows timeline and sequence (when tasks happen, dependencies, critical path). A task tracker shows status and progress (what's done now, what's blocked, what's at risk). They answer different questions. Use Gantt for timeline management and stakeholder communication. Use a tracker for team operational status. Most projects benefit from both.
Introduction
You're building your project plan. You have two primary tools available: a Gantt chart and a task tracker. Both are in Excel. Both will show tasks and dates. So which one do you use?
This is the wrong question. The right question is: "What information do I need to manage this project?"
A Gantt chart and a task tracker aren't competitors—they're complementary tools. A Gantt chart answers "when?" A task tracker answers "now what?" Using the right tool for the right question prevents confusion and wasted effort.
In this guide, we'll compare the two directly, explain when to use each, and show how to use both together.
Defining each tool (task tracker vs. Gantt Chart)
Let's be precise about what each tool does.
Task tracker
A task tracker shows the current status of work. It answers: "What are we doing right now? What's done? What's blocked?"
Structure: One row per task, columns for Status, % Complete, Owner, Due Date, Blocker.
Updated: Daily or weekly (as work progresses)
Purpose: Keep team aligned on what's happening now, surface blockers, prevent surprises
Audience: Team, team lead, PM (operational)
Example:
| Task | Owner | Due | Status | % | Blocker |
| Mockup iteration | Alice | 3/15 | In Progress | 75% | Waiting on feedback |
| API endpoint | Bob | 3/18 | Pending | 0% | Blocked (mockup not done) |
| Testing plan | Carol | 3/20 | On Track | 50% | No |
Gantt chart
A Gantt chart shows the timeline and sequence of work. It answers: "When is everything happening? What's blocking what? What's the critical path?"
Structure: One row per task, timeline axis showing start and end dates, bars showing duration, visual dependencies.
Updated: Weekly or monthly (as the schedule changes)
Purpose: Manage timeline, identify dependencies, communicate schedule to stakeholders
Audience: Stakeholders, executives, PM (strategic)
Example:
| Mockup phase [========] Jan 15 - Feb 15 Testing phase [==========] Feb 16 - Mar 15 Deployment [====] Mar 16 - Mar 25 Dependencies: Testing can't start until Mockup is done Critical path: Mockup → Testing → Deployment (determines overall timeline) |
Side-by-side comparison table
| Aspect | Task Tracker | Gantt Chart |
| Purpose | Show current status | Show timeline and sequence |
| Focus | "What's happening now?" | "When is everything happening?" |
| Updated | Weekly or daily | Monthly or as schedule changes |
| Structure | Task rows, Status/Progress columns | Task rows, Timeline columns |
| Complexity | Simple, 7-10 columns | Complex, can be hard to read |
| Dependencies | Shown in Notes | Shown visually (arrows, blocking) |
| Best for | Team operational work | Stakeholder communication |
| Audience | Team, PM | Executives, stakeholders |
| Key Data | Status, % complete, blocker | Start date, end date, duration |
| Lifespan | Changes weekly | Relatively stable |
| Visual Appeal | Basic but clear | Polished, professional |
| Maintenance | Low friction (5 min/week) | Medium friction (formatting, updates) |
When to use a task tracker
Use a task tracker when:
You need current status (what's happening this week, not three months from now)
A tracker shows what's in progress, what's blocked, what's overdue—right now. Gantt charts are designed for timeline visibility, not current status.
Your team needs alignment on what to do next
A tracker is a shared source of truth about current work. It prevents the "I thought someone else was doing that" problem.
Tasks change frequently (you're adapting to circumstances)
If your plan is stable, a Gantt is good. If you're adding/removing/re-prioritizing tasks weekly, a tracker handles this better (less visual adjustment, just update the list).
You have 10-30 tasks at the task level
A tracker works well for this range. Below 10 tasks, you don't need a tracker (just manage in your head or a simple list). Above 30 tasks, you need summary views and filtering, which Gantt charts do better.
Your primary risk is "something is blocked" rather than "timeline is at risk"
A tracker surfaces blockers and dependencies clearly. If a task is waiting on someone else, that's visible immediately.
Example: A development team mid-project, managing week-to-week work, coordinating sprints, surfacing blockers in daily standups.
When to use a Gantt chart
Use a Gantt chart when:
You need timeline visibility (when are all the phases happening, when do we finish?)
A Gantt shows the shape of your project over time. It answers: "When does design finish? When does development start? When do we launch?"
Dependencies matter (task B can't start until task A finishes)
A Gantt visualizes dependencies. You can see which tasks are blocking which, and understand the critical path (the sequence that determines your finish date).
You're communicating to stakeholders (board, executives, customers)
Gantt charts are the industry standard for executive communication. They're professional, visual, and communicate schedule clearly.
Your project is large (30+ tasks) and you need to see the whole timeline at once
A tracker with 50 rows is hard to navigate. A Gantt with 50 tasks is still manageable if you can filter or group.
Your primary risk is "timeline is at risk" rather than "something is blocked"
If the issue is "we're behind schedule" or "we might miss the launch date," a Gantt shows that immediately. If the issue is "Bob is blocked waiting on marketing," a tracker is better.
You have multiple phases or workstreams that run in parallel
A Gantt visualizes parallel work. A tracker doesn't—it's just a list of tasks.
Example: An executive reporting to the board on a major project, or a PMO managing a portfolio of projects across multiple teams.
When you need both
Most non-trivial projects benefit from both:
Gantt for strategic timeline management:
- Shows overall schedule
- Visualizes dependencies
- Identifies critical path
- Communicates to stakeholders
Tracker for operational status management:
- Shows what's happening now
- Surfaces blockers
- Tracks % complete
- Prevents surprises
How they work together:
Your Gantt is built from your project plan (Excel or dedicated tool). It's updated monthly as the schedule changes. It's shown in board meetings and stakeholder updates.
Your tracker is built from the same source (the tasks in your Gantt), but it's focused on now. It's updated weekly or daily as work progresses. It's used in team standups and operational sync meetings.
When a tracker item changes status (a task finishes early or slips), that change eventually flows to the Gantt (but not immediately—the Gantt is updated less frequently).
Example workflow:
- Monday standup: Team reviews the tracker. Alice says her task will finish by Wednesday (ahead of schedule). Bob says his task is blocked waiting on Alice.
- Tuesday: Alice finishes her task, updates the tracker. The blocker on Bob's task is removed.
- Wednesday: Bob starts his task, updates the tracker to "In Progress."
- Friday: PM reviews tracker progress across the week. Several tasks are ahead of schedule. PM updates the Gantt to reflect new end dates. The Gantt now shows launch moving up by 3 days.
- Next week: Updated Gantt is shared with stakeholders.
Decision framework: choosing the right tool for your project
Ask these questions:
Question 1: What's your primary management problem?
- "We don't know what's happening right now" → Tracker
- "We're not sure when we'll finish" → Gantt
- Both → Use both
Question 2: How stable is your plan?
- "Plan changes weekly; we're adapting to circumstances" → Tracker
- "Plan is stable; we're tracking execution" → Gantt
- Both change → Use both
Question 3: How many concurrent tasks?
- 5-15 tasks → Tracker
- 20-50 tasks → Gantt (with summary views)
- 50+ tasks → Gantt + Tracker (Gantt for overview, Tracker filtered by team/phase)
Question 4: Who's your primary audience?
- Team leads, team members → Tracker
- Executives, stakeholders → Gantt
- Both → Use both
Question 5: What do you track daily?
- Status updates, blockers, % complete → Tracker
- Schedule changes, deadline adjustments → Gantt
- Both → Use both
If you answered "both" to most questions, you need both tools. If you answered one tool consistently, that's your primary tool (though the other can be supplementary).
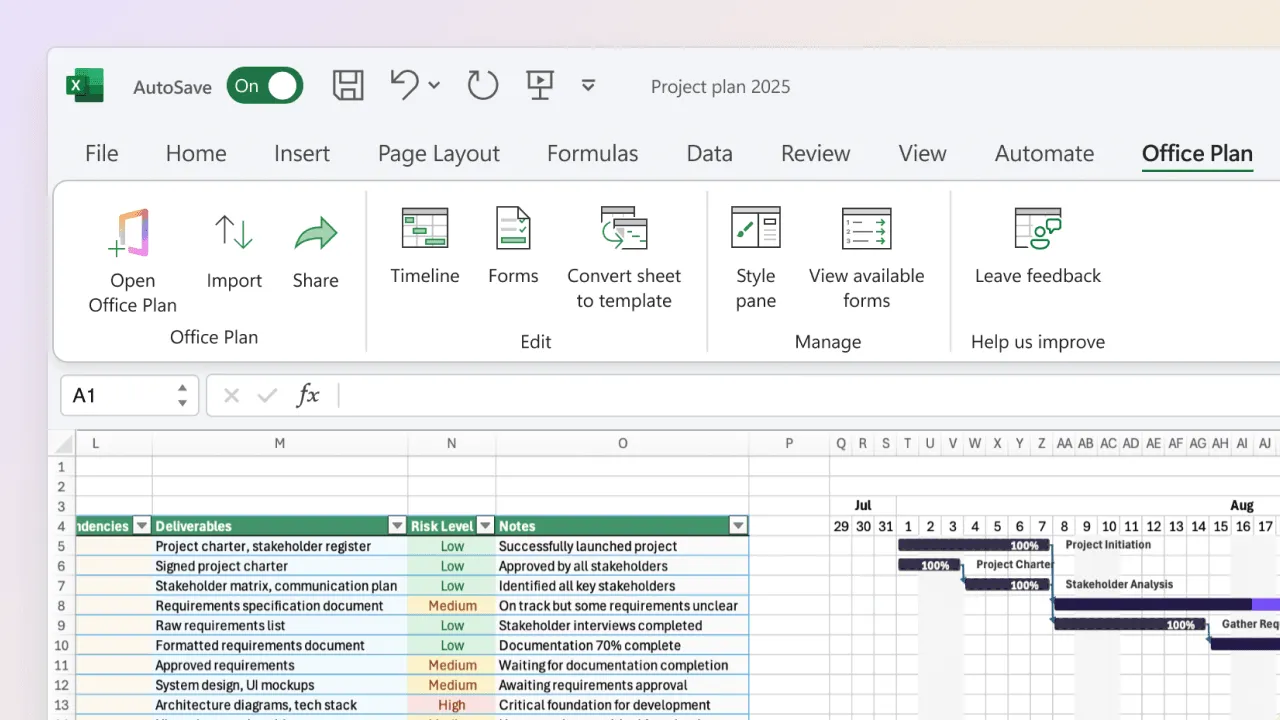
How Office Plan bridges Gantt and tracker
If you maintain both a tracker and a Gantt, you're maintaining two tools with overlapping data. Changes to one should flow to the other, but Excel doesn't auto-sync them.
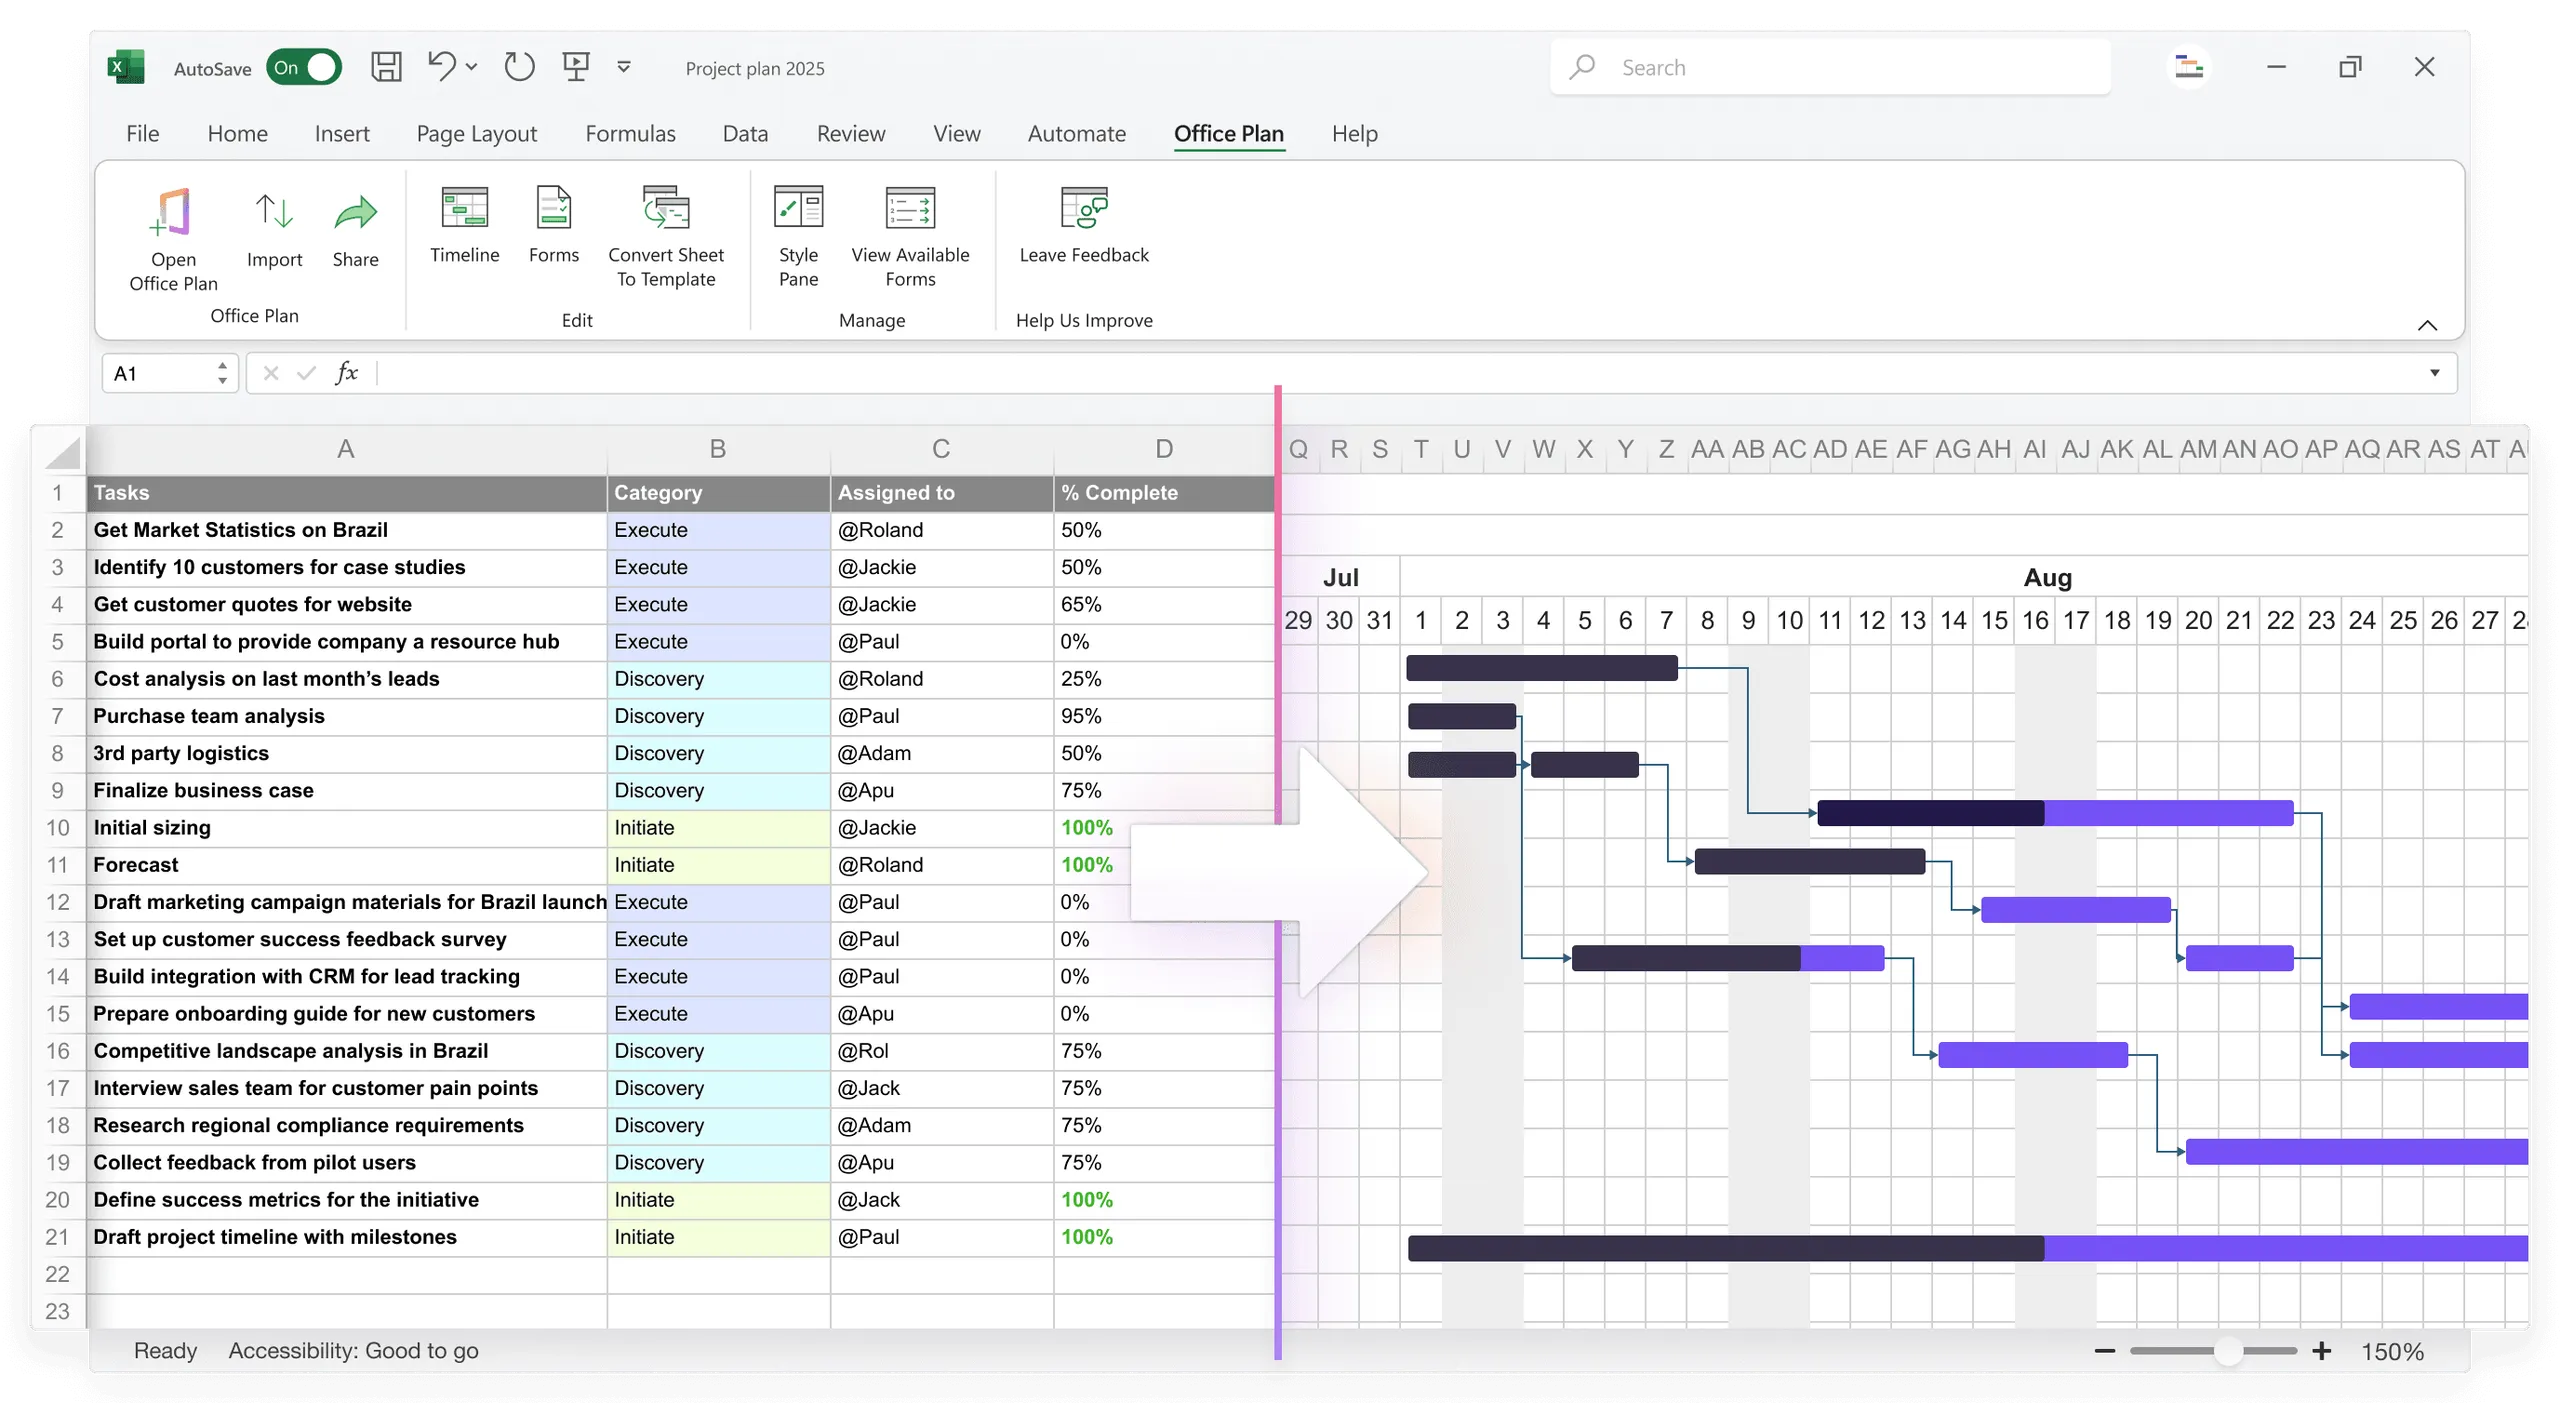
This is where Office Plan is useful. Office Plan is an Excel add-in that turns your tracker data (task, owner, due date, % complete, status) into a professional Gantt chart — right inside Excel. Your tracker is the source of truth. The Gantt is a native visual layer built on top of it.
So you maintain one tool (the tracker), and the Gantt updates automatically — all without leaving Excel. Best of both worlds.
Frequently asked questions
For very small projects (5-10 tasks, 2-3 weeks), a simple list might suffice. For anything larger or longer, you eventually need both. Gantt for timeline, Tracker for status. Trying to do both in one tool creates a messy, hard-to-maintain spreadsheet.
You can try, but it rarely works well. Gantt charts are wide (many time columns) and are hard to update frequently. Trackers are narrow (7-10 columns) and easy to update. Mixing both into one sheet makes the sheet too wide for practical use.
Not in plain Excel. You'd have to manually copy changes from tracker to Gantt (or rebuild the Gantt). Office Plan automates this: because it works as a native Excel add-in, your Gantt updates automatically when the underlying tracker data changes — no exporting, no app-switching.
Weekly is typical. Update the tracker daily or as work progresses. Update the Gantt weekly based on tracker changes. This keeps both current without excessive overhead.
Some teams work this way successfully, but they're usually smaller (5-7 people) with less frequent task changes. As the project grows, they eventually need a separate tracker. It's worth proactively setting up both from the start.
Yes, for transparency. But the Gantt is harder to act on (it's timeline-focused, not status-focused). Use the Gantt for visibility, but manage operations with a tracker.
Key takeaways
Task Tracker: answers "What's happening now?" (status, blockers, % complete)
Gantt Chart: answers "When is everything happening?" (timeline, dependencies, critical path)
Use Tracker for: current status, team operational work, frequent changes, surfacing blockers
Use Gantt for: timeline communication, stakeholder updates, dependency management, large projects
Most projects benefit from both: Gantt for strategy, Tracker for operations
Tracker should be updated weekly or daily; Gantt should be updated monthly
Tools can bridge them: maintain tracker as source of truth, auto-generate Gantt for presentations
Project management tips and tricks
Take the formatting work off your plate
You've decided you need both a task tracker (for daily team operations) and a Gantt chart (for stakeholder communication). You're maintaining your tracker weekly, and you're manually updating your Gantt monthly to keep it in sync. But manually translating tracker data into Gantt format—extracting dates, calculating durations, formatting bars—is tedious busywork that could be automated. Office Plan automates the Gantt part. It's an Excel add-in that turns your tracker data into a professional Gantt chart — right where your data already lives. No app-switching, no import headaches, no duplicate data entry. Maintain your tracker as your operational source of truth. Your Gantt updates automatically, natively in Excel. One source of truth, two views: tracker for operations, Gantt for communication.