Board-ready storytelling: how to turn a large Excel project plan into a clear executive update
Learn to distill a large Excel project plan into a compelling board-ready executive update. Master data storytelling for executives and stakeholders.

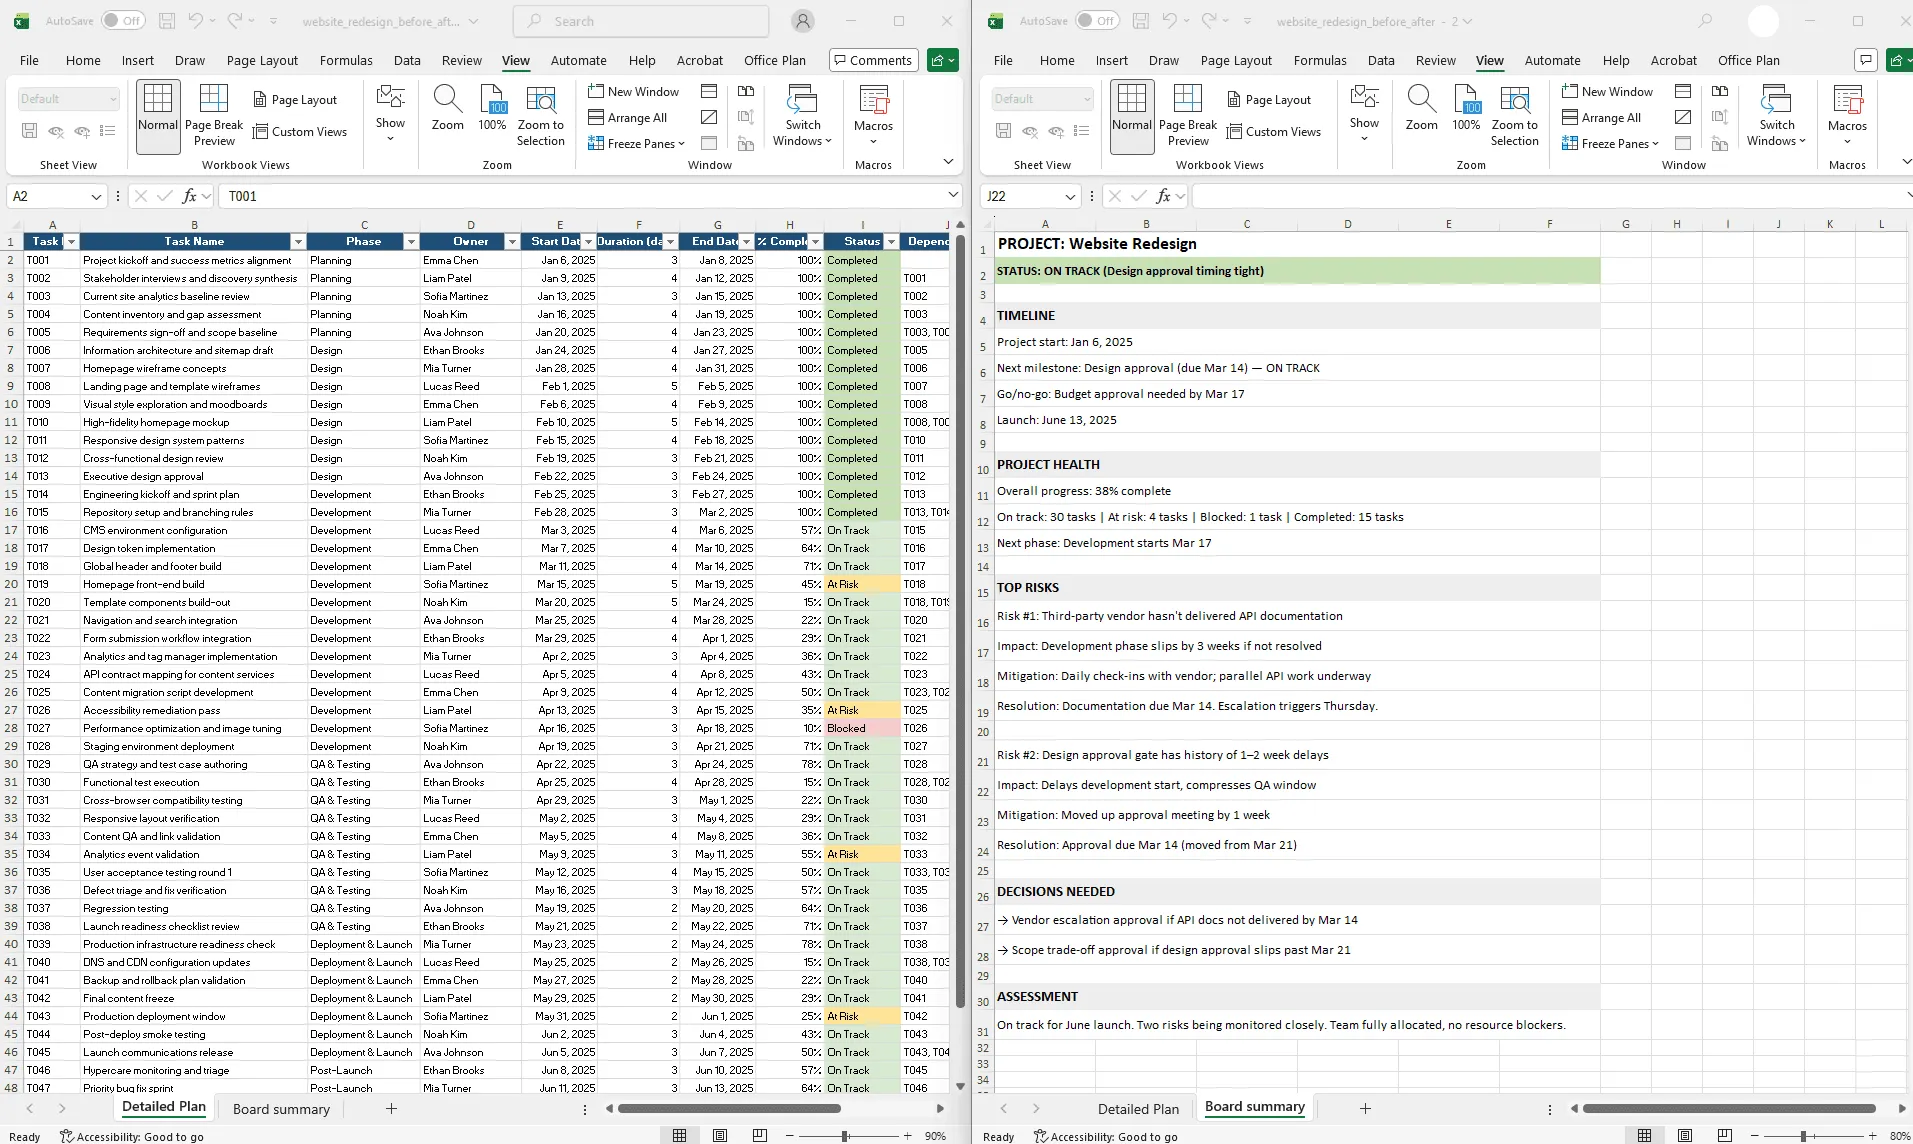
Before and after view of an Excel project plan distilled into a one-page board-ready executive summary with timeline, status, risks, and decisions.
Quick answer
Turn an Excel project plan into a board-ready update by: (1) identifying the core narrative ("Are we on track?"), (2) extracting supporting data (timeline, milestones, risks), (3) framing with context (what this project means to the company), (4) simplifying ruthlessly (cut all non-essential detail), and (5) designing for 5-minute comprehension (one visual, not 10 slides).
Introduction
You're three minutes away from presenting your project to the board. You have a 50-row Excel spreadsheet with task-by-task detail, owner assignments, risk flags, and three sheets of supporting data. The slide deck has 12 slides trying to distill all of it.
The board members have 10 minutes total for your project. They're not going to read 12 slides. They want to understand three things: Is the project on track? When do we get value? What could go wrong?
This is where most project presentations fail. Your Excel plan is comprehensive but analytically dense. Your board update needs to be compelling but operationally sparse. The gap between these two is where clarity gets lost.
Board-ready storytelling is about translating your project truth (detailed Excel data) into board truth (simple narrative with clear outcomes). It requires ruthlessness: what's essential to the story? Everything else is noise.
This guide walks through how to turn an overwhelming Excel plan into a clear, narrative update that boards actually understand, trust, and remember.
What executives actually want from a project update
Before building the update, be clear about what executives need and what they don't.
What executives need:
- A clear answer: Is the project on track? (Status)
- When do we get value? (Timeline to completion, milestone dates)
- What's the biggest risk right now? (Top 1–2 risks)
- What do you need from us? (Decisions required, escalations needed)
What executives don't need:
- Task-by-task status (that's operational)
- Technical jargon (unless they've specifically asked for it)
- Historical context ("we were on track, then slipped") unless it explains current status
- Detailed owner assignments (they don't know your team)
- Dependency details
The focus is narrow: status, timeline, risks, and decisions. Everything else is distraction. The clearer you are on this, the more trust you build.
The 5 elements of board-ready project storytelling
Element 1: the core narrative
Every project update should tell one clear story. Not three stories, not "here are five things happening." One story.
Examples of core narratives:
- "We're on track for launch and have identified one risk we're actively addressing."
- "This phase is delayed by 2 weeks, which pushes launch 1 week. Net impact is small due to buffer we built in."
- "We're blocked waiting for a vendor decision. We recommend making that call by Thursday."
The core narrative should be answerable in one sentence. If you can't state your project's story in one sentence, you haven't distilled it enough.
The rest of your update supports this narrative. But the narrative comes first. Everything else hangs from it.
Element 2: timeline and critical dates
Executives think in terms of time: "When will this be done? When do I see value?"
Extract critical dates from your Excel plan:
- Project start date
- Next critical milestone (soonest milestone that's at risk or coming up)
- Go/no-go decision points (dates when major decisions must be made)
- Project completion / value realization date
These 3–4 dates are all executives need. Don't show every milestone. Show the critical ones.
Example:
| PROJECT TIMELINE Start: January 15 Next Milestone: Design approval (due Feb 28) — ON TRACK Go/No-Go: Budget approval needed by March 1 Launch: June 15 |
Four dates. The timeline story is complete.
Element 3: top 1–2 risks and mitigation
Executives care about risks. But not a list of 10. The top 1–2 risks that could actually derail the project.
For each risk:
- What is it? (Clear, one sentence)
- Why does it matter? (Impact on timeline, budget, scope)
- What are we doing about it? (Mitigation strategy)
- When do we know if this is resolved? (Resolution timeline)
Example:
| CRITICAL RISKS Risk #1: Third-party vendor hasn't delivered API documentation Impact: If not resolved, Development phase slips by 3 weeks (delays launch) Mitigation: Daily check-ins with vendor; parallel API speculation underway Resolution timeline: Documentation due March 15. If not, we escalate Thursday. Risk #2: Design approval gate has history of delays Impact: Design phase currently on track, but approval delays past 1-2 weeks have happened Mitigation: Moved up approval meeting 1 week to avoid conflict with development start Resolution timeline: Design approval due Feb 28 (moved from March 7) |
Simple. Specific. Actionable.
Element 4: what you need from the board
Board members want to know: "What do you need from me?" If the answer is "nothing, we're on track," they're satisfied. If the answer is "we need a decision from finance by March 1," they know exactly what's required.
Be specific:
- Decision needed? (What, by when, who decides?)
- Budget approval needed? (How much, which category?)
- Resource commitment? (Which team, how many people?)
- Risk escalation? (What's the issue, what's the recommendation?)
Example:
| DECISIONS REQUIRED FROM THE BOARD 1. Vendor risk escalation (if API docs not delivered by March 15) - Recommendation: Contact vendor CTO directly for emergency delivery - Timeline: Need approval to escalate if docs don't arrive by Thursday 2. Scope trade-off (if design approval slips past March 7) - Recommendation: De-prioritize these 3 features to avoid launch delay - Timeline: Need scope approval by March 1 if design delays are evident |
This frames the board's role clearly. They're decision-makers, not an audience.
Element 5: the one-page executive summary
Combine all four elements into a single-page visual:
| PROJECT: Website Redesign Status: ON TRACK (Yellow: Design approval timing tight) Timeline: Start: Jan 15 | Design Approval: Feb 28 | Launch: June 15 Next Milestone: Design Approval (Feb 28) — ON TRACK Status: 60% of designs reviewed; final review scheduled Feb 21 Critical Risks: ⚠ API vendor documentation (due Mar 15) — if delayed, dev phase slips 3 weeks ⚠ Design approval timing (history of 1-2 week delays) — mitigated by moving up approval 1 week Decisions Needed: → Escalation approval if vendor docs don't arrive by Mar 15 → Scope trade-off approval if design approval slips past Mar 7 Resource Status: Team fully allocated, no blockers Overall Assessment: On track for June launch. Two risks being monitored closely. |
One page. 5-minute read. Everything an executive needs to understand the project, assess the risks, and know what's required of them.
Step-by-step: distilling a large Excel plan into a one-page visual
Here's how to create this from your Excel data:
Step 1: Extract key dates from Excel
Open your project plan. Find:
- Project start date (minimum value in Start Date column)
- Next upcoming milestone (minimum incomplete milestone date)
- Project end date (maximum value in End Date column)
- Any hard deadlines (external constraints)
Excel formulas:
| Project Start: =MIN(Plan!B:B) Next Milestone: =MIN(IF(Plan!H:H<>"Complete",Plan!D:D)) Project End: =MAX(Plan!D:D) |
Copy these dates into a summary sheet.
Step 2: Identify top risks from Excel
Review the Risk column (or Status column if it flags risks). Look for:
- Tasks marked "At Risk" with highest impact (longest duration, blocking other work)
- External dependencies (vendor, third-party, regulatory)
- Resource constraints (understaffed phases, key person dependencies)
Pick the top 2 risks. For each, document what the risk is (1 sentence), impact if it happens (timeline slip, budget impact), mitigation (what you're doing about it), and resolution date (when you'll know if it's resolved).
Step 3: Calculate current status
From Excel, calculate:
- Overall % complete: =AVERAGE(Plan!G:G)
- Tasks on track: =COUNTIF(Plan!I:I,"On Track")
- Tasks at risk: =COUNTIF(Plan!I:I,"At Risk")
- Phases complete: =COUNTIF(Plan!H:H,"Complete")
Build a simple status summary:
| Status: [% Complete]% complete On Track: X tasks At Risk: Y tasks Completed: Z phases |
Step 4: Frame the narrative
Write your core narrative in one sentence:
"The Website Redesign project is [on track / at risk / blocked], with [specific reason], and will launch as planned on [date] unless [one risk] derails us."
Example narratives:
- "The Website Redesign is on track for June 15 launch. We're monitoring one vendor risk and have a mitigation in place."
- "The Website Redesign is at risk of a 2-week delay due to design approval timing, but we've mitigated by moving up the approval gate."
- "The Website Redesign is blocked waiting for finance approval. We recommend expediting the budget decision."
This narrative is the centerpiece. Everything else supports it.
Step 5: Design the one-page summary
Use a simple template:
| [PROJECT NAME] [CORE NARRATIVE IN ONE SENTENCE] Timeline: [Start] → [Milestone 1: Date] → [Milestone 2: Date] → [Launch: Date] Status Summary: - Overall: [X]% complete - On Track: X tasks | At Risk: Y tasks | Completed: Z phases - Next milestone: [Milestone name] due [date] — [status] Critical Risks: 1. [Risk 1] — Impact: [impact] — Mitigation: [action] — Resolution: [date] 2. [Risk 2] — Impact: [impact] — Mitigation: [action] — Resolution: [date] Decisions Needed: → [Decision 1]: Required by [date] → [Decision 2]: Required by [date] Assessment: [Closing statement about project health and confidence] |
Step 6: Create the board visual
This is where most teams lose time. Translating your summary data into a polished visual means designing timeline graphics, formatting status indicators, and laying everything out cleanly. Every time your project data changes, you redo this work.
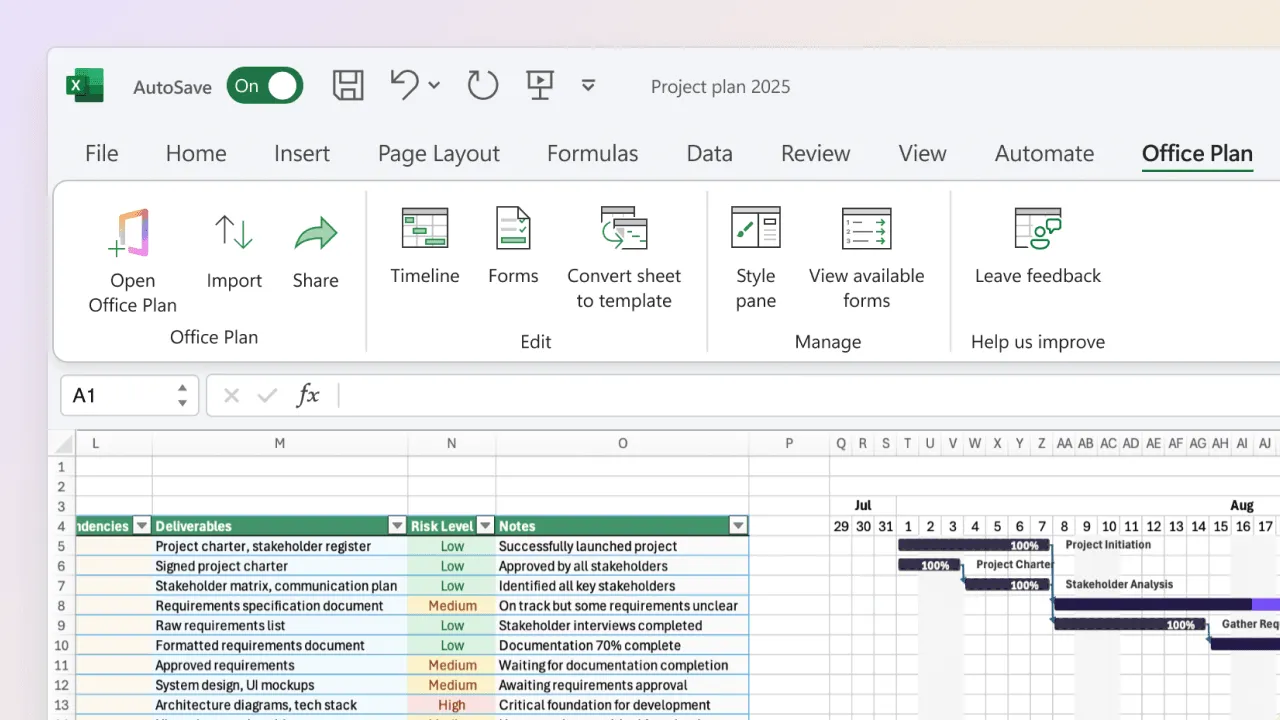
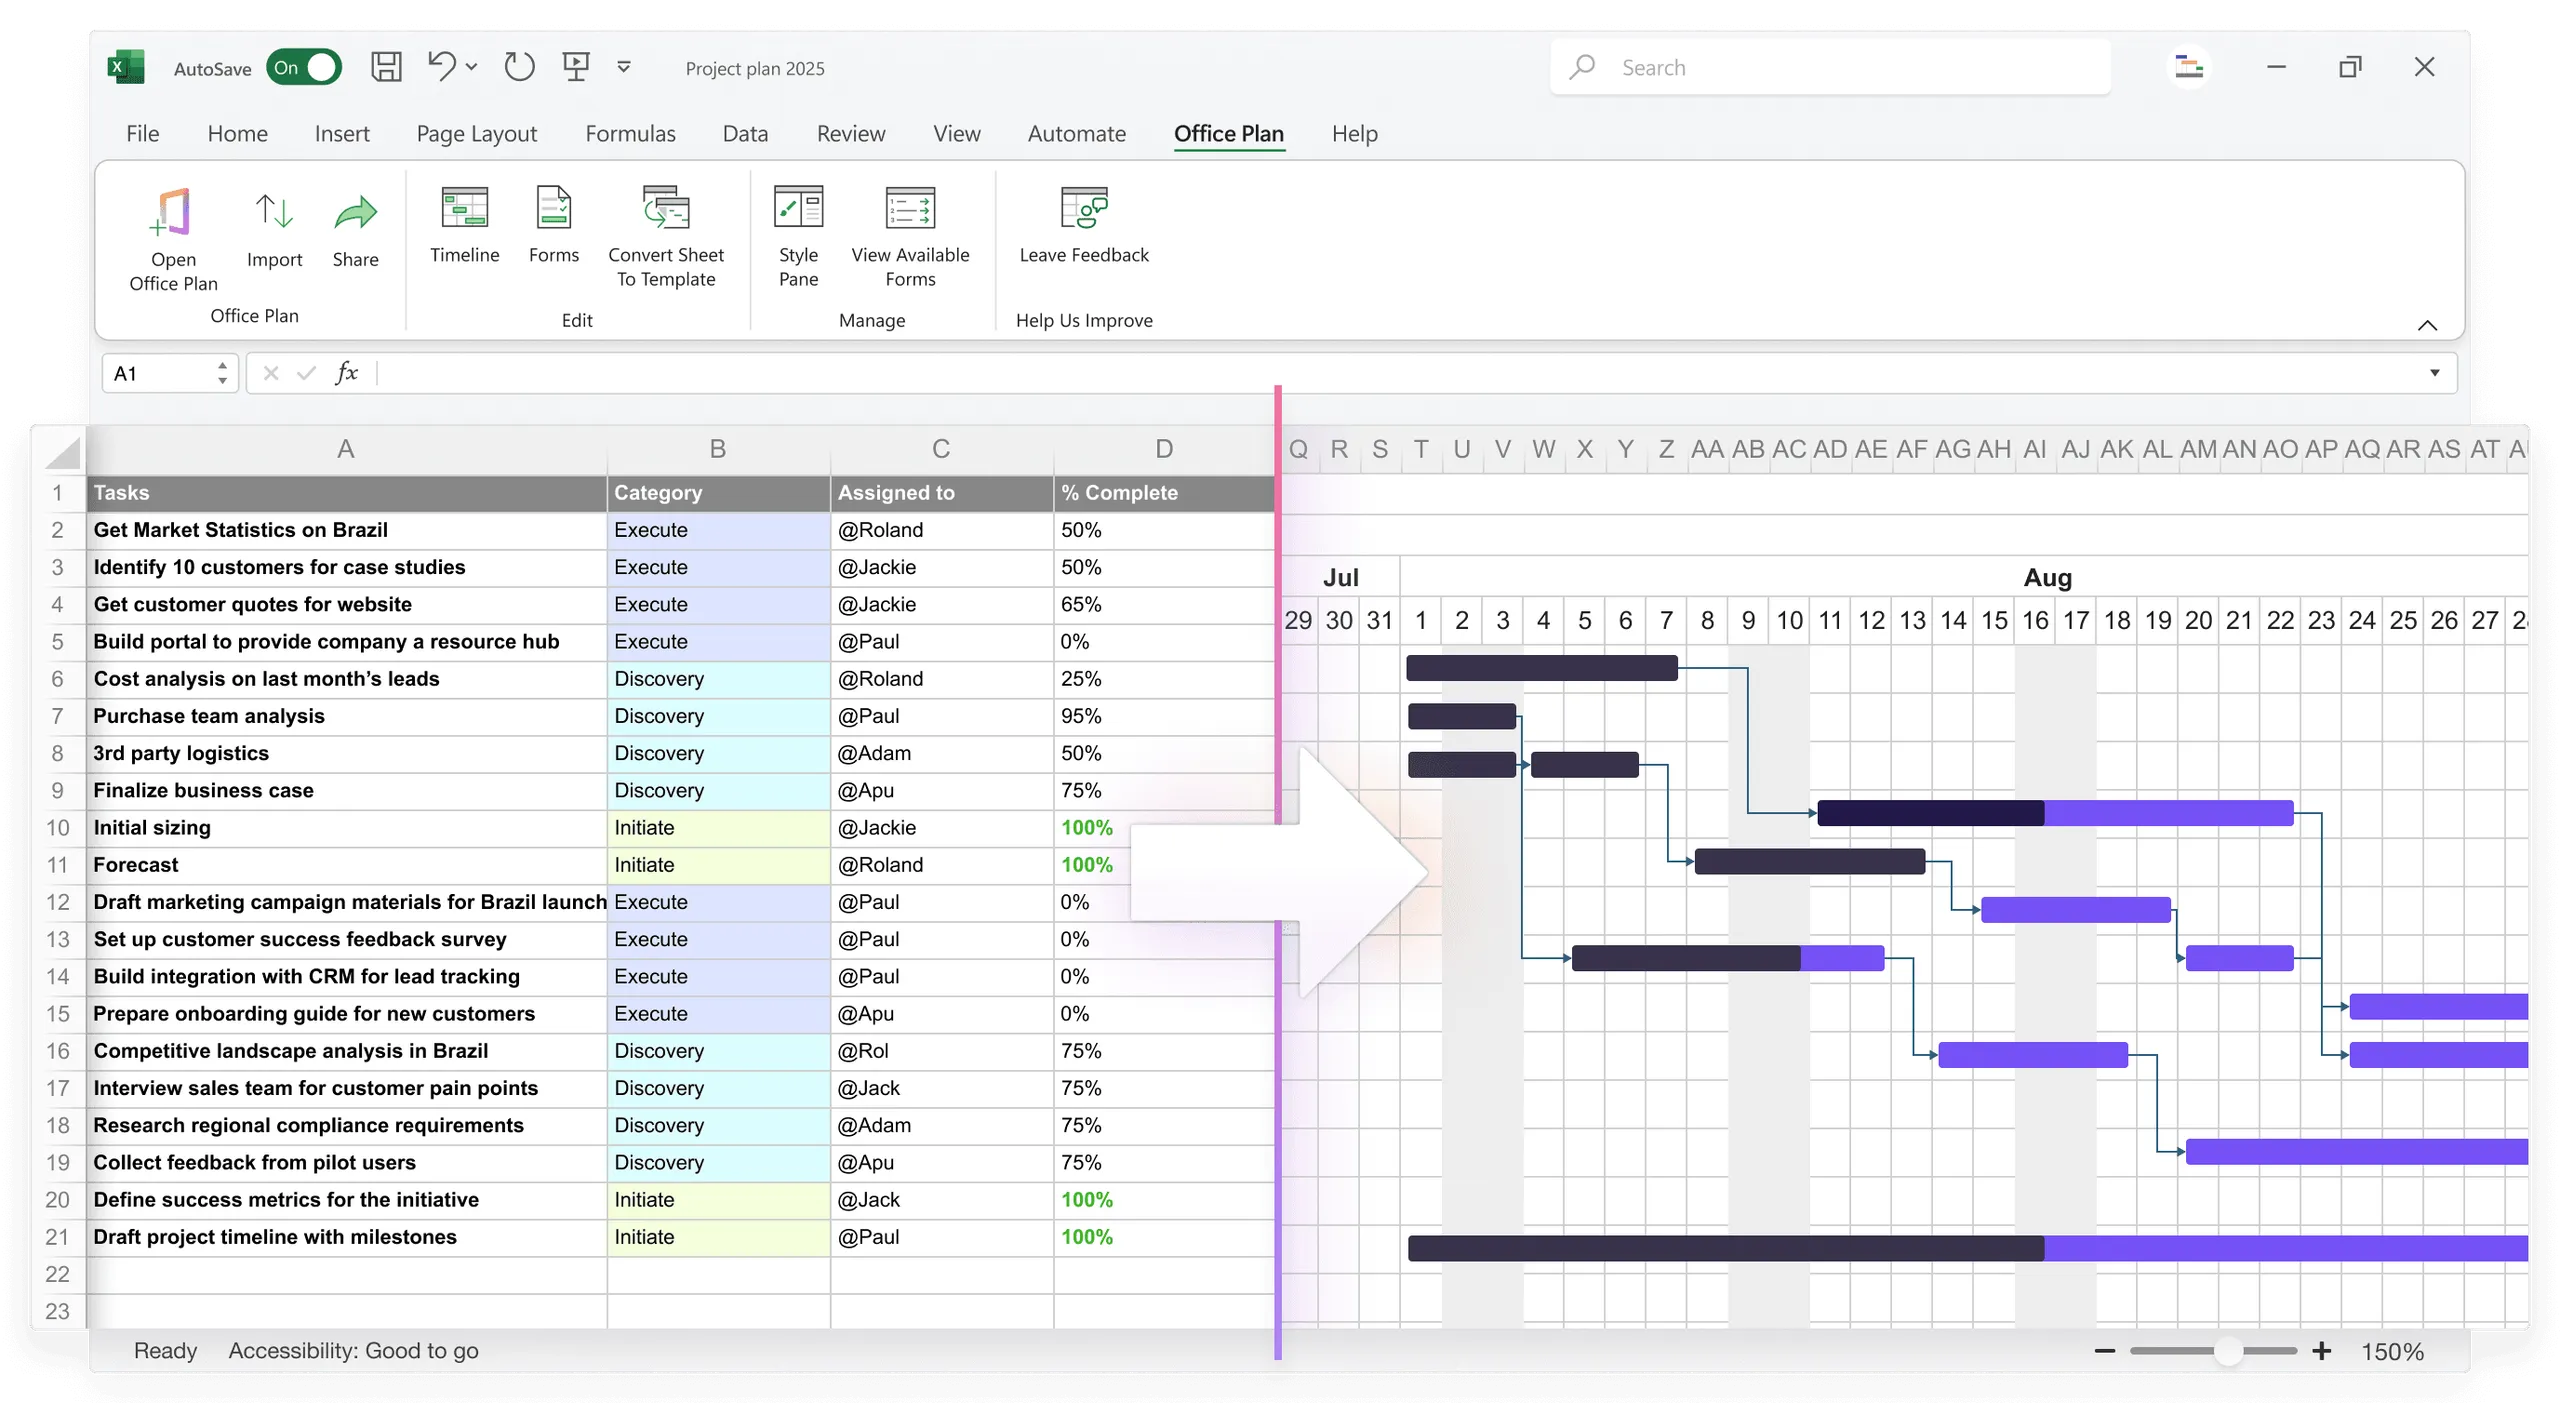
The better workflow: keep your project data in Excel and let a purpose-built tool generate the visual layer. Office Plan reads your Excel project data and creates a professional timeline visual right inside your spreadsheet. The dates, milestones, and status indicators stay connected to your data. When the plan changes, the visual updates.
Your narrative and analysis are yours to craft. That's the strategic work. The visual formatting is the part that should be automatic.
What to cut vs. what to keep
When distilling, you'll be tempted to include detail. Here's a cutting guide:
Cut (detail, not strategic):
- Individual task names (unless a specific task is at risk)
- Owner assignments (unless ownership is an issue)
- Task durations (unless a task is unexpectedly long)
- Dependencies and sequencing (operational, not strategic)
- Budget details (unless budget is a risk)
- Resource allocations (unless there's a bottleneck)
Keep (strategic, impacts board decisions):
- Overall project status
- Timeline and critical dates
- Next milestone and its status
- Top 1–2 risks and mitigation
- Decisions or approvals needed
- Impact if risks materialize
- Your confidence in the plan
The rule: if it doesn't directly answer "Is the project on track? When will we get value? What could go wrong?" cut it.
How to frame risks and milestones as narrative
Risks and milestones are narrative elements. Frame them with story:
Weak: "API documentation is late." Strong: "The vendor hasn't delivered API documentation, which blocks our development phase. If it's delayed past March 15, our June launch slips by 3 weeks. We're in daily contact with them and have asked for emergency delivery. We'll escalate to their CTO if we don't have docs by Thursday."
The second version is a story: problem, impact, action, timeline. Executives understand immediately what's happening and why it matters.
Same with milestones:
Weak: "Design milestone Feb 28." Strong: "Design approval is due Feb 28. We've completed 60% of designs and scheduled the approval review for Feb 21 to leave buffer before development starts. Historically this gate slips by 1–2 weeks, but we've mitigated by scheduling earlier."
Status, context, mitigation, timeline. That's the structure that builds confidence.
Template: the one-page executive project summary
A ready-to-use template:
| ═══════════════════════════════════════════════════════════════ PROJECT: [Name] STATUS: [ON TRACK / AT RISK / BLOCKED] — [Brief reason] ═══════════════════════════════════════════════════════════════ TIMELINE Project Start: [Date] Next Milestone: [Milestone name] due [Date] — [ON TRACK / AT RISK] Project Launch: [Date] [Visual: Simple timeline with these three points] PROJECT HEALTH Overall Progress: [X]% complete Latest Status: [Number] tasks on track, [number] at risk, [number] complete Next Phase: [Name] starts [date] TOP RISKS & MITIGATION Risk #1: [Brief description] ↳ Impact: [Timeline slip / budget impact / scope cut] ↳ Mitigation: [What we're doing] ↳ Resolution: [When we'll know if it's resolved] Risk #2: [Brief description] ↳ Impact: [Timeline slip / budget impact / scope cut] ↳ Mitigation: [What we're doing] ↳ Resolution: [When we'll know if it's resolved] DECISIONS NEEDED → [Decision 1] required by [Date] → [Decision 2] required by [Date] ASSESSMENT [1-2 sentences on overall project confidence and what success looks like] ═══════════════════════════════════════════════════════════════ |
Fill in the brackets, and you have a board-ready executive update.
Frequently asked questions
Provide the one-page summary in the meeting, then offer additional detail if asked. Prepare backup materials with task detail, budget breakdown, or resource allocation. But start simple. Most won't ask for more, and starting with clarity builds trust.
Monthly if the project is large or has dependencies. Quarterly for smaller projects. After major changes (risk materialization, timeline slip, scope change), provide an update immediately. Consistency builds confidence.
Only if budget is a risk or if budget approval is needed. If the project is on budget and no decision is required, leave it out. Executives are focused on timeline and risk, not line-item budget unless there's a problem.
Pick the two most likely or most impactful. Mention that you're tracking others, but don't list them all. If the board asks, have the full risk register ready. Simplicity in the summary doesn't mean you aren't managing the detail.
Lead with honesty. If there are risks, own them. Show what you're doing to mitigate. Provide data (historical project performance, team experience). Boards respect confidence grounded in reality more than false certainty.
Yes. Tailor slightly for the internal audience (add resource info if relevant, cut the executive decision section if not needed), but the core format works for any audience that needs strategic clarity without operational detail.
Key takeaways
- Board-ready storytelling means distilling detailed Excel data into one clear narrative that answers: Are we on track? When do we launch? What could go wrong?
- Executives need four things: status, timeline, top risks, and decisions needed. Everything else is noise.
- Write your core narrative in one sentence. If you can't, you haven't distilled enough.
- Frame risks and milestones as stories with context, impact, mitigation, and resolution timeline. That structure builds trust.
- Design for 5-minute comprehension. If your update needs 20 minutes of explanation, the visual isn't clear enough.
- Cut ruthlessly. If a detail doesn't impact a board decision, it doesn't belong in the summary.
- Keep your project data in Excel and let your visual layer stay connected to it. Tools like Office Plan generate professional timeline visuals directly from your spreadsheet, so the board-ready view updates as your project evolves.
Project management tips and tricks
Make every board update clear without the rework
You've done the strategic work: distilled your project into a narrative, identified the risks, framed the decisions. Now you need a visual that matches the clarity of your thinking. Office Plan generates professional timeline visuals directly from your Excel project data. Milestones, phases, and status indicators stay connected to your spreadsheet. When the plan changes, the visual updates. No manual reformatting, no rebuilding slides, no version that falls out of sync. Clear data. Clear visuals. Clear decisions.