
A swimlane diagram is a type of flowchart that typically groups processes or sub-processes by owner or major participants. Such a swimlane flowchart is particularly useful when processes involve cross-functional teams since the visual separation of underlying steps in lanes (highlighted as columns or rows) makes the diagram clear and easy-to-follow.
On this page, we will show you how to create a cross-functional flowchart both manually, using the drawing functions in Microsoft Word, and automatically, with the help of the PowerPoint add-in from Office Timeline.
Which tutorial would you like to see?


How to manually make a swimlane diagram in Microsoft Word
1. Prepare your document.
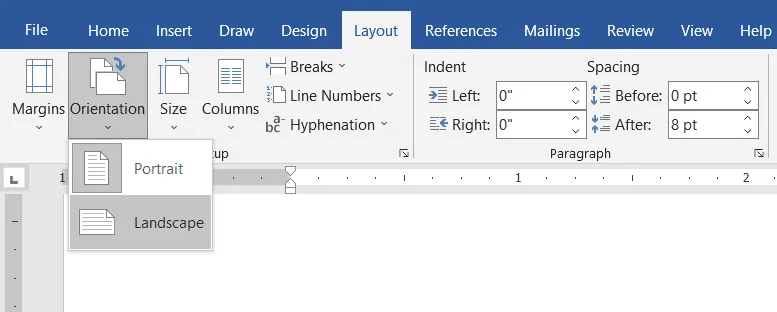
a) Open a new Word document and change the default page layout from “Portrait” to “Landscape” to make more room for a diagram with horizontal lanes.
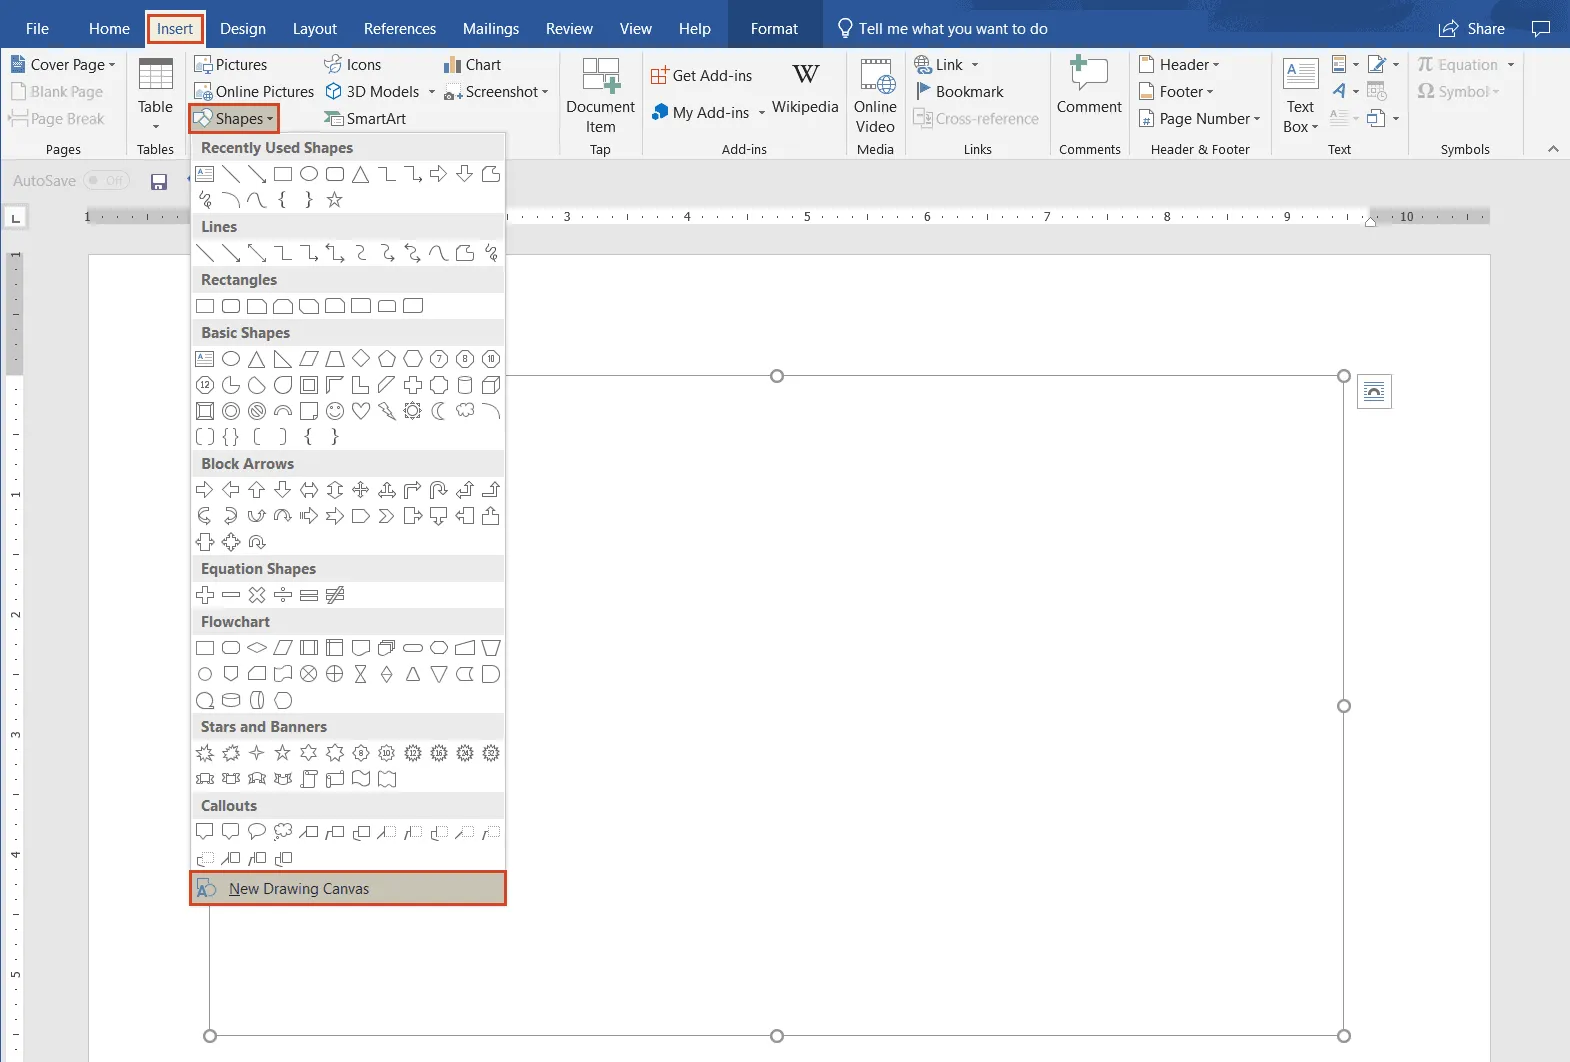
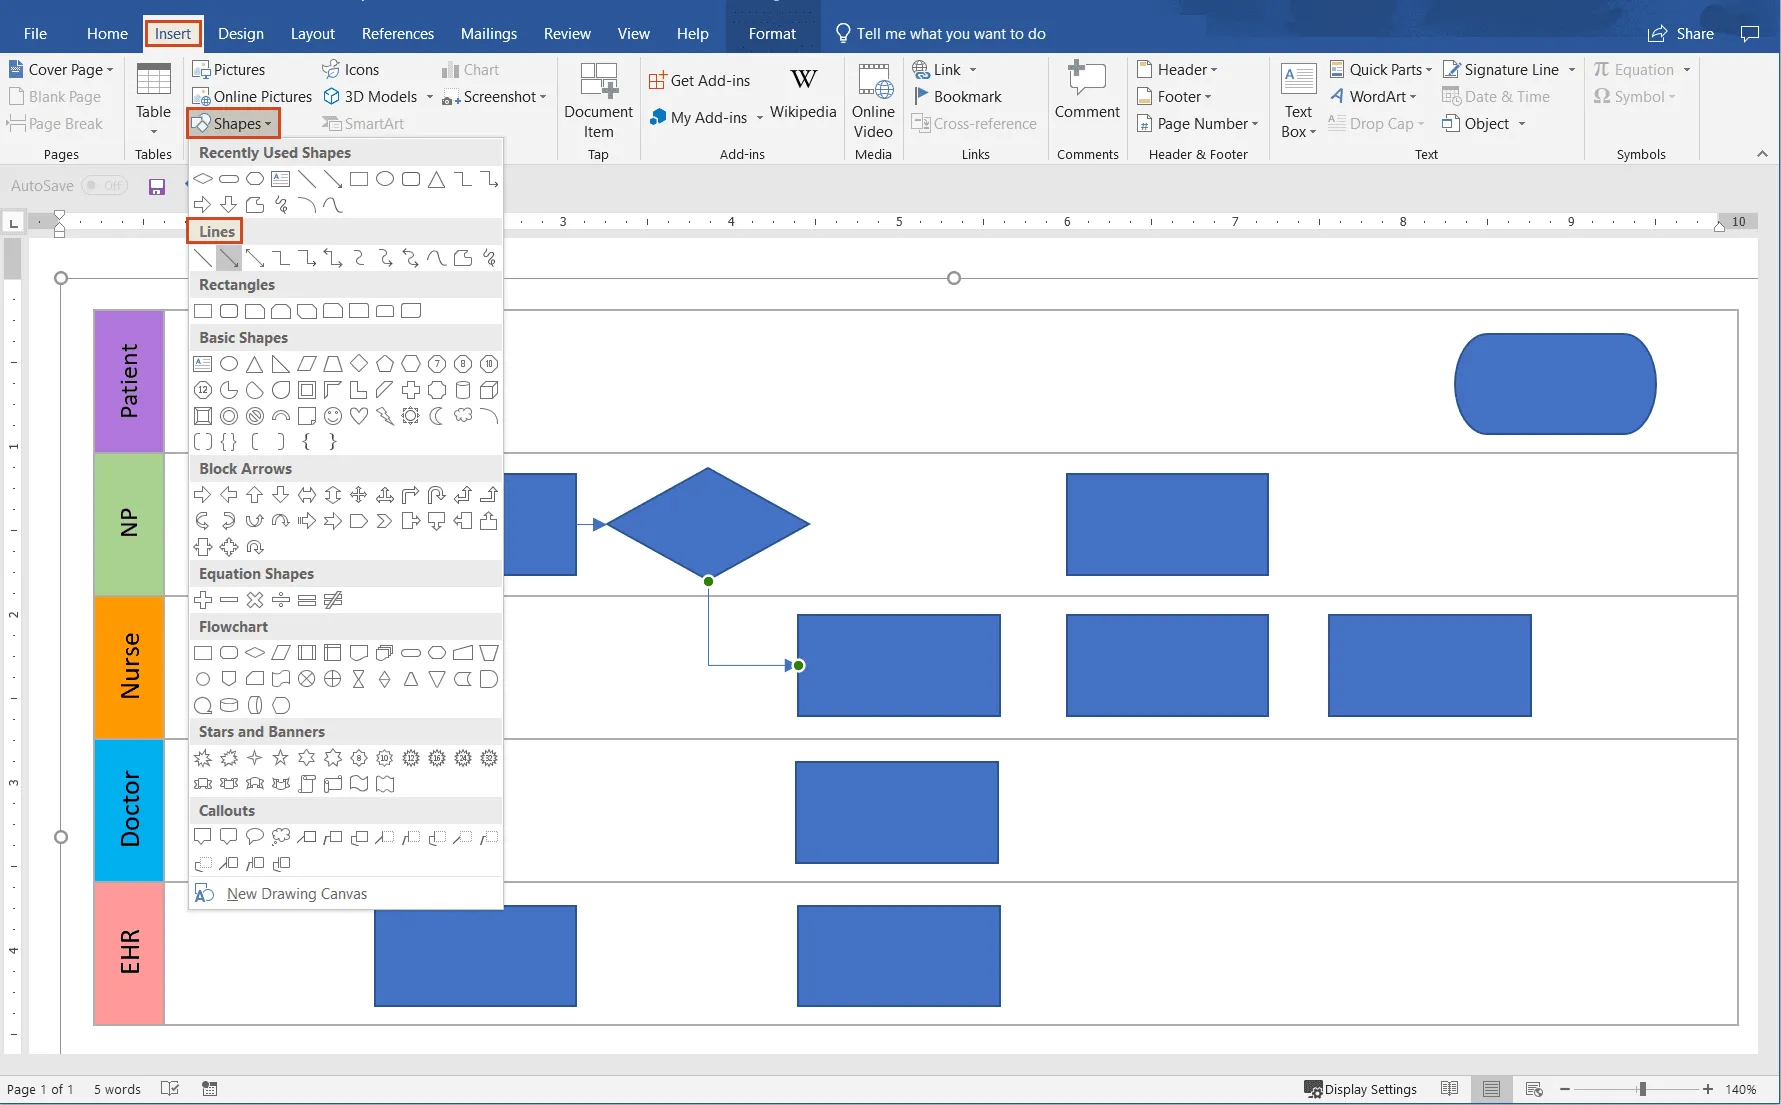
b) To optimally use MS Word’s drawing capabilities, you’ll need to insert a “drawing canvas”. Go to the Insert tab and select Shapes, then New Drawing Canvas.
Working in a drawing canvas allows you to properly use all the program’s drawing features to their full extent. Otherwise, you will find that objects on your chart are randomly repositioned, or connectors removed from their associated shapes when making a change to any other parts of the graphic.
2. Create swimlanes.
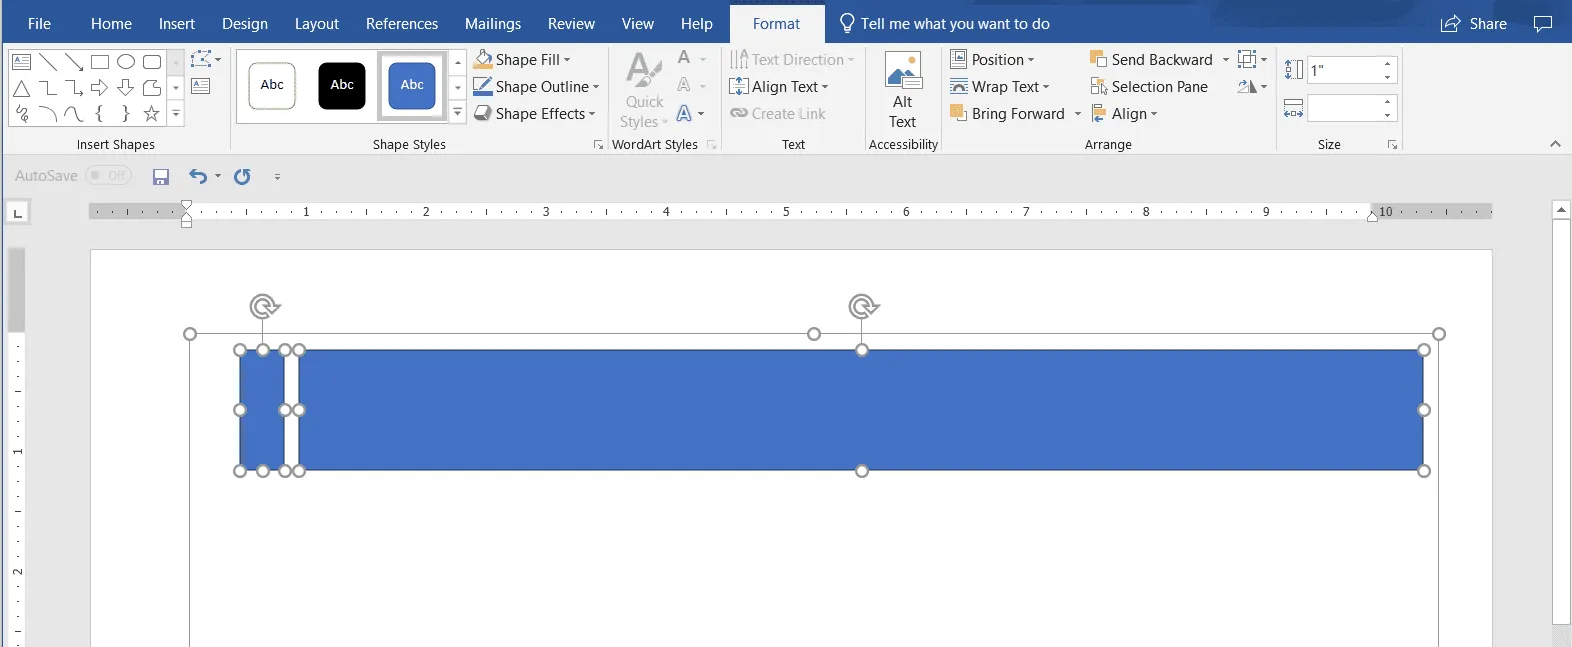
a) Go to the Insert tab again, select Shapes, and add a large rectangle to your slide. This will be the main part of your swimlane.
b) Add another rectangle on the left to use it as the title section of your swimlane.
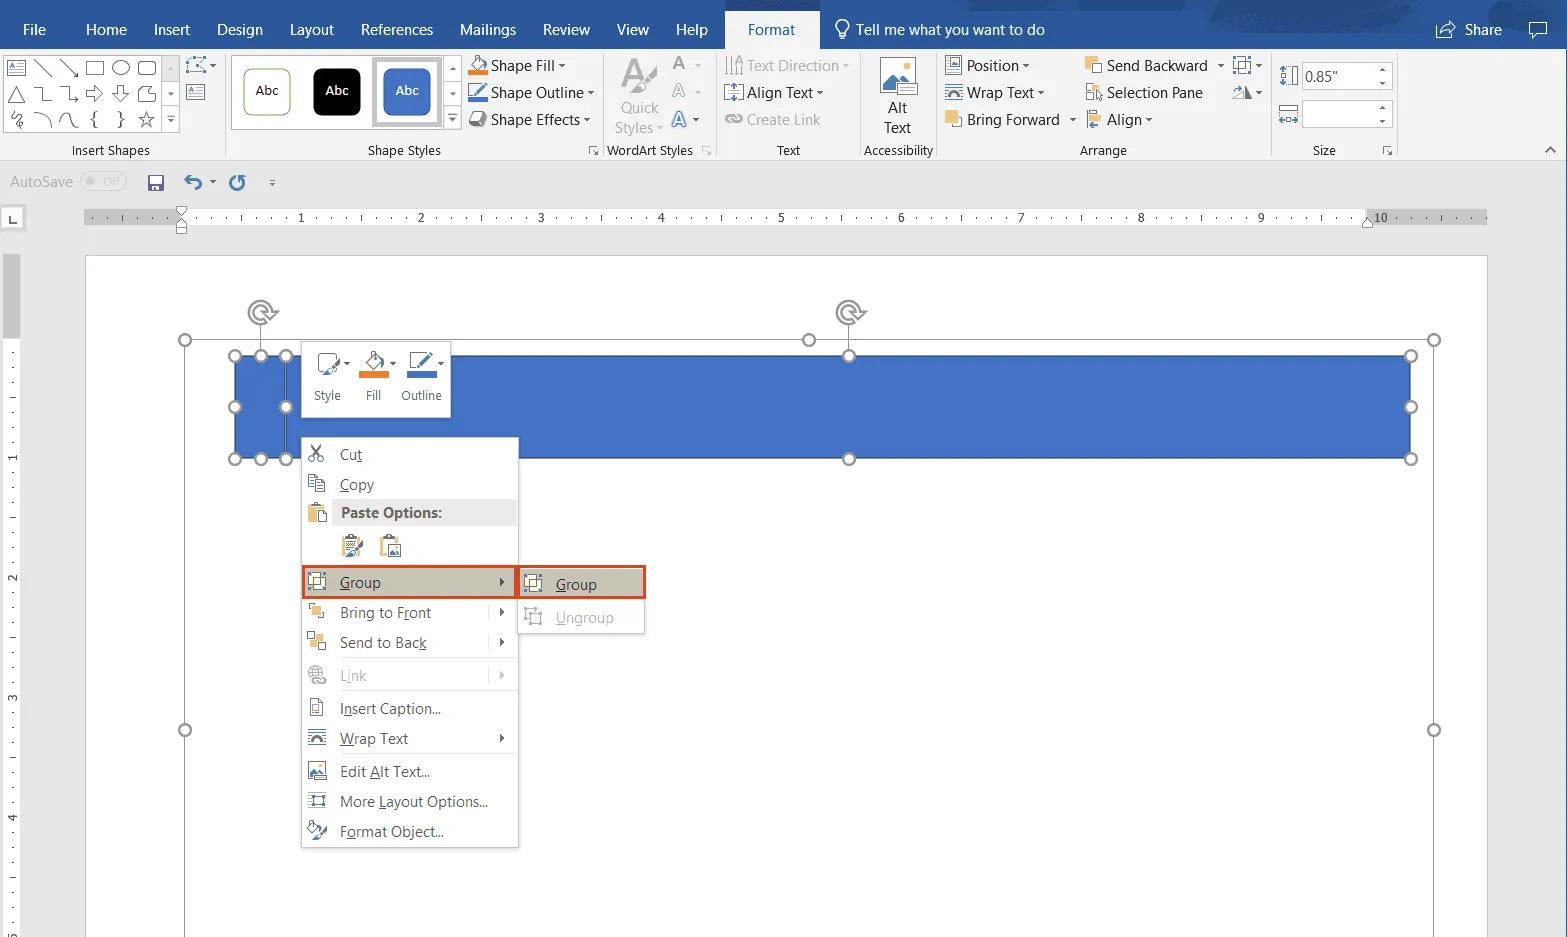
c) Group the two shapes so that you can apply changes to both at once from now on. Select the two items, then right-click and choose Group from the small menu that opens.
i. To do this, first position the shapes as needed. Then, select them both, right-click and select Group > Group. You can easily ungroup them the same way, if needed (right-click and select Group > Ungroup).
ii. At this point, you can change the color and the outline of the swimlane. Use the Fill and Outline options found in the same menu that opens when you select and right-click on the shape. In our example, we chose to make the swimlane containers transparent and changed their outline to gray for improved clarity and to make them stand out.
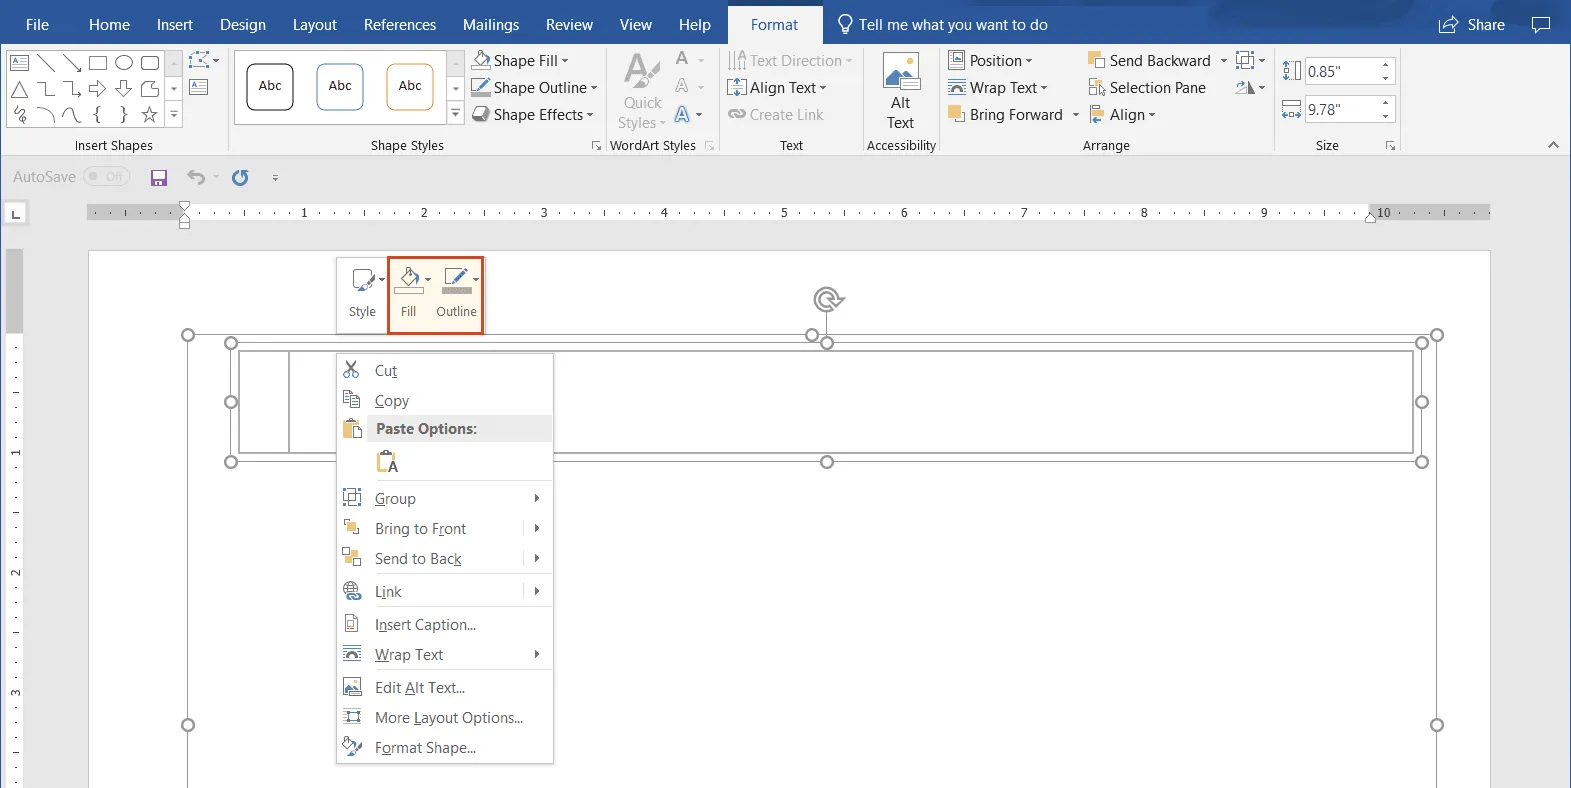
iii. When done, copy and paste the original shape as many times as necessary and position the duplicates below one another until you have enough swimlanes to complete your cross-functional diagram.
3. Label your swimlanes.
Now that you have outlined the basic frame of your swimlane diagram, you can start adding data to its individual horizontal bands. The main thing to do here is to label these with the name/title of the major process participants so that you can later group the associated items by owner in their corresponding swimlane.
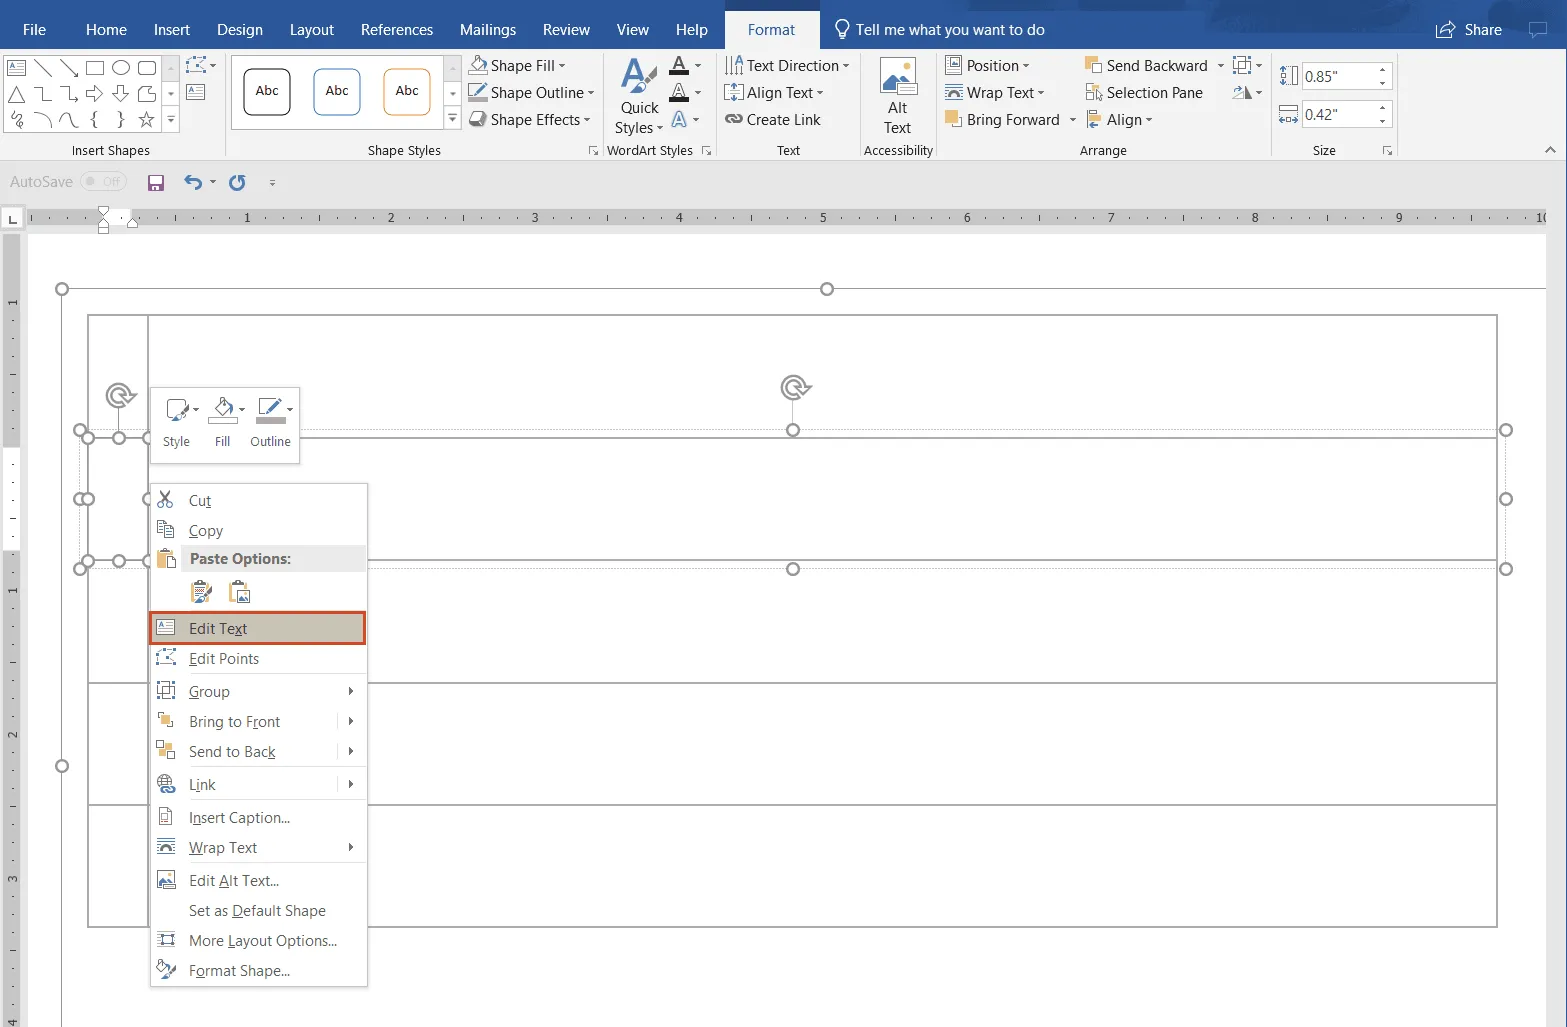
a) To add titles to any swimlane, select the small rectangle inserted for this purpose in the steps above, right-click on its edge, choose Edit Text and start typing.
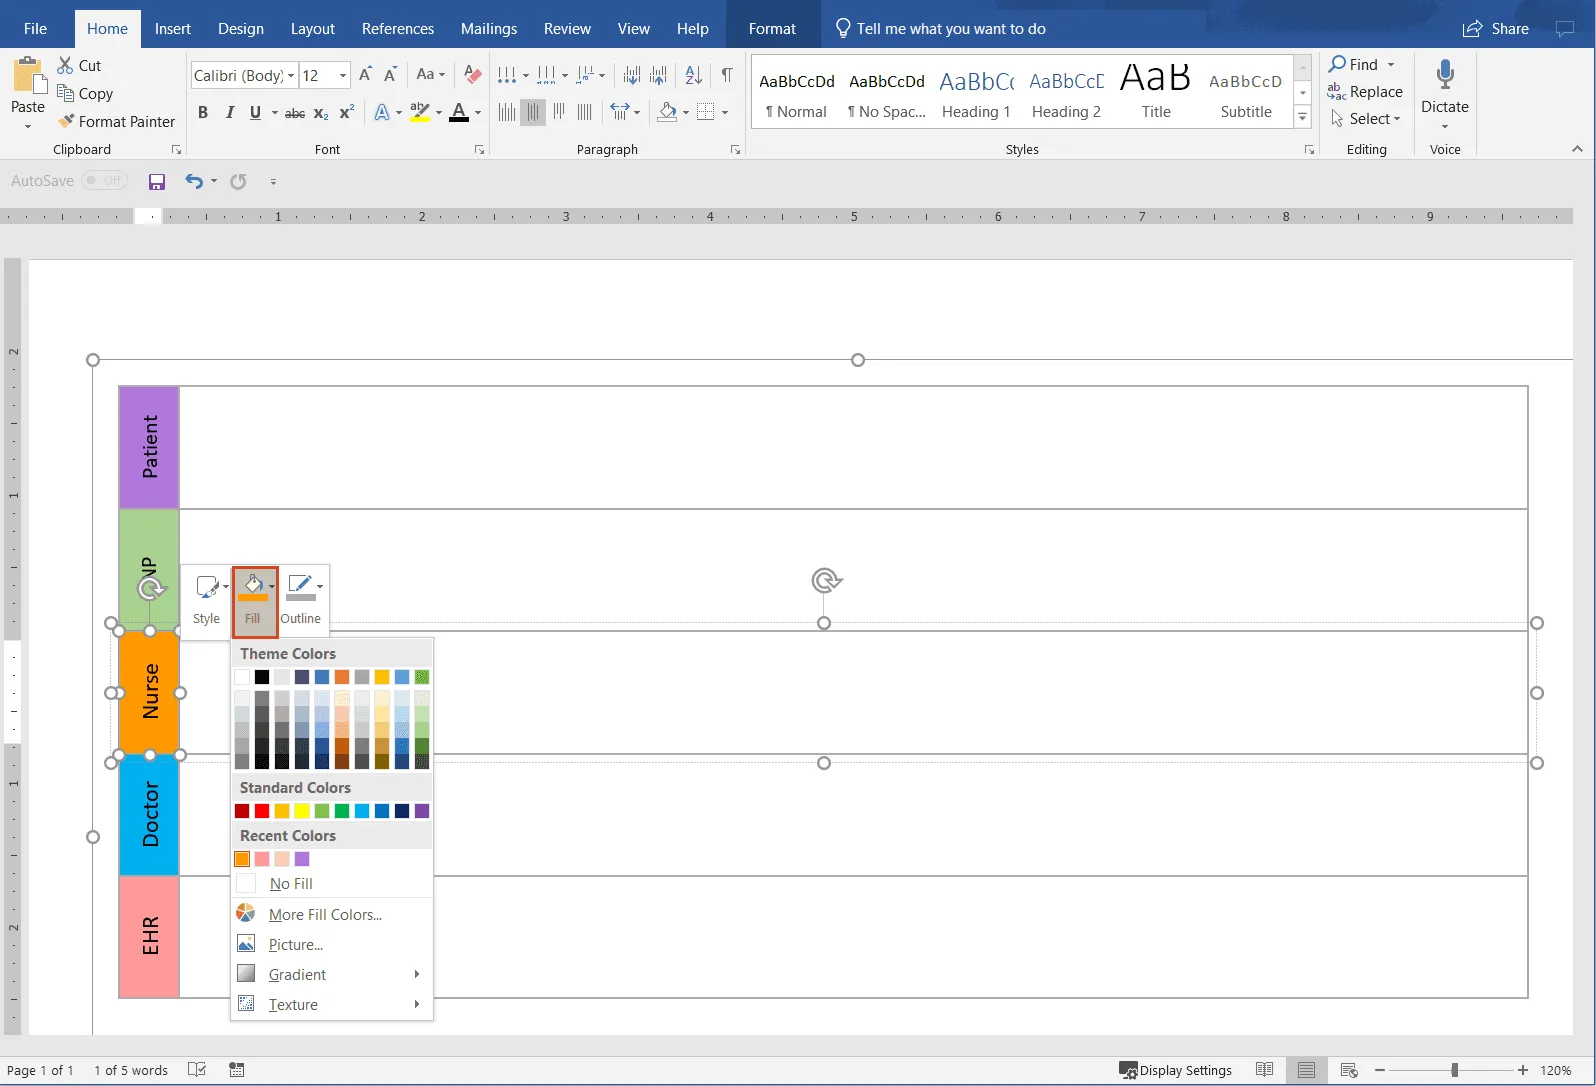
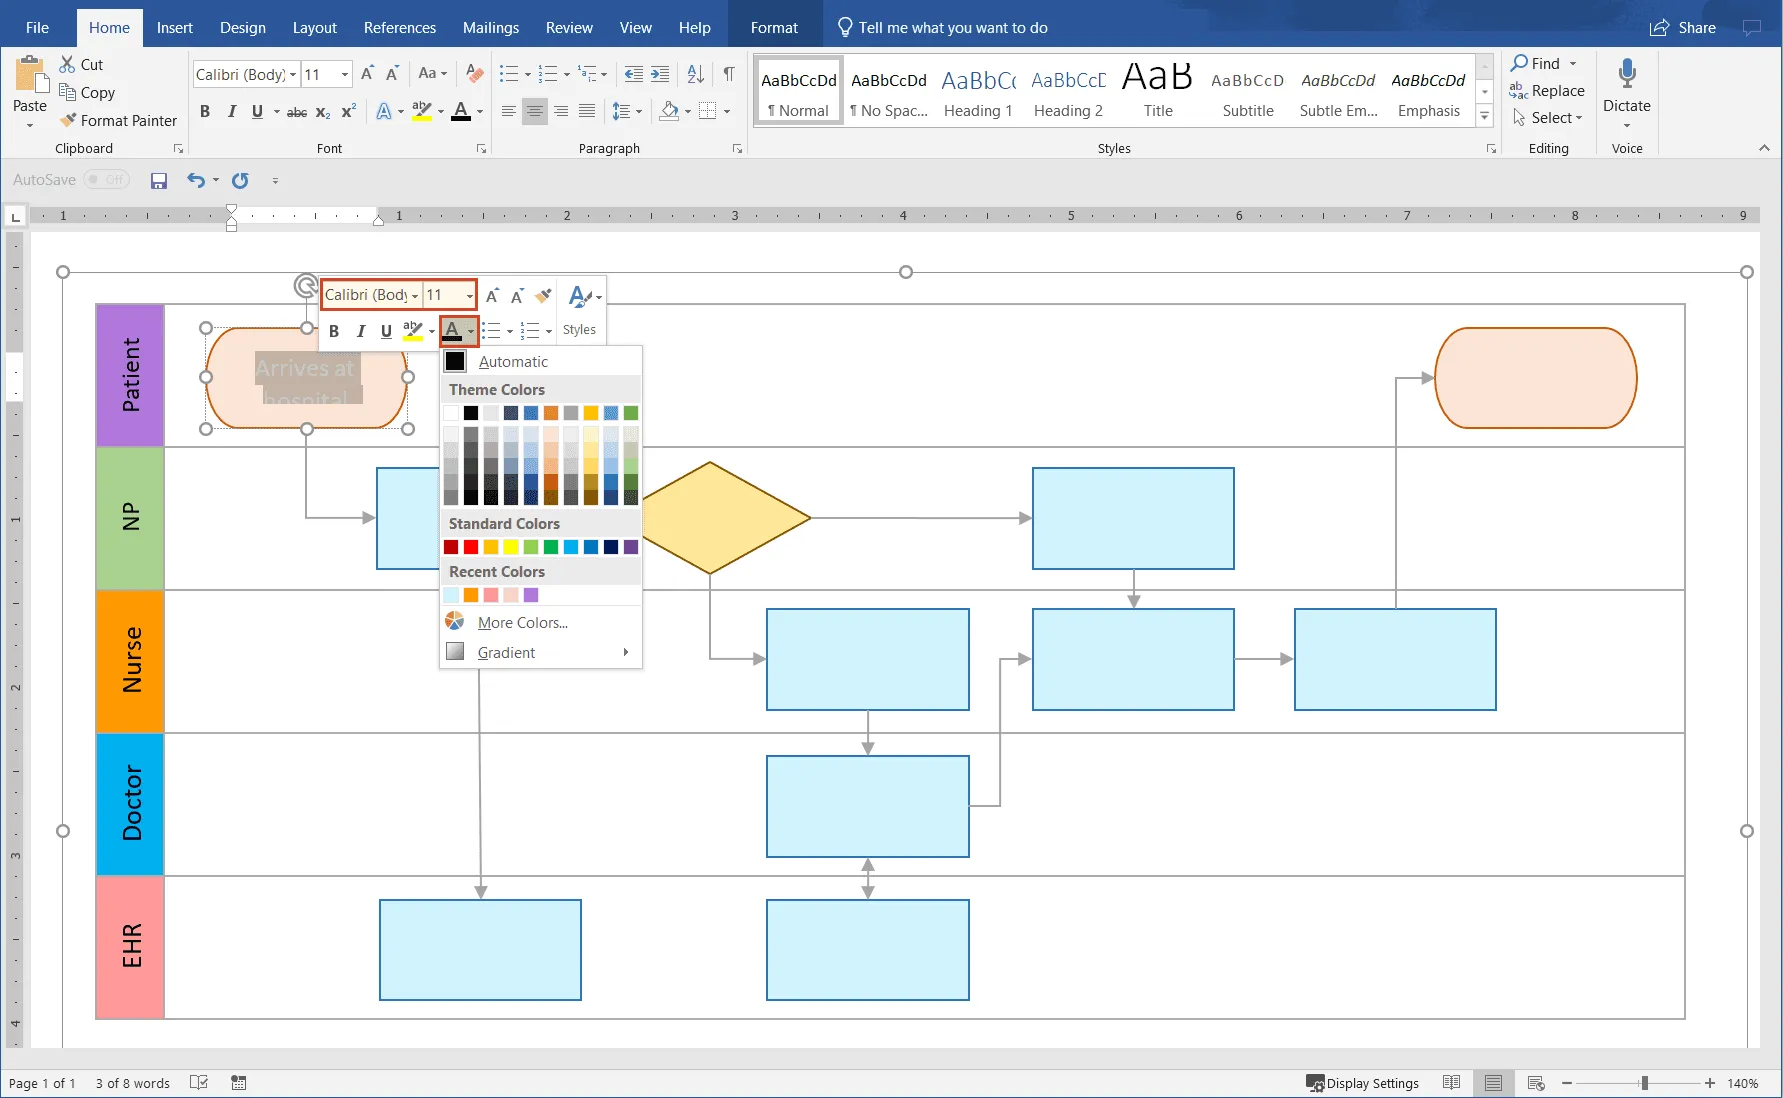
b) You can customize the text as needed – change its size, color, or style using the options in Home > Font. Given that the default font is very large, you will probably need to change its size first, and then its color to make sure the text is visible on the shape color that you want to use.
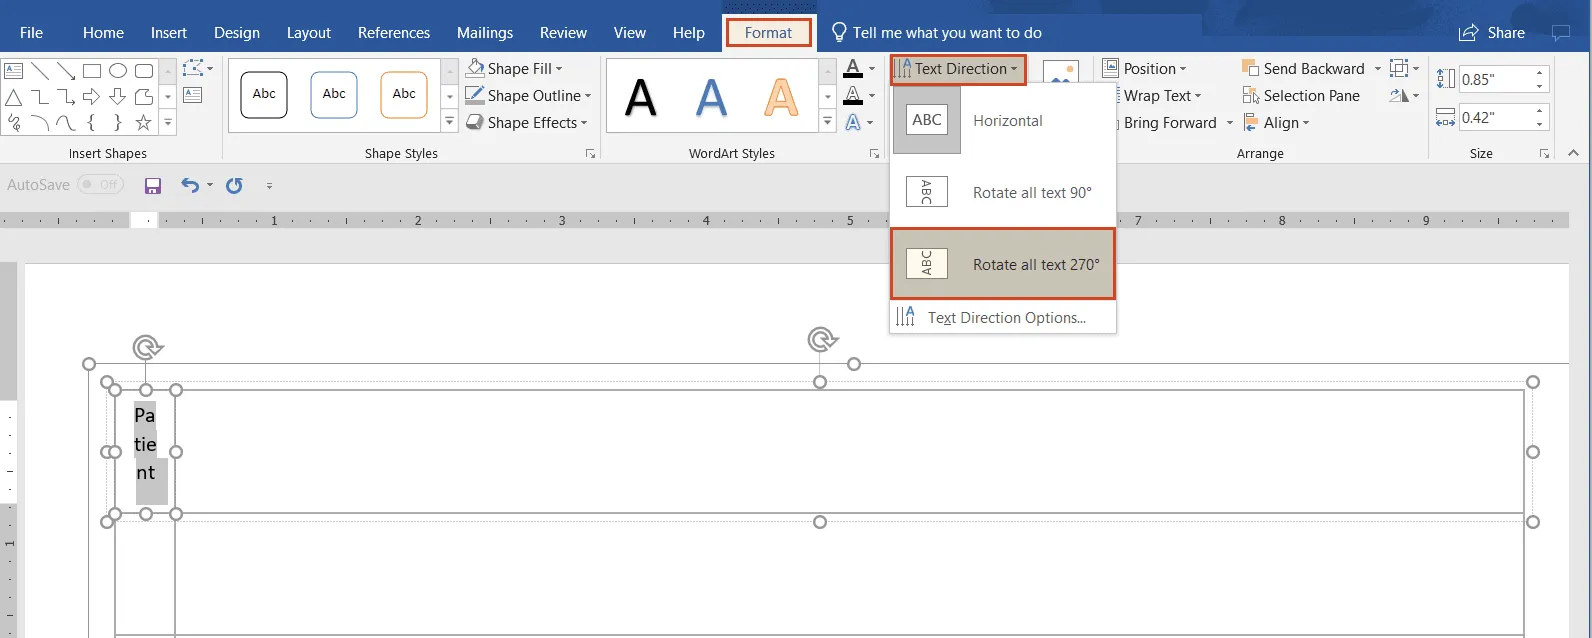
c) If you want to change text orientation, select the text, then go to Format > Text > Text direction. We opted for Rotate all text 270° to save space on the lanes.
d) To recolor a label section, right-click on it and select a new option from the Fill color palette.
4. Build a flowchart.
With your swimlanes ready, start creating the flowchart that will show who does what and how process steps are interconnected in your diagram.
a) To add flowchart items, insert shapes from the Shapes section of the Insert tab. We chose the shapes per conventions related to swimlane diagrams: arrows to show the order of operations, rectangles to represent process steps, ovals to mark the beginning and end of the process, etc.
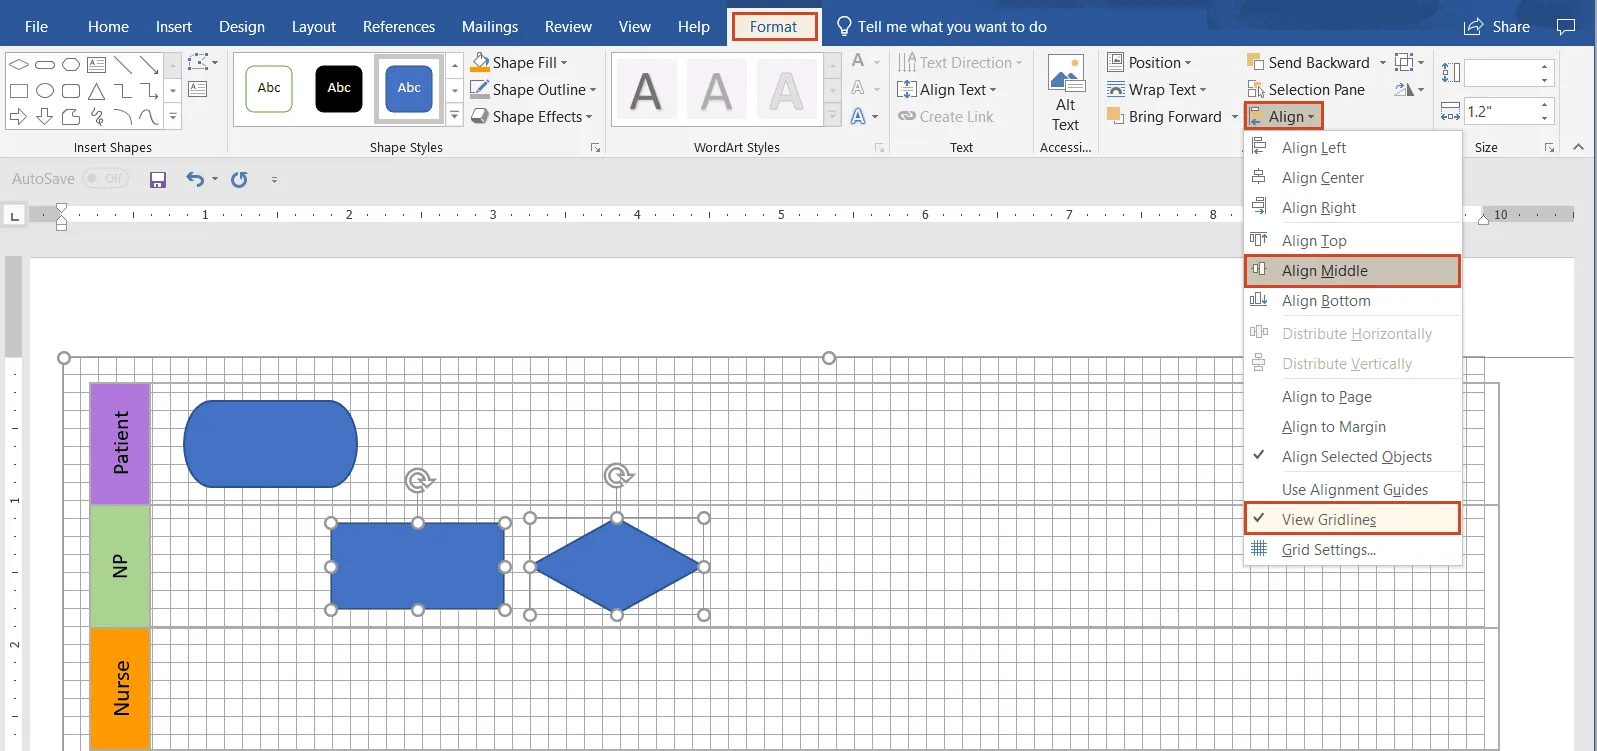
b) To align shapes, go to the Format tab, then Arrange > Align. We selected the shapes within one of our lanes and used the Align Middle option. You might find it useful to also tick View Gridlines from the same menu as it can help you position shapes more accurately. If the view is too crowded, you can always untick the option once you finish positioning the shapes.
c) While still in the Format tab, you can check and adjust shape size, under Format > Size.
d) Insert connectors (arrows). Again, go to Insert > Shapes and select the arrow shape. Draw an arrow from one shape to another and make sure the connecting points turn green, so that the connectors stick to the shapes when you move them around.
5. Customize your swimlane diagram.
a) Customize shapes - In the Format tab, you’ll find the options needed to customize the colors, fonts, and sizes of your flowchart shapes and to better organize the content of your diagram. For an easier and faster customization, you can format multiple shapes simultaneously.
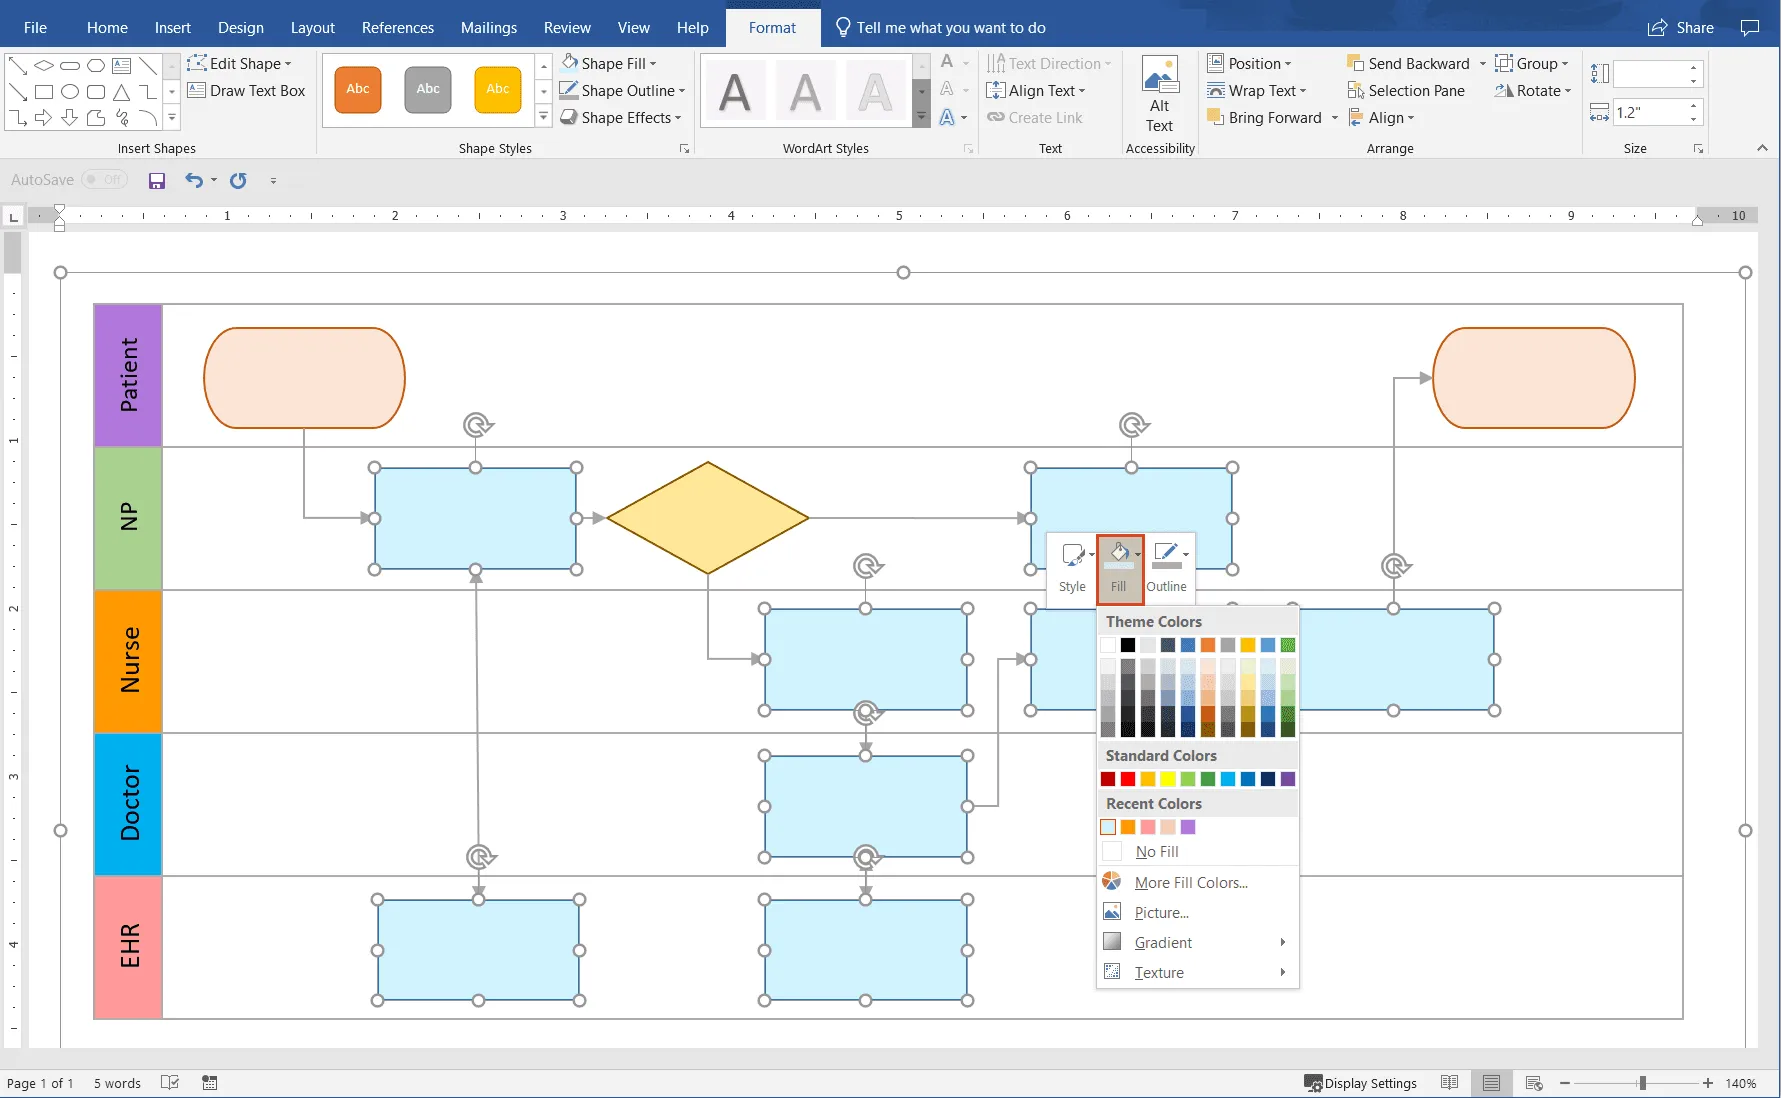
For instance, to apply the same color to several shapes at once, select all the intended items (press and hold CTRL while clicking on each of them), then right-click and select Fill from the menu that opens. While still here, you can change the outline style as well. We chose to color shapes according to their roles (light blue for process steps, light orange for start/end shapes, etc.) to make processes easy-to-track at a glance.
b) Label shapes - To do so, just double-click on any of the shapes and start writing. You can then easily customize the font style, size and/or color by selecting the text to be edited, right-clicking on it and using the font styling options in the menu that appears next.
c) Add text details to shapes - Next to the diamond (decision) shape, add a text box to indicate the possible paths that the process can take. To do this, go to Insert > Text > Text Box > Draw Text Box and place the text box in the vicinity of the diamond shape, as needed. Inside this newly added text box, you should then insert yes/no or true/false to answer the yes/no question or the true/false test that is usually associated with the diamond shape.
If you want to remove the outline and show only the text in your chart, right-click on the text box and go to Format Shape > Line > No line. We also chose to make the text box transparent so that no overlaps occur, should we move the text box around – and for this, we selected Format Shape > Fill > No fill:
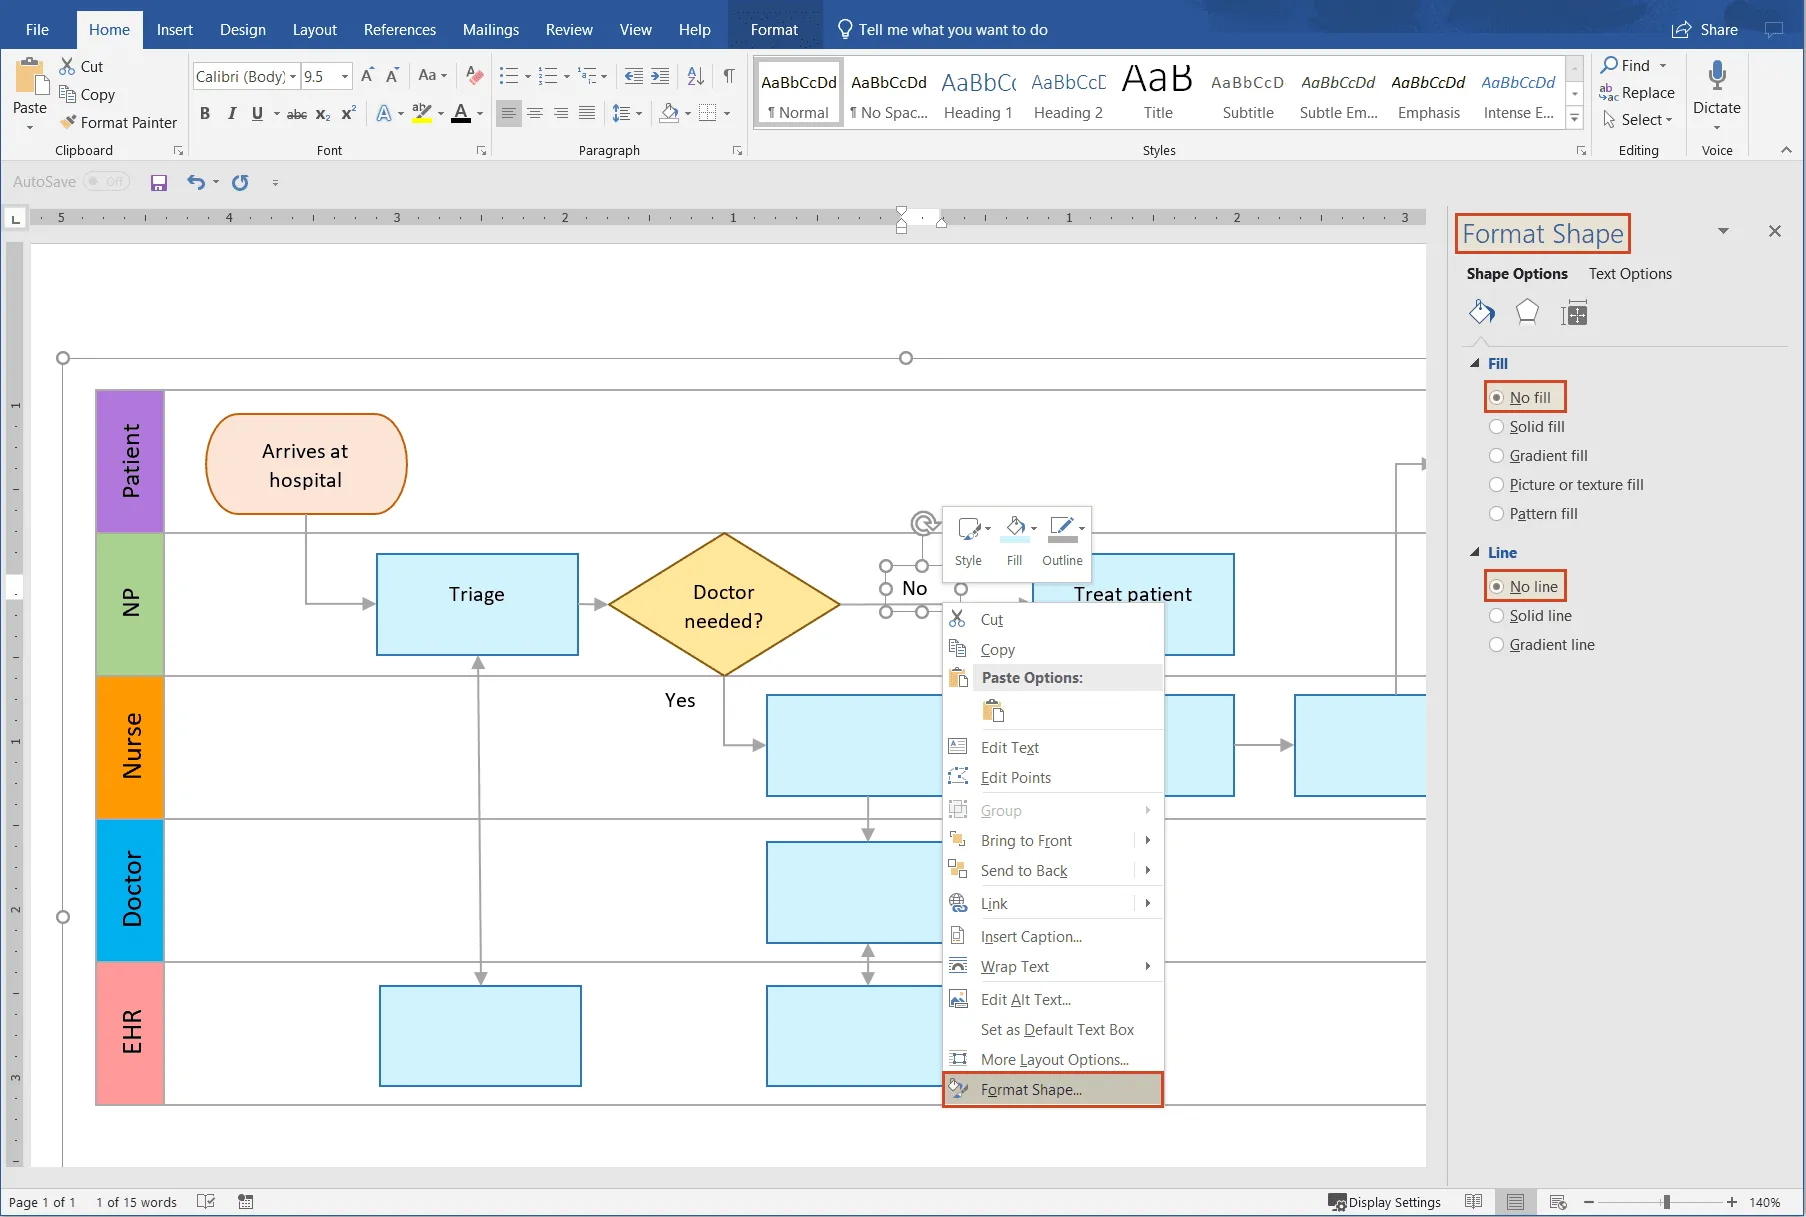
To customize the font (type, size, color), go to Home > Font and update the font options as needed.
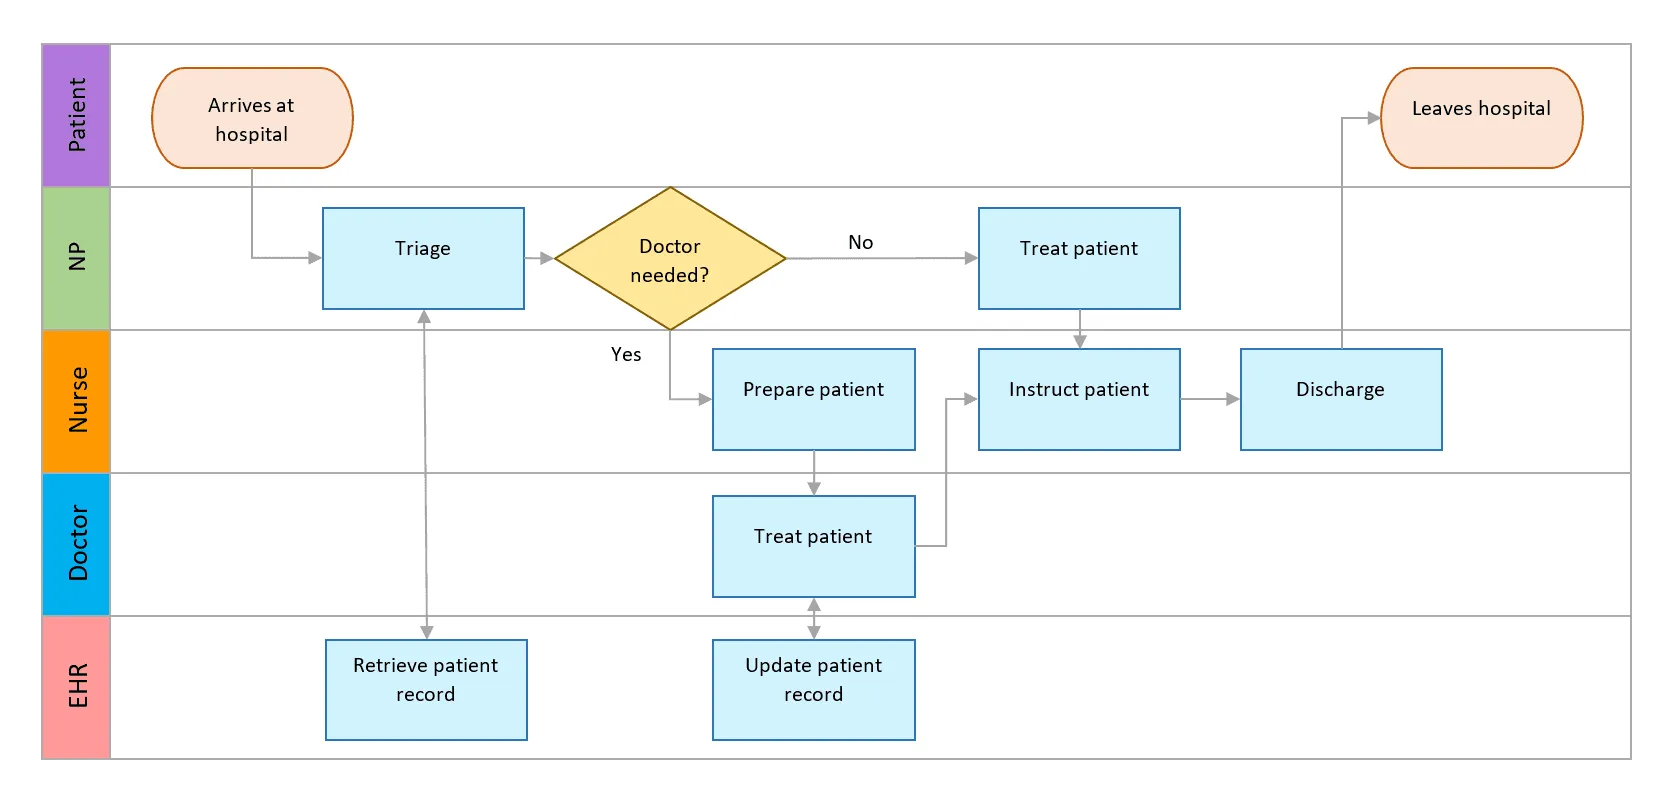
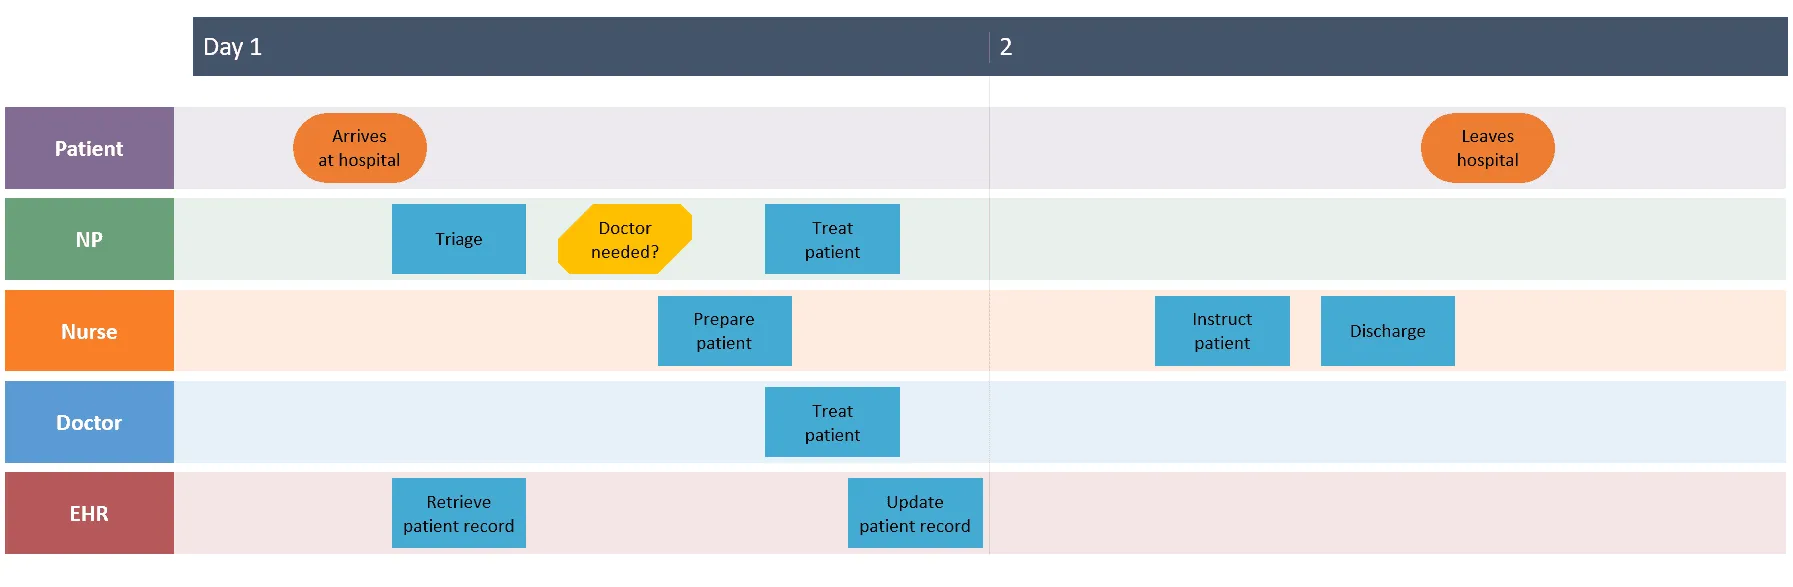
And here is what your MS Word swimlane diagram can look like after all the steps above are completed as described:
Download manual Word swimlane diagram template
If you’d like to use the swimlane diagram created in this guide as a template to help you move faster, you can download the file below, free of charge.
Get this free swimlane diagram template
How to automatically make a swimlane diagram in PowerPoint
Although one of the best-known text editors in the software world, Microsoft Word is not very suitable for data visualization purposes. This becomes obvious when using it to produce visuals as simple as a basic flowchart. To achieve a fairly reasonable output, users often need to put in some painstaking effort to format and style a chart where text boxes may not always match shapes, or connectors won’t behave as expected.
Luckily, there’s another, better way to create clear visuals for your important project meetings. You can save hours of work and get a considerably improved result using a tool like the Office Timeline add-in for PowerPoint.
Offering a variety of ready-made templates that you can choose from, the add-in helps you create professionally-designed swimlane diagrams for executive presentations in a quick and easy manner.
You just pick your preferred sample, make some customizations and you’re good to go. And there’s more: you can add a timeband to your diagram to show when each of the steps of the process should happen.
Below, we will show you how to automatically make a swimlane diagram using the lightweight PowerPoint add-in. First of all, install the free trial of Office Timeline, which will add a separate tab to the PowerPoint ribbon.
1. Select and customize a swimlane template.
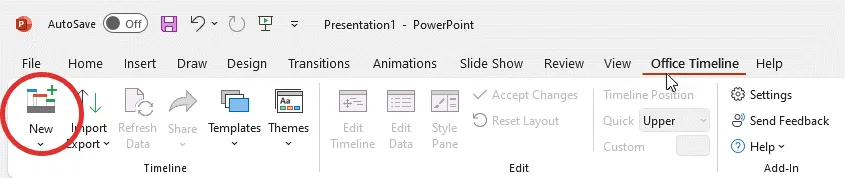
a) In PowerPoint, from the newly added Office Timeline tab on the ribbon, click on New.
A template gallery will open next. Scroll to the Swimlane Templates section and choose a template to use for your swimlane diagram.
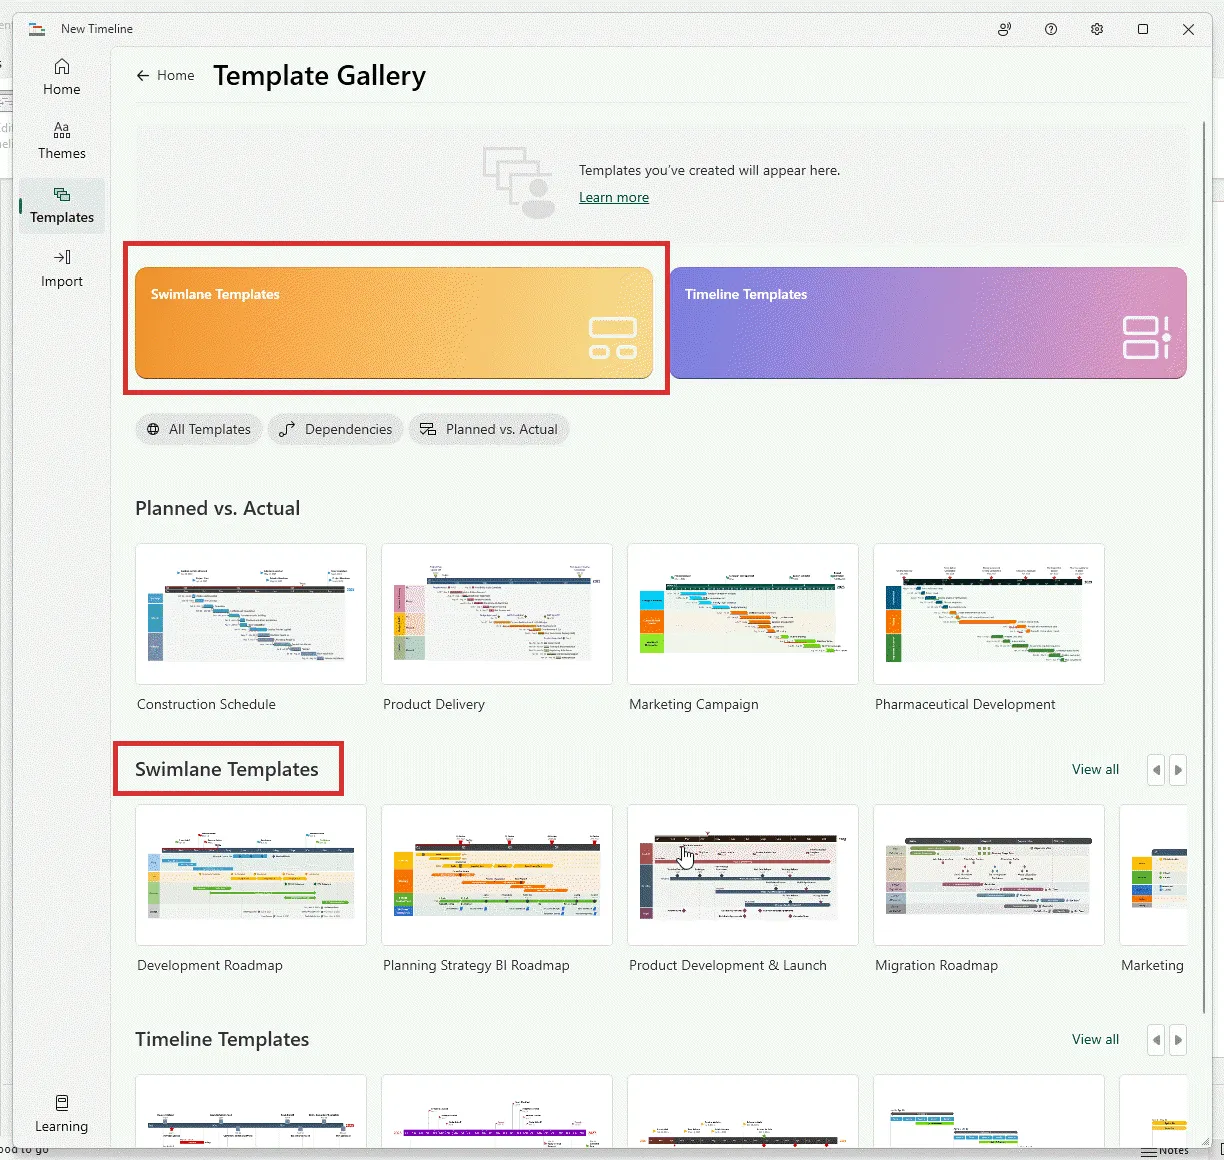
Double-click on the template you like, then click on Create timeline in the preview window. This will open the Edit Data wizard.
b) In the Edit Data wizard, replace the placeholder data with your own. You can do this manually, by going to each item and typing in new data, or you can copy-paste the data from another file. Now it is also a good time to make a few customizations, such as changing tasks/milestones shapes and colors.
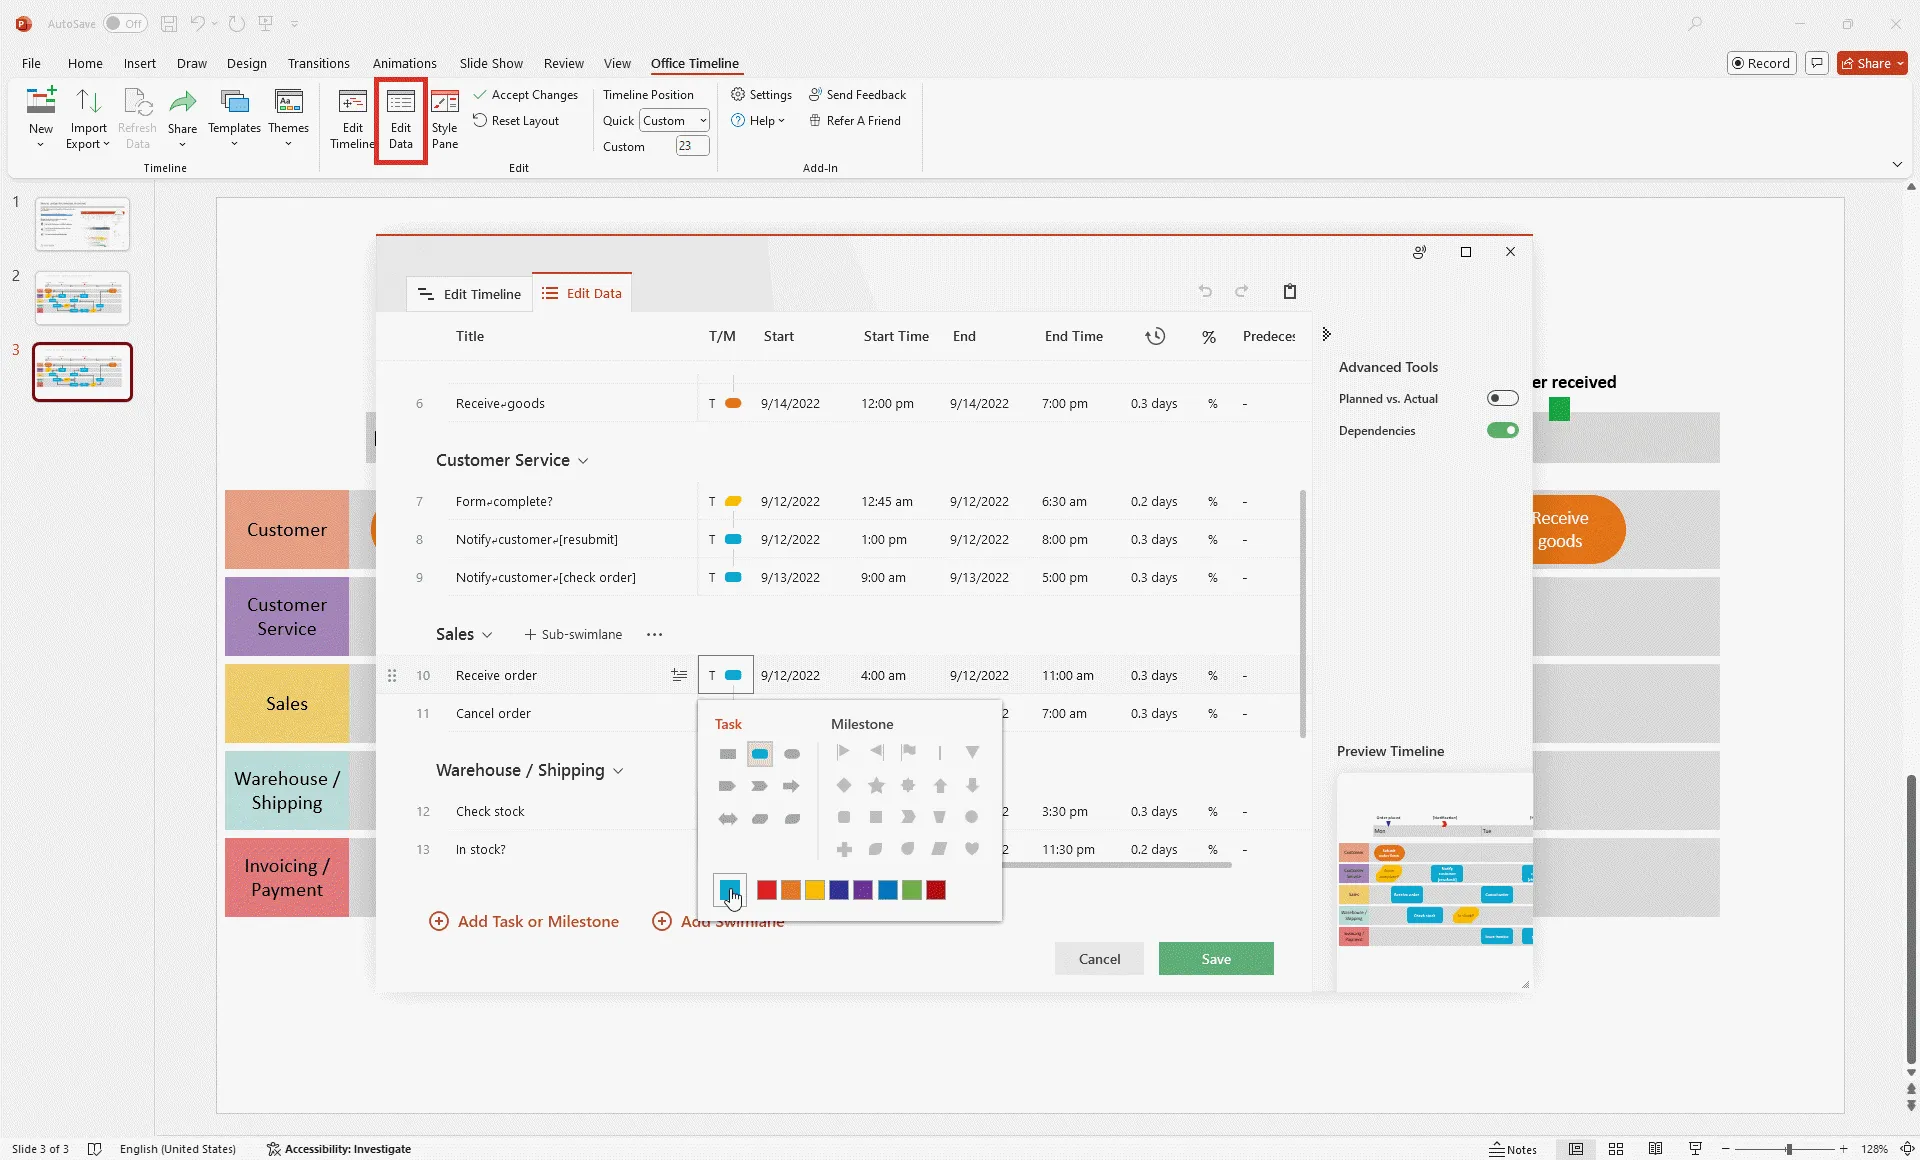
When ready, click the Save button.
A new swimlane diagram slide will be instantly generated in PowerPoint.
One of the perks of creating a cross-functional flowchart with Office Timeline is the timeband that is automatically built in your chart. Not only does this help you illustrate the chronological sequence of your process steps, but you can also add milestones along the timescale to better track and highlight progress.
2. Add connectors.
Now that the process steps are placed in position, let’s add connectors (arrows) to show the direction of the process flow. Just repeat the actions described earlier in this article: go to Insert > Shapes in PowerPoint and choose the arrow type you need. Draw an arrow from one shape to another and make sure that the connectors stick to the shapes (the connecting points should turn green). Thus, they will stay in place when you modify the shapes or move them around. Then, add text boxes near the “Decision” shape.
The newly created swimlane diagram can be easily restyled or updated automatically with Office Timeline whenever necessary.
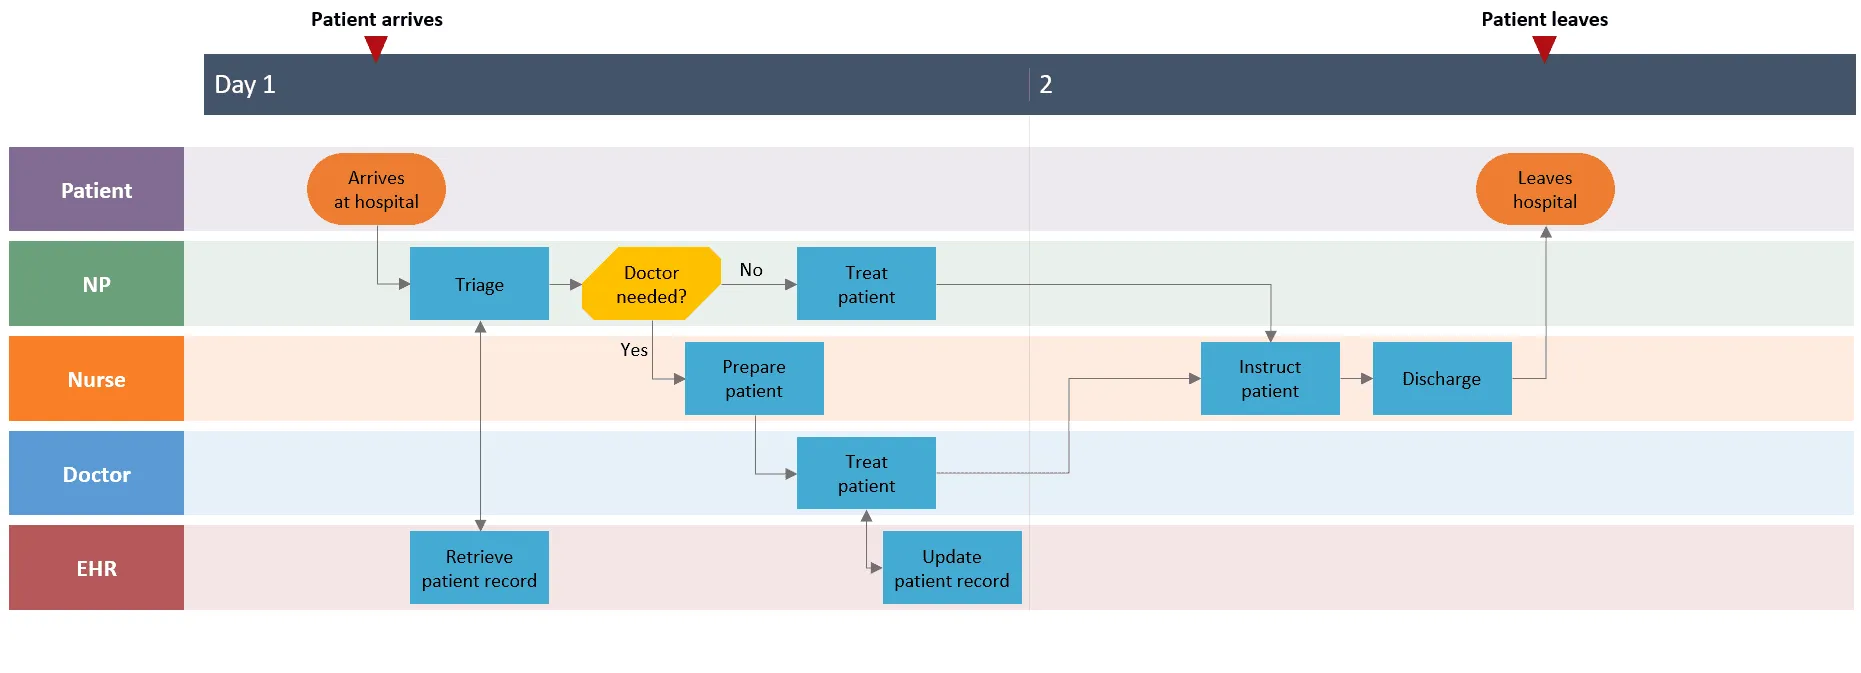
And here’s our downloadable swimlane diagram template after some styling and customization:
Download auto-generated PowerPoint swimlane diagram template
If you’d like to use the swimlane diagram created in this guide as a template to help you move faster, you can download the slide below, free of charge.
Get this free swimlane diagram template
FAQs about making swimlane diagrams in Microsoft Word
Here are some of the most commonly asked questions on how to make swimlane diagrams in Microsoft Word and their answers:
You can create a basic swimlane diagram in Microsoft Word by following the steps below:
- Prepare the document. Open a new Word document and change the orientation of your page to Landscape to have more room to work with. In this step, insert a drawing canvas that will allow you to fully use Word’s drawing capabilities. Go to Insert > Shapes > New Drawing Canvas.
- Create Swimlanes. Go to Insert > Shapes. Add a rectangle for the body of your swimlane, and then a smaller one on top or the left of the first shape (that will be the title of the container). Change the color of the swimlane containers or make them transparent for added clarity - if you want to. Copy and paste the original shape until you have enough swimlanes to complete your diagram.
- Add labels to the swimlanes. Use text boxes from the Insert tab to represent the major participants in your process.
- Build a flowchart. Within each swimlane, add standardized shapes, texts, and connectors to show process steps and how they are related to one another.
- Customize your swimlane diagram. Change the color, font, style, and other aspects of your flowchart shapes after you select the ones you want to highlight.
If you find the process of building a swimlane diagram in Microsoft Word too complicated, you can try a swimlane diagram maker like the Office Timeline add-in for PowerPoint. This tool helps you build project visuals in just a fraction of the time.
Microsoft Word doesn’t feature any built-in swimlane diagram templates. But there are some options to get one: you can either manually build a cross-functional flowchart from scratch using the instructions in this article or take the easy way out - pick and use a PowerPoint template from our free swimlane template collection. Once you customize it with your data, the resulting visual can be easily incorporated in any presentation, including a Microsoft Word document.
If you want to explore even more pre-formatted swimlane templates or build your very own in a matter of minutes, try out the Office Timeline add-in.
