
How to make a timeline in Excel
A timeline is a type of chart which visually shows a series of events in chronological order over a linear timescale. The power of a timeline is that it’s a visual representation, which makes it easy to understand critical milestones in a project and the progress of a project schedule. Timelines are particularly powerful for project scheduling or project management when paired with a Gantt chart, as shown at the end of this tutorial.
Options for making an Excel timeline
Microsoft Excel has a Scatter chart that can be formatted to create a timeline. If you need to create and update a timeline for recurring communications with clients and executives, it would be simpler and faster to create a PowerPoint timeline.
On this page you can see both ways to create a timeline using these popular Microsoft Office tools. We will give you step-by-step instructions for making a timeline in Excel by formatting a Scatter chart. We will also show you how to instantly create an executive timeline in PowerPoint by pasting your project data from Excel.
Which tutorial would you like to see?
How to create an Excel timeline in 7 steps
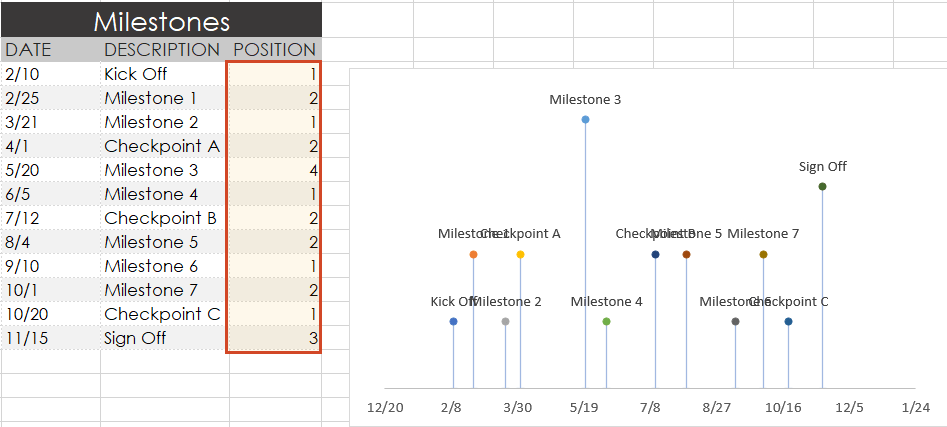
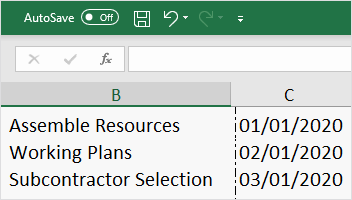
1. List your key events or dates in an Excel table.
-
List out the key events, important decision points or critical deliverables of your project. These will be called Milestones and they will be used to create a timeline.
-
Create a table out of these Milestones and next to each milestone add the due date of that particular milestone.
-
To create a timeline in Excel, you will also need to add another column to your table that includes some plotting numbers. Add the new column next to your milestone description column and list out a repetitive sequence of numbers such as 1, 2, 3, 4 or 5, 10, 15, 20 etc. Excel will use these plotting points to vary the height of each milestone when plotting them on your timeline template.
For this demonstration we’ll format the table in the image below into a Scatter chart and then into an Excel timeline. Then we’ll use it again to make a timeline in PowerPoint.
2. Make a timeline in Excel by setting it up as a Scatter chart.
-
From the timeline worksheet in Excel, click on any blank cell.
-
Then from the Excel ribbon, select the Insert tab and navigate to the Charts section of the ribbon.
-
In the Charts section of the ribbon drop down the Scatter or Bubble Chart menu.
-
Select Scatter which will insert a blank white chart space onto your Excel worksheet.
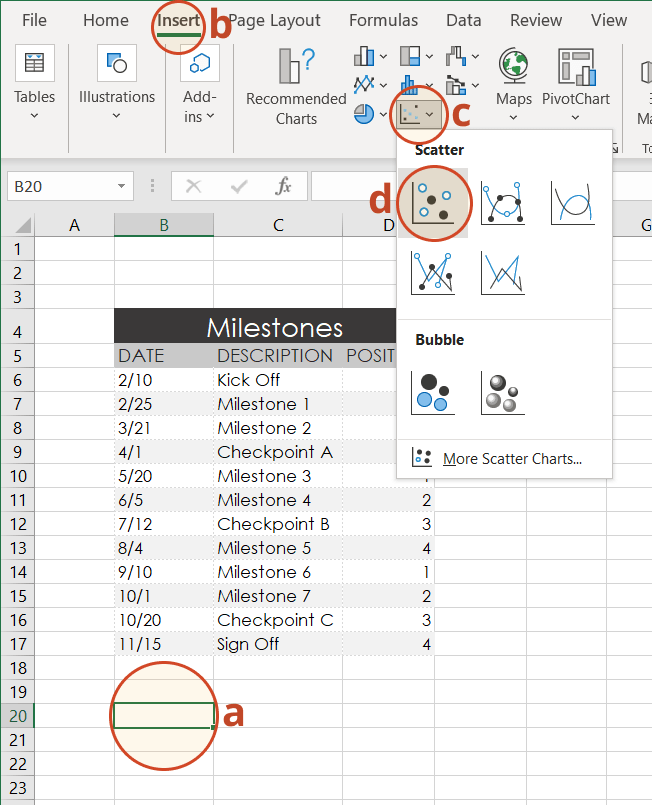
3. Add Milestone data to your timeline.
-
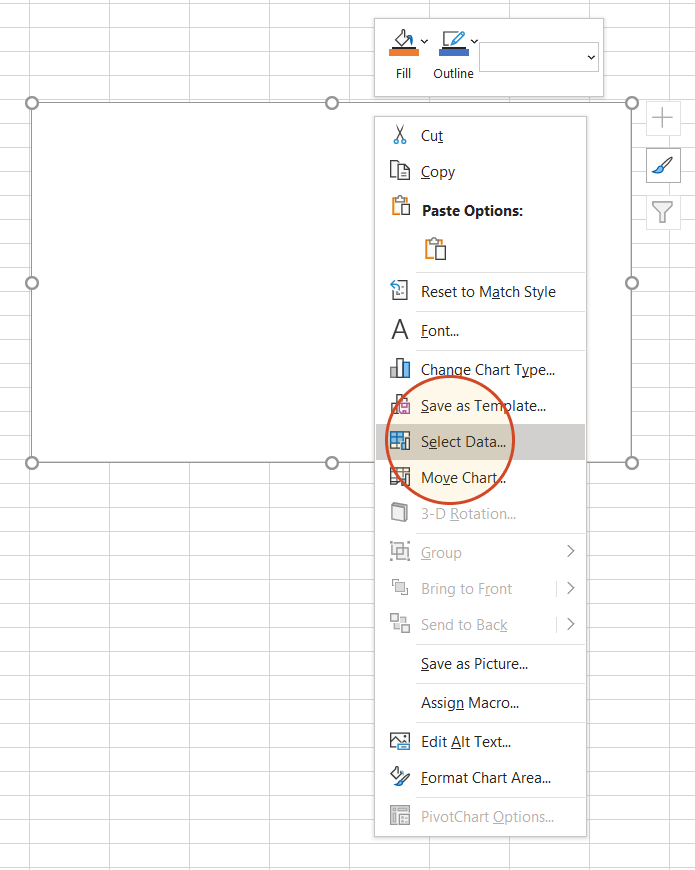
Right-click the blank white chart and click Select Data to bring up Excel's Select Data Source window.
-
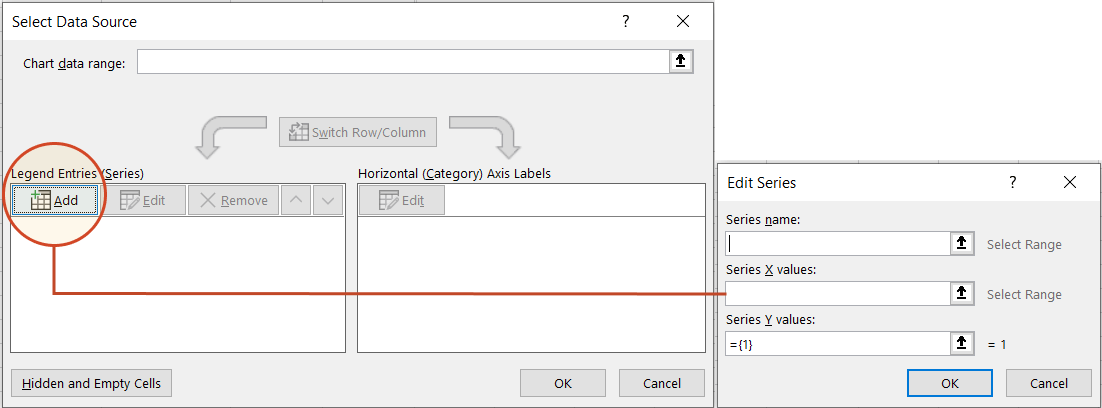
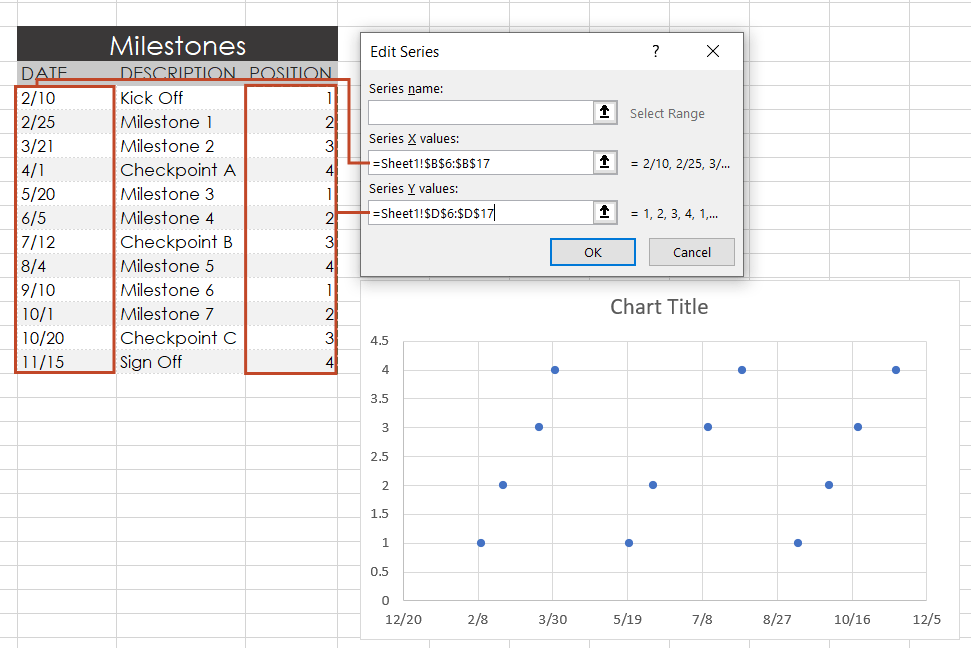
On the left side of Excel's Data Source window, you will see a table named Legend Entries (Series). Click on the Add button to bring up the Edit Series window. Here you add the dates that will make your timeline.
-
We will enter the dates into the field named Series X values . Click in the Series X values window on the arrow button
 . Then select your range by clicking the first date of your timeline (ours is 2/10) and dragging down to the last date (ours is 11/15).
Following the same path, we will enter the plotting numbers series into the field named Series Y values. Click in the Series Y value window and remove the value
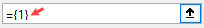 that Excel places in the field by default. Then select your range by clicking on the first plotting number of your timeline (ours is 1) and then dragging down to the last plotting number of your timeline (ours is 4).
-
Click OK and then click OK again to create a scatter chart.
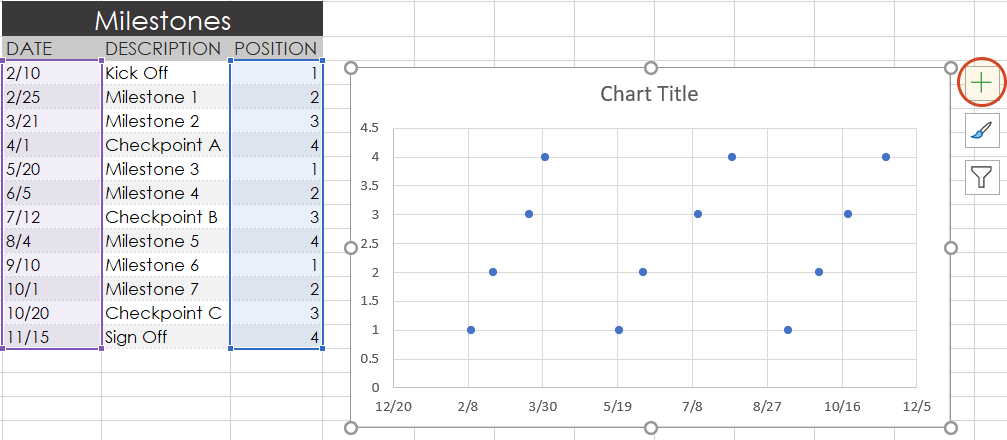
4. Turn your Scatter chart into a timeline.
-
Click on your chart to bring up a set of controls which will be presented to the upper right of your timeline's chart. Click on the Plus button (+) to open the Chart Elements menu.
-
In the timeline's Chart Elements control box, uncheck Gridlines and Chart Title.
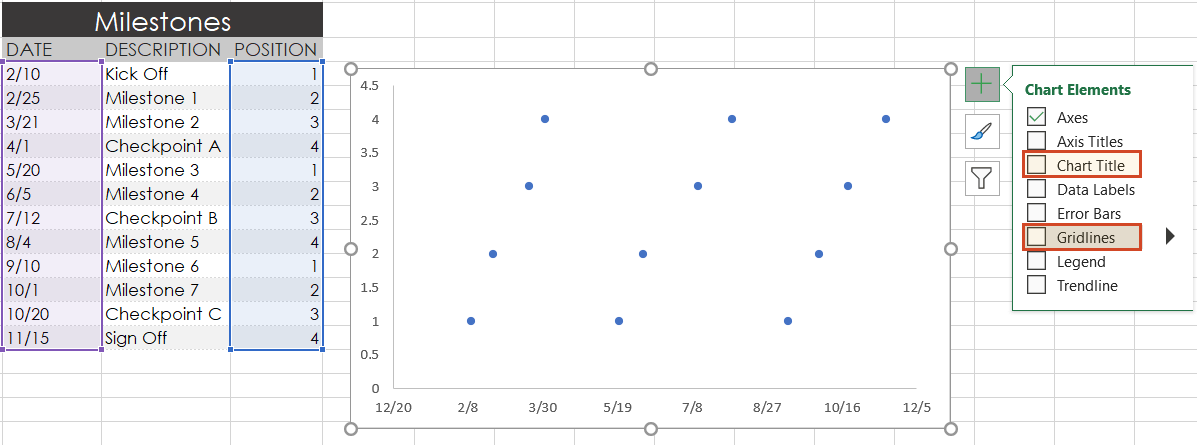
-
Staying in the Charts Elements control box, hover your mouse over the word Axes (but don't uncheck it) to get an expansion arrow just to the right. Click on the expansion arrow to get additional axis options for your chart. Here you should uncheck Primary Vertical but leave Primary Horizontal checked.
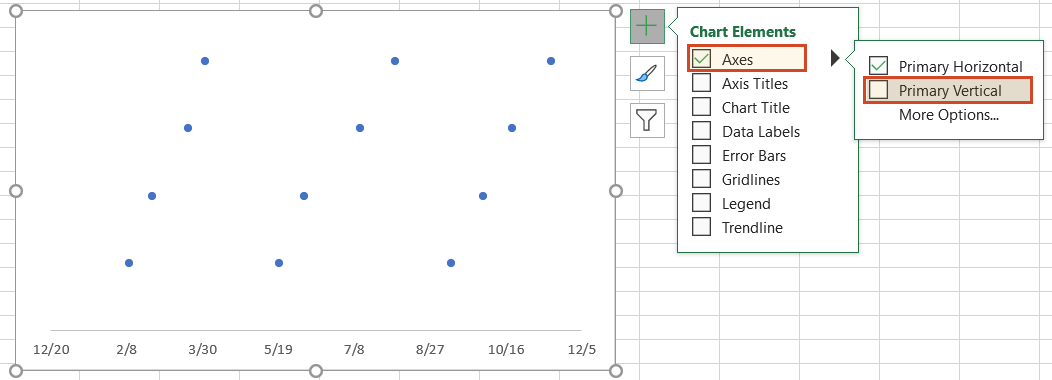
-
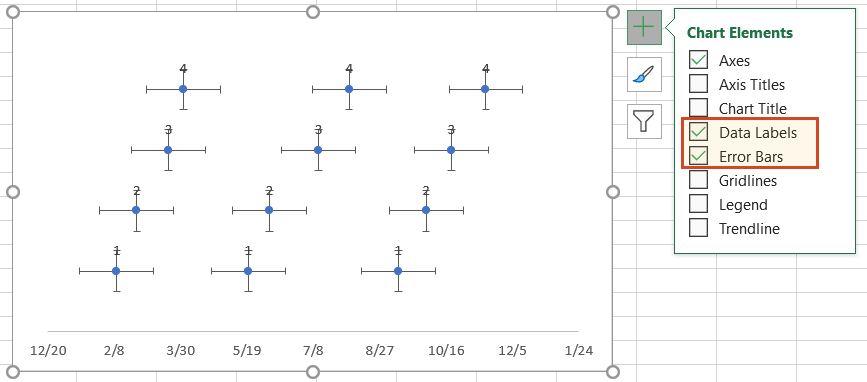
Staying in the Charts Elements control box just a little longer, add Data Labels and Error Bars.
Your timeline chart should now look something like this:
5. Format chart to look like a timeline.
-
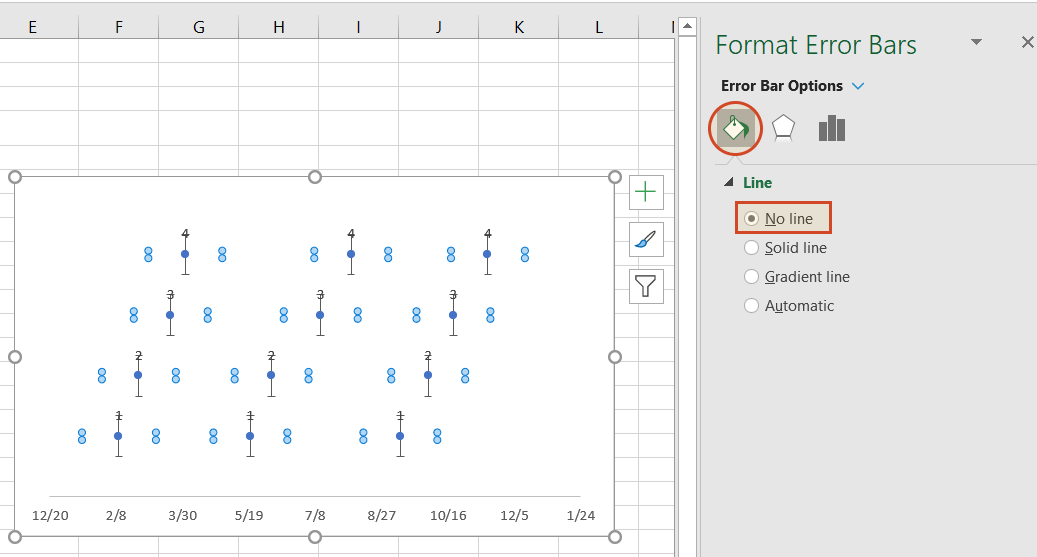
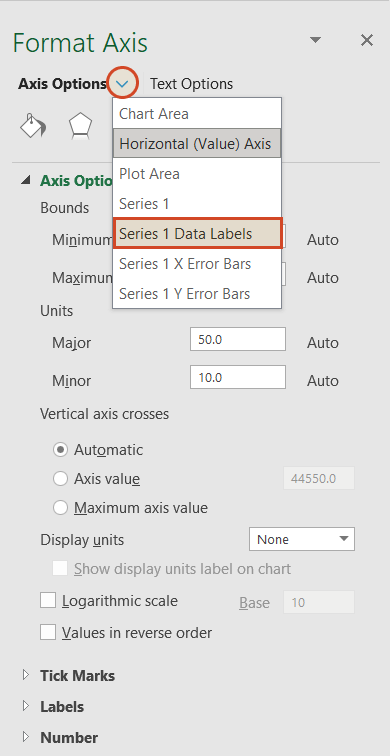
To make a timeline in Excel, we will need to format the Scatter chart by adding connectors from your milestone points. Right-click on any one of the dates at the bottom of your timeline and select Format Axis to bring up Excel's Format Axis menu.
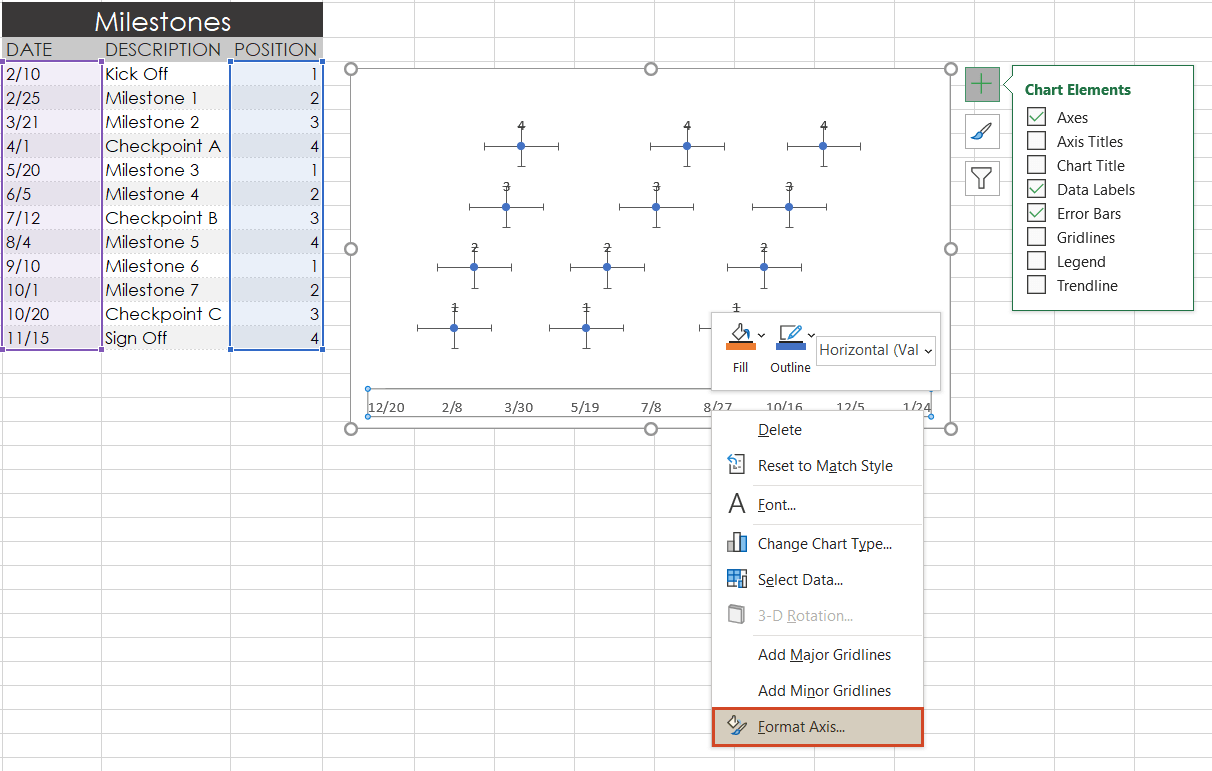
-
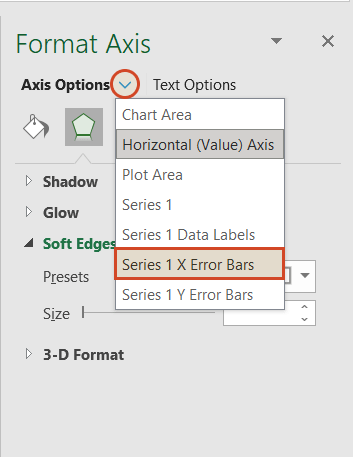
Drop down the arrow next to the title Axis Options and select Series 1 X Error Bars.
-
Under the Error Bar Options menu, click on the paint can icon to reveal the Fill & Line controls. Select No line, which will remove the horizontal lines around each of the plotted milestones on your timeline.
-
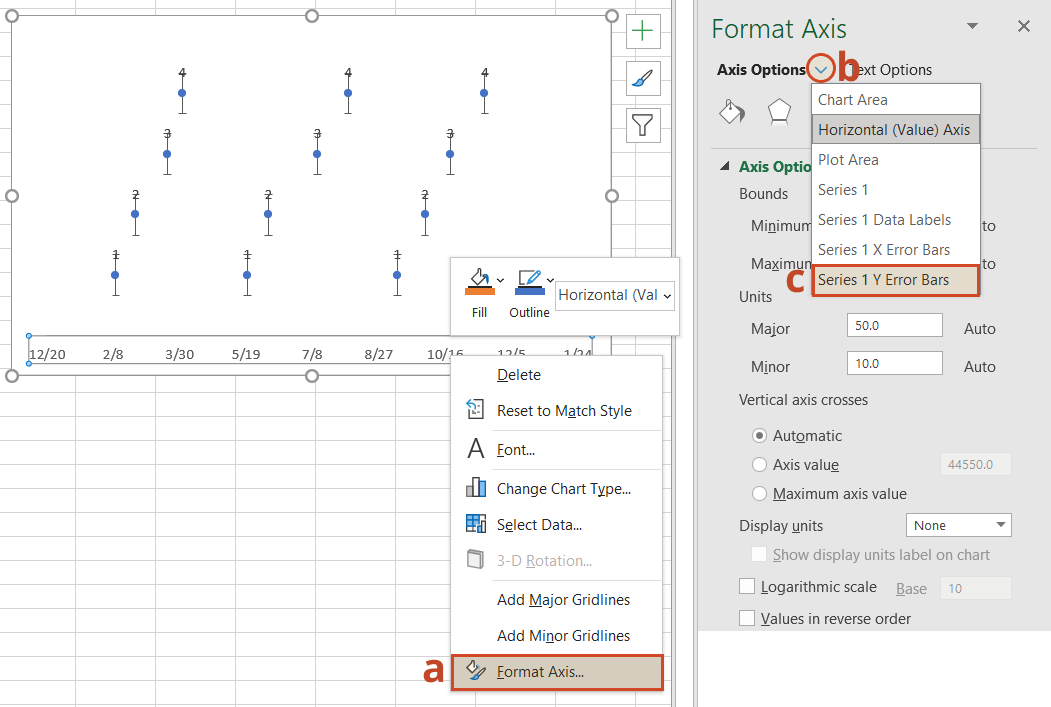
In a similar process, we will also adjust your timeline's Y axis. Again, from the timeline, right-click on any one of your timeline's dates at the bottom of the chart and select Format Axis. Drop down the arrow next to the title Axis Options and select Series 1 Y Error Bars.
-
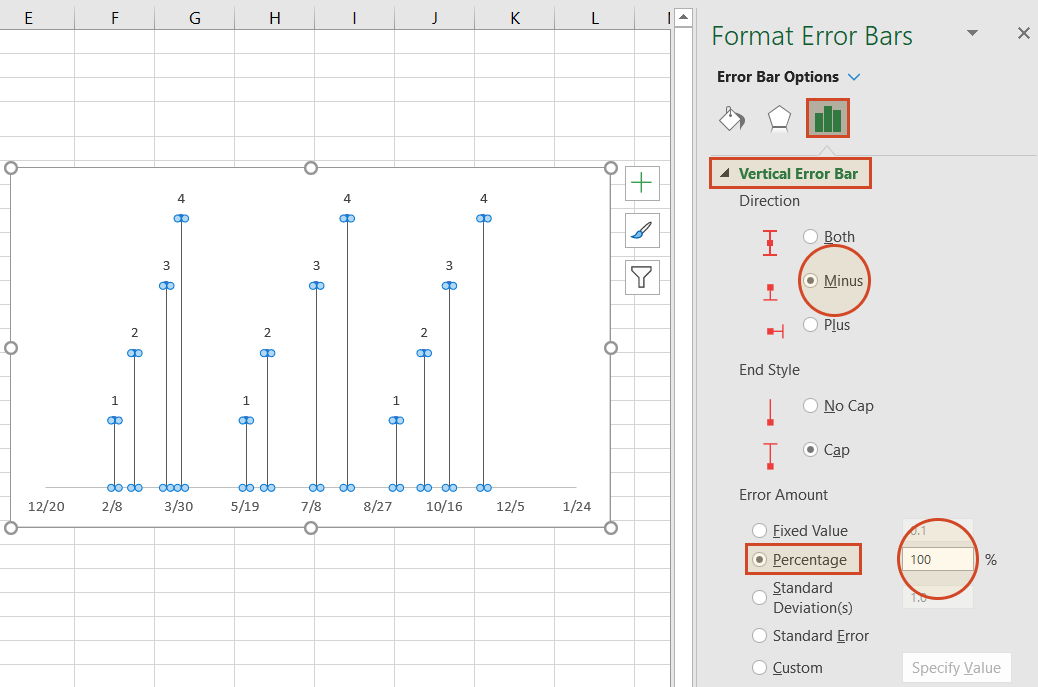
Right-clicking on any bar in the chart will open the Format Error Bars menu. From the Vertical Error Bar, set the direction to Minus. Then set the Error Amount to Percentage, and type in 100%. This will create connectors from your timeline's milestones to their respective points on your timeband.
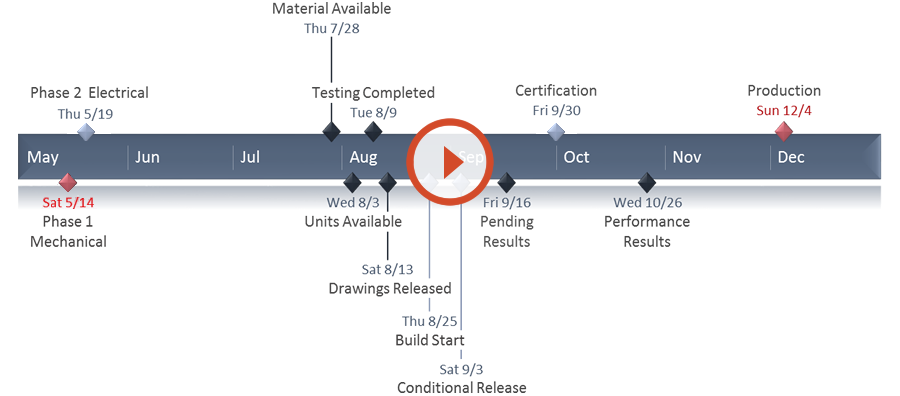
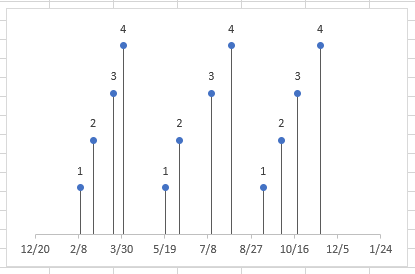
Your Excel timeline should now look something like the picture below.
6. Add titles to your timeline's milestones.
You have built a Scatter chart as an Excel timeline. Now we will format it into a proper timeline.
-
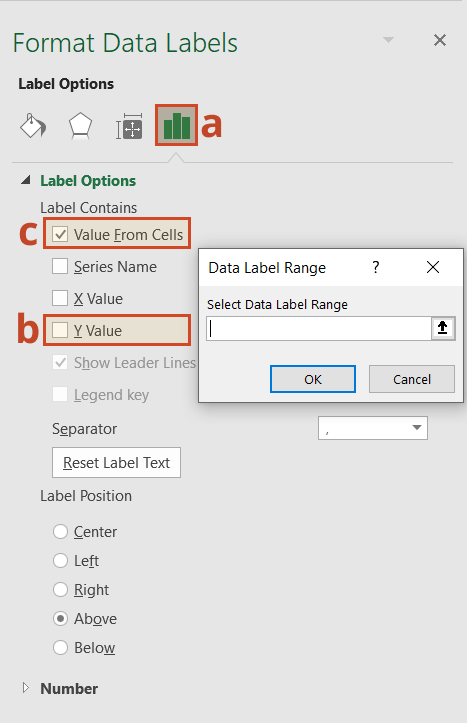
To finish making your timeline, we will add the milestone descriptions. Staying in the Format Axis menu, again drop down the menu arrow next to the title Axis Options. This time choose select Series 1 Data Labels to bring up the Format Data Labels menu.
-
Click the Label Options icon. Uncheck Y Value, and then put a check next to Value From Cells. This will bring up an Excel data entry window called Data Label Range.
-
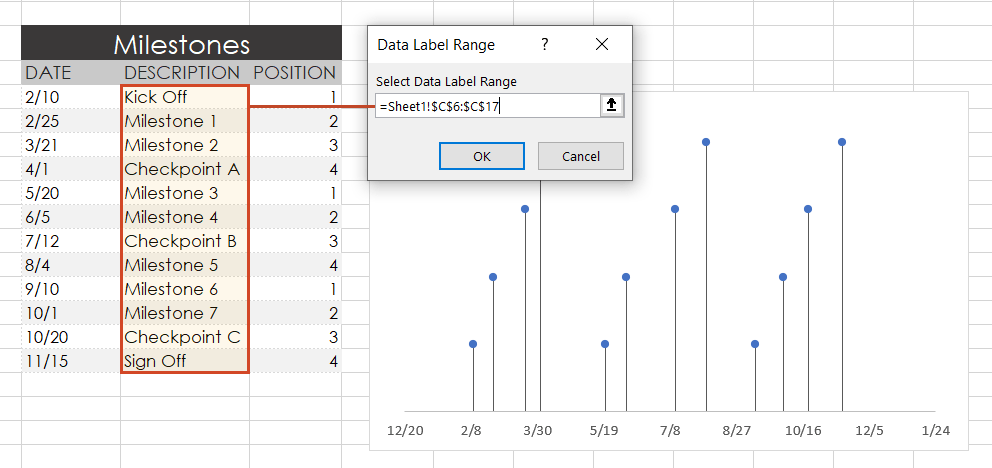
In the Select Data Label Range window, you will enter your timeline's milestone descriptions from the timeline table you built in step 1. To do this simply click on the description for the first milestone in your timeline table, (ours is Kick Off), then drag down to the last milestone in your timeline (ours is Sign Off). Click OK.
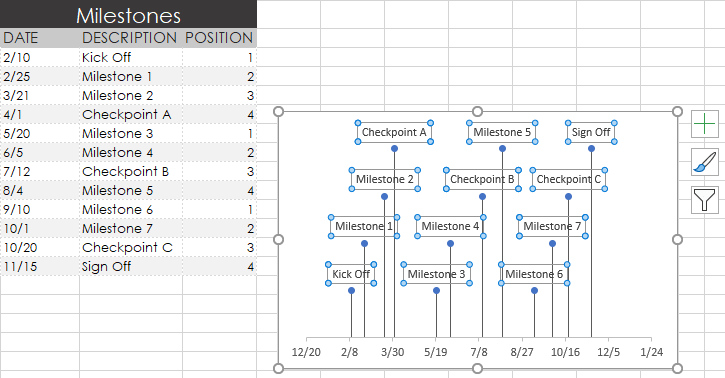
Your Excel timeline template should finally look more like this now:
7. Styling options for your timeline.
Now you can apply some styling choices to improve the aspect of your timeline.
-
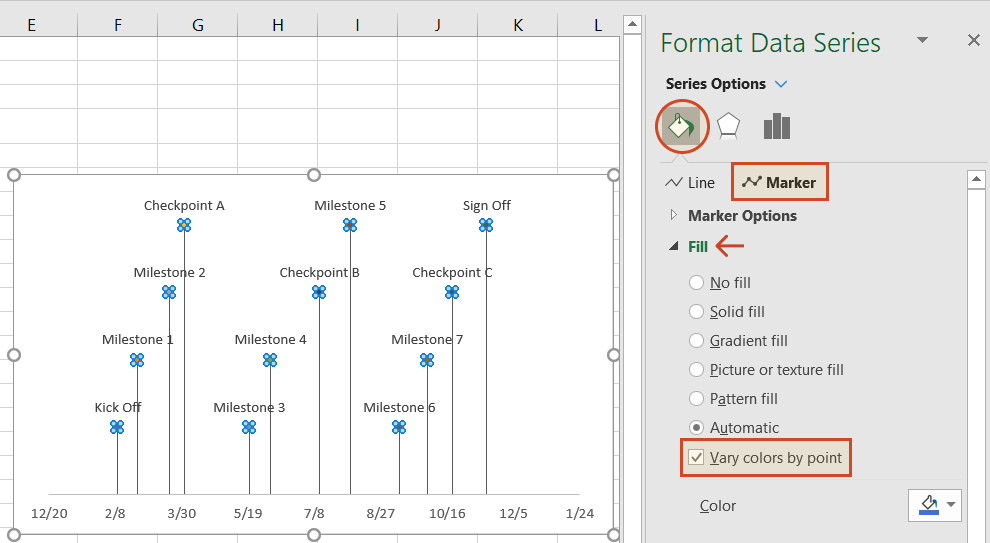
Coloring your timeline's milestone markers.
From your timeline, right-click on any of the milestone points (caps) and select Format Data Series to bring up the Series Options menu.
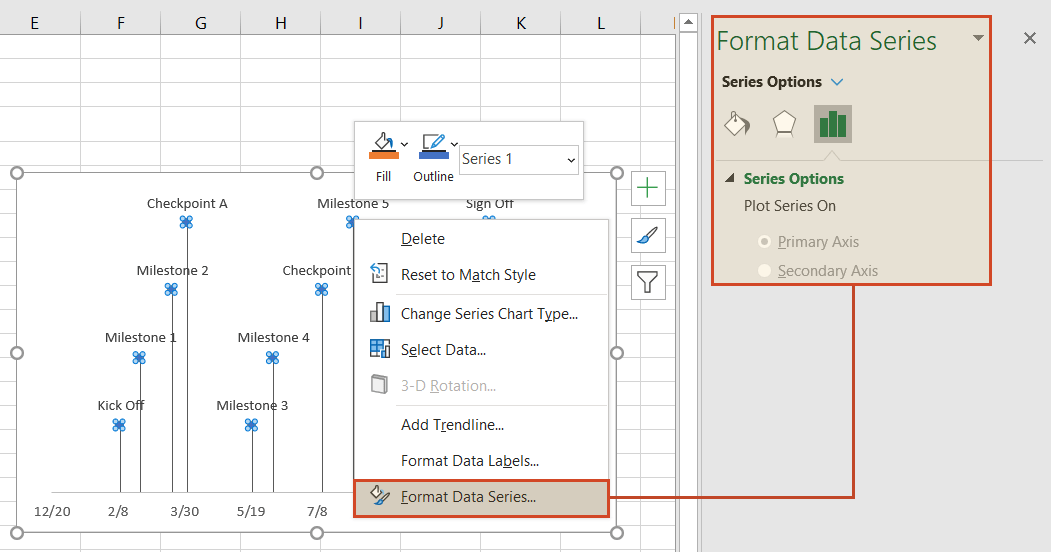
Select the paint can icon for Fill & Line options and, then choose the tab for Marker. You may also need to select Fill to reveal its menu. Then you can choose coloring options for your timeline's milestone markers. In our example, we selected Vary colors by point, which lets Excel pick the milestone colors for our timeline.
-
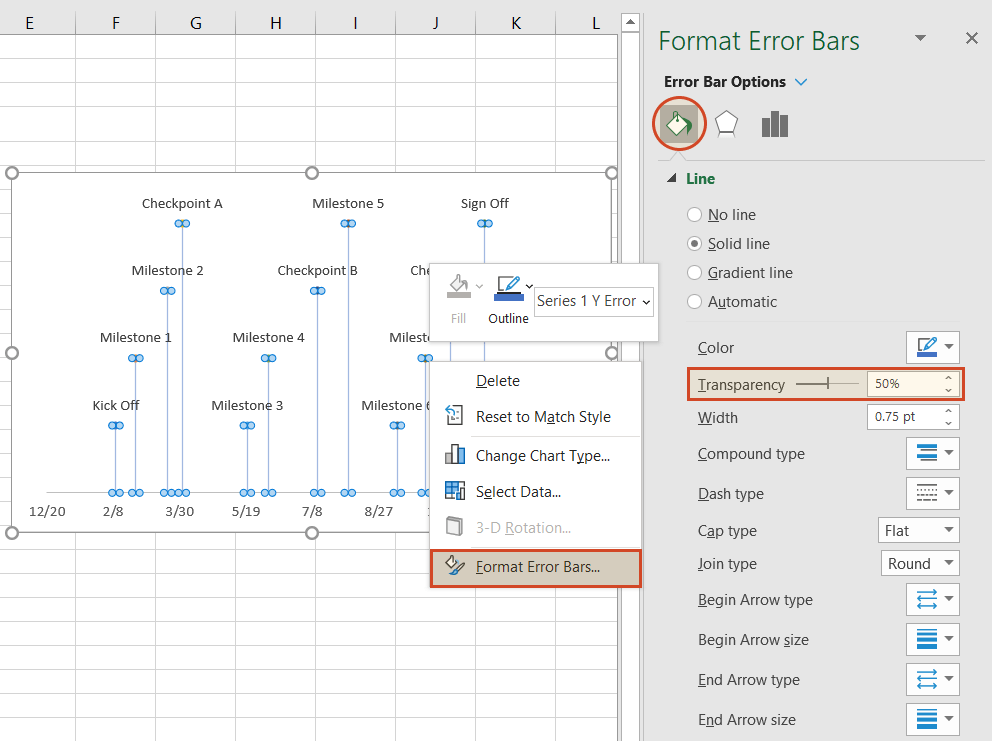
Change the vertical connector's transparency.
On your timeline, right-click on any of the vertical connectors that connect your milestones with the timeband below. Select Format Error Bars to bring up the Vertical Error Bar menu. Again, select the paint can icon to choose Excel's Line & Fill options. Here you can make formatting adjustments (color, size, style, etc.) to your timeline's connector lines. In our example we set the transparency of the lines to 50%.
-
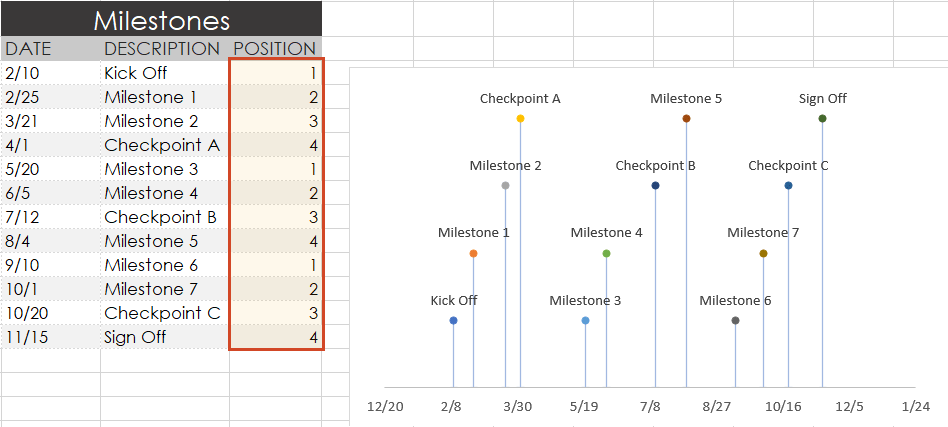
Vary the height of each milestone so their descriptions are not overlapping the neighboring milestone.
Remember the repeated sequence of numbers you added to your timeline table in step 1. Well, those set the height of each milestone on your timeline. By adjusting these numbers, you can play around with different height positions for each milestone. For example, to optimize our timeline, we used the number sequence, 1, 2, 3, 4, 1, 2, 3, 4.
Look how the descriptions would overlap if we changed the order (Don’t try this at home! 😊):
-
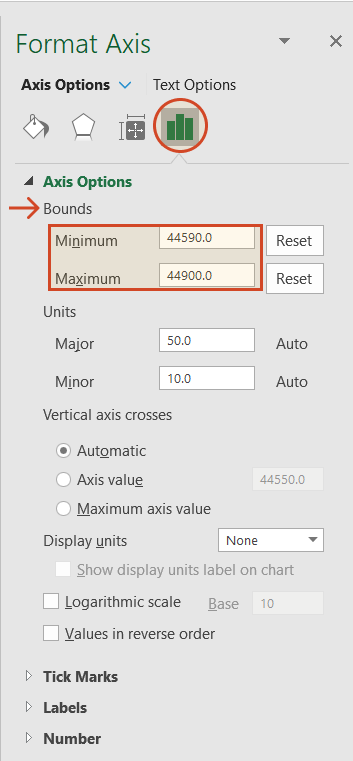
Trim off the empty space to the left or right of your Excel timeline by adjusting its minimum and maximum bounds.
Again right-click on any of the dates below your timeband. Select Format Axis.
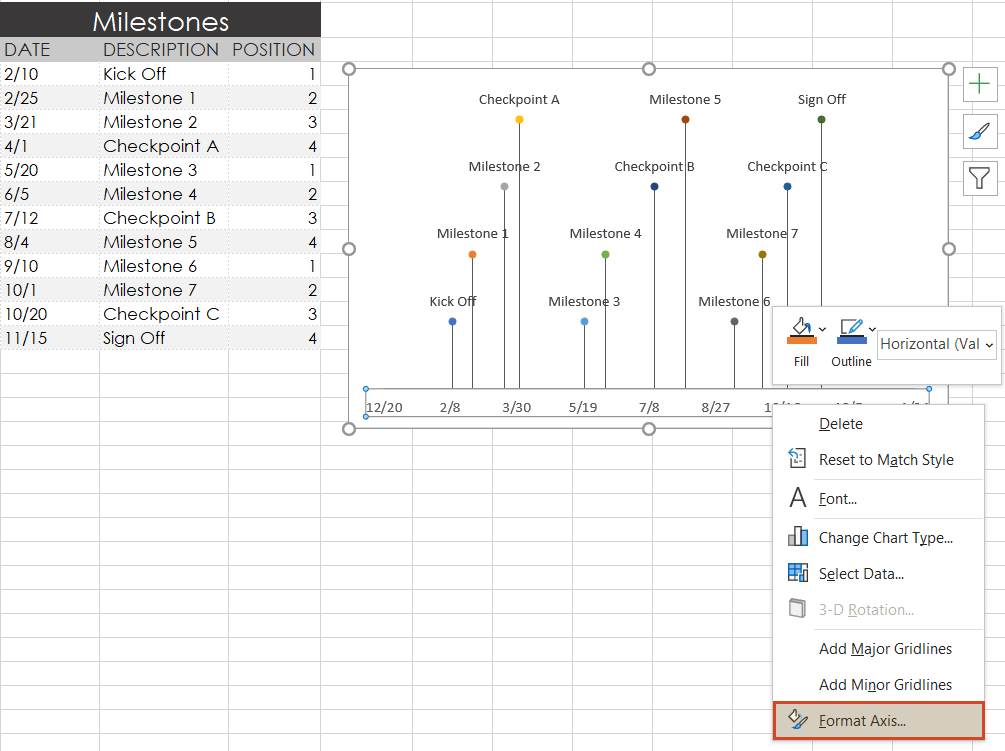
Under the heading Bounds, adjusting the Minimum number upward will move your first milestone left on your timeline, closer to the vertical Axis. Likewise, adjusting the Maximum number down will move your last milestone right on your timeline, closer to the right edge of your chart.
-
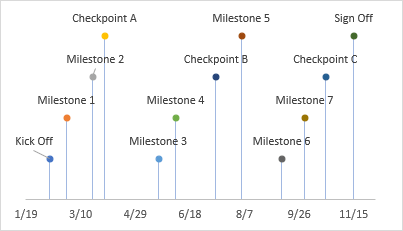
Finished! Our timeline now looks like this:
To help you get started quickly, we have included a practical Excel template that you can download for free and learn how to create timelines in Excel.
FAQs about timelines in Excel
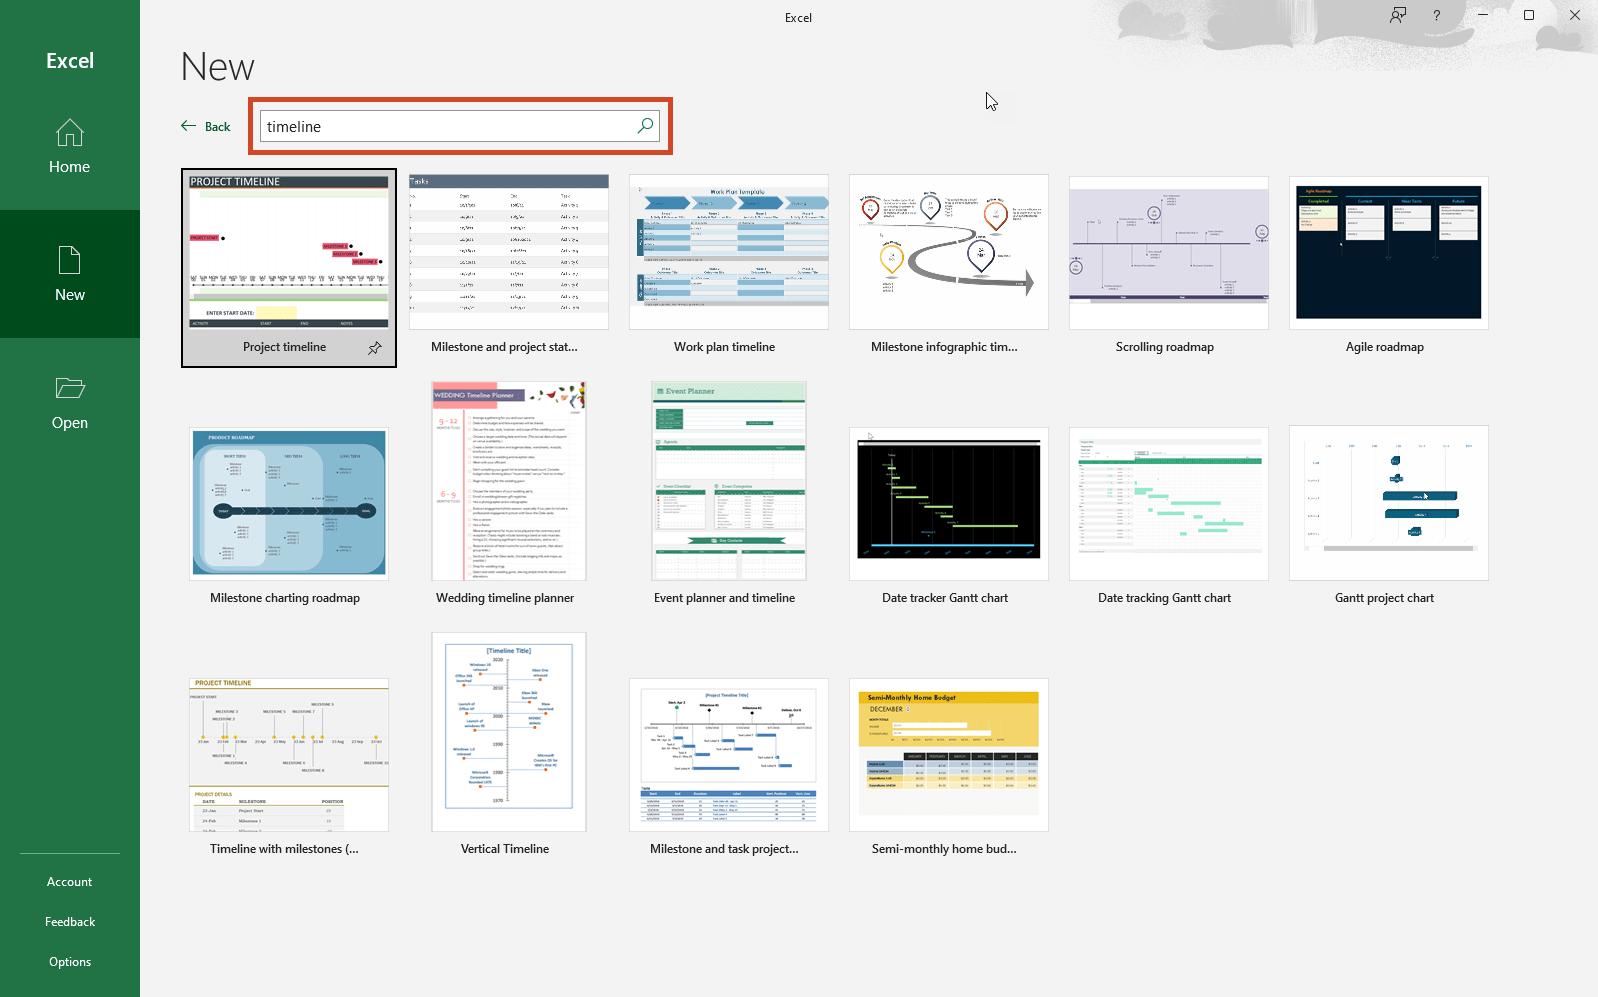
Is there a timeline template in Excel?
Yes, Microsoft Excel offers a few templates that you can customize to create various types of timelines. To explore them, go to File > New and check the template preview list. If you cannot find what you need, type “timeline” in the Search for online templates box to refine the search and further filter the available options.
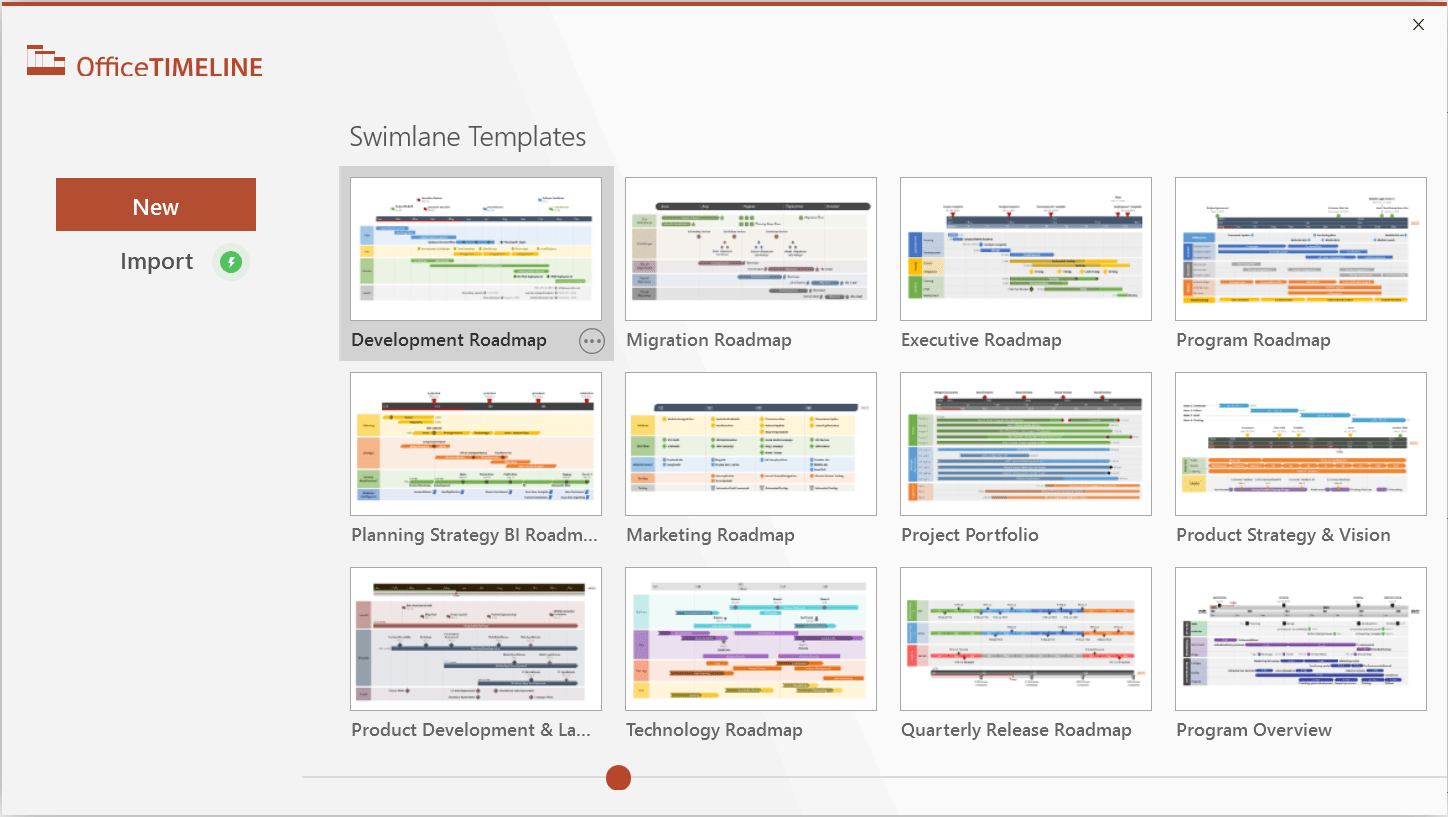
If you’re not happy with the limitations of the standard timeline templates in Excel, have a look at the library of professional timeline templates created with our PowerPoint add-in called Office Timeline, an automated timeline maker that you can use to make timelines with your Excel data and that offers a free trial of its premium edition. Here is a preview of the templates you’ll find:
How do you create a timeline in Excel?
Here are three ways to make a timeline in Microsoft Excel:
1. Insert a chart and turn it into a timeline. Find out how to do this in our step-by-step tutorial on how to make a timeline in Excel.
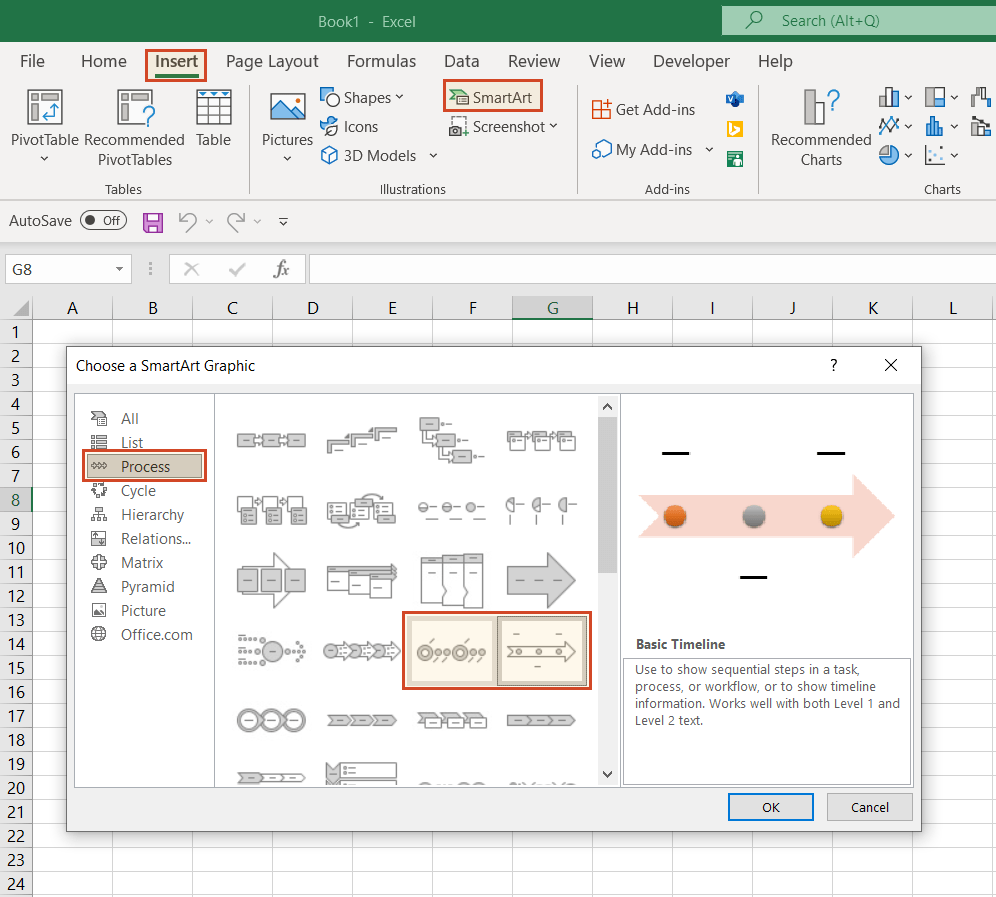
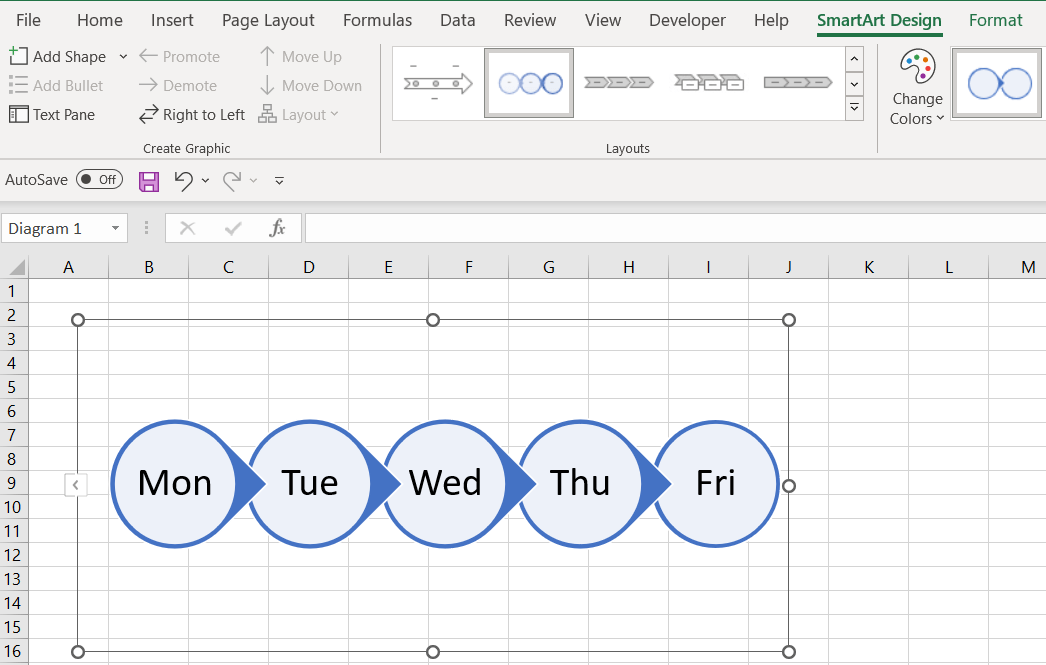
2. Build a timeline with SmartArt. These are the quick steps to make a timeline with SmartArt:
-
In your Excel file, go to Insert > Illustrations > SmartArt.
-
In the Choose a SmartArt Graphic dialog box, select Process, pick a layout, then click OK.
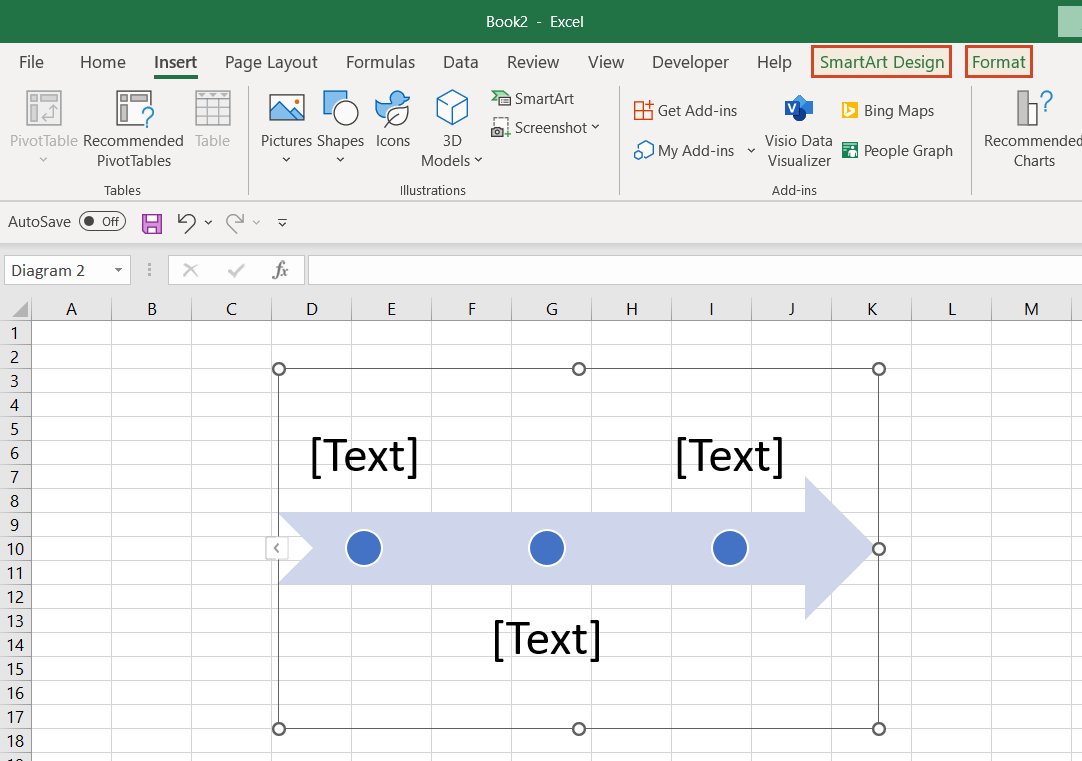
-
On your SmartArt graphic, click [Text] to edit and add data.
-
Add items to your timeline by right-clicking on a shape, then Add Shape > Add Shape After/Before.
-
Customize your timeline. After you create the timeline, you can style it further, add or move dates, change styles, layouts, or colors by using the options in the SmartArt Design and Format tabs that show on the menu ribbon when you select the SmartArt graphic.
Note: Be aware that the SmartArt Design and SmartArt Format tabs are contextual tabs. This means that they are not visible all the time. They only show when you select a particular object which can be edited using special options.
Tip: This solution also works with Microsoft Word, PowerPoint, and Outlook. For more detailed instructions, check out any tutorial in our series on how to make a timeline in Excel.
3. Use a free, fast, automated timeline making tool.
Since the manual methods require considerable time and customization efforts, we suggest an easier, automated way, good for complex timelines that you can use with your Excel data. This method requires downloading a free, specialized timeline maker: the Office Timeline PowerPoint add-in.
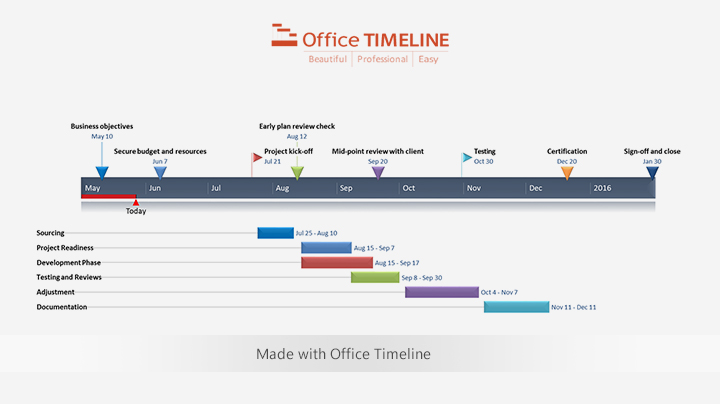
This is a time-saving solution, offering a variety of pre-built templates to choose from. You just pick your template, copy-paste or import your Excel data and quickly generate beautiful timelines. The timelines are presentation-ready PowerPoint slides that can be saved as images, so you can easily include them in Microsoft Excel or other Microsoft Office files. Depending on the template that you choose, your timeline could look like this:
Can you make a timeline in Excel?
Yes, there are several ways to make a timeline in Excel:
With SmartArt:
-
Go to Insert > Illustrations > SmartArt.
-
In the Choose a SmartArt Graphic window, select Process on the left and pick one of the timeline layouts.
-
On the SmartArt graphic, click [Text] to edit and add your data.
With Charts:
-
Organize your data in an Excel table.
-
Go to Insert > Charts.
-
Select Scatter.
-
Format and style chart into a timeline. To do this, follow the steps described in our article.
Complexity: HARD | Time: HOURS | Results: MEDIUM
With Office Timeline:
-
Open Office Timeline and select your preferred template.
-
Copy-paste data from Excel into the Office Timeline wizard. Or just type in your data.
-
After light customization, your timeline is ready to be used in PowerPoint presentations or, as an image, with any MS Office tools.
Complexity: EASY | Time: MINUTES | Results: GREAT
How do I make a simple timeline in Excel?
Here’s how you can build a simple timeline in Excel:
-
Go to the Insert tab on the Excel ribbon, select Smart Art from the Illustrations section.
-
In the Choose a SmartArt Graphic window that opens next, go to the Process option, select one of the timeline layouts, and then click OK.
-
Customize your timeline: enter text (click on shape to type), change layout, styles and colors or add items in the SmartArt Design tab on the ribbon.
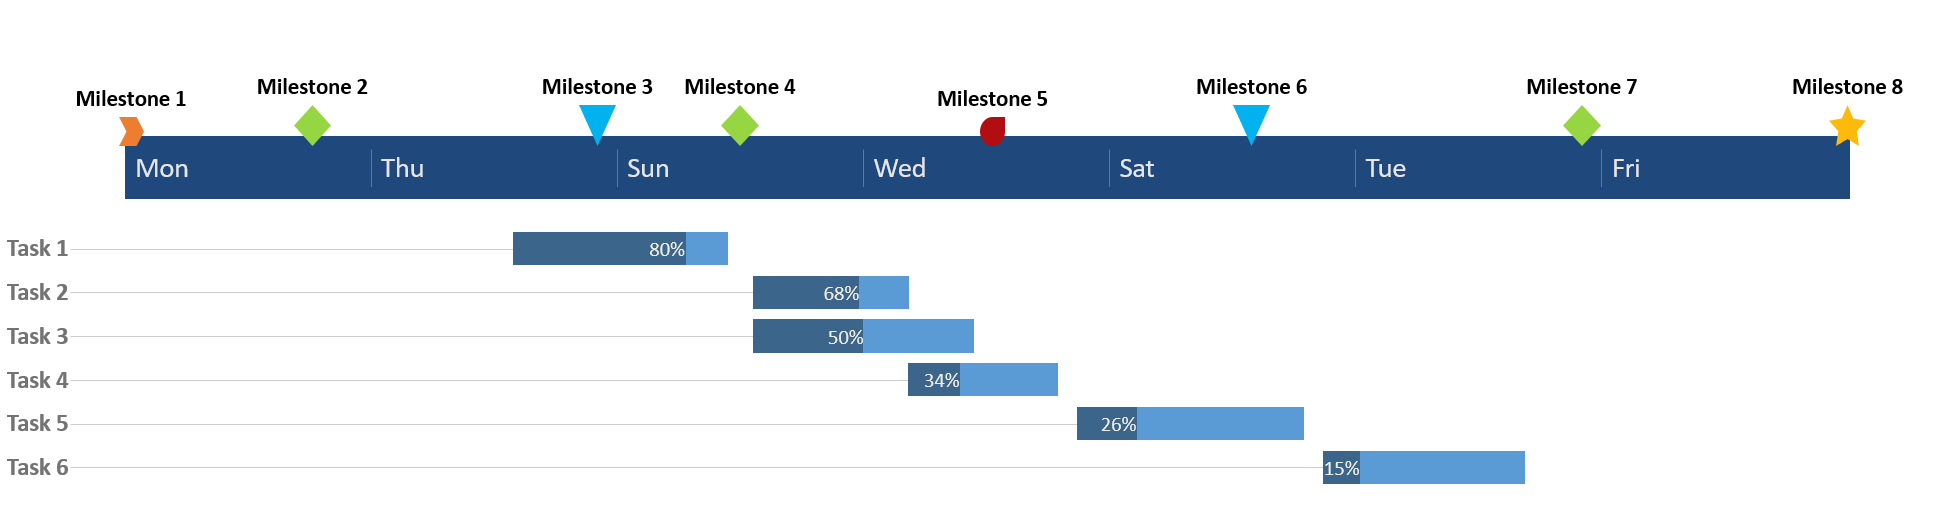
We suggest an easier, more professional way to build simple, yet better-looking timelines using your Excel data: quickly generate the timeline in PowerPoint using our handy add-in called Office Timeline. With this automated tool, you can copy-paste your data from Excel to PowerPoint through its intuitive data entry wizard. Once you’ve entered your project information, Office Timeline will automatically process and turn it into a stylish timeline that you can then include in Excel spreadsheets and Word documents or use as a stand-alone PowerPoint slide. Here is how your timeline could look like:
How do I make a timeline chart in Excel?
You can make a timeline chart in Excel by manually formatting a basic Scatter chart. You should know that the amount of customization and editing work needed to transform the initial chart into an actual timeline-looking visual might prove tedious and challenging. However, simple timeline charts can be created in Excel by following these basic steps:
-
Organize your data in a table in Excel. In a three-column table, enter your key events, due dates and assigned plotting number for each of the listed events.
-
Insert a Scatter chart to your Excel spreadsheet. Go to Insert > Chart and select the Scatter option.
-
Add table data to your Scatter chart.
-
Customize the chart to turn it into a timeline. Find out detailed instructions in our step-by-step tutorial on creating a timeline from a Scatter chart in Excel.
A faster, easier way is to make your timeline chart in PowerPoint and then insert it into your Excel file as an image or object. For stylish visuals with minimum effort, our suggestion is to use a professional tool such as Office Timeline. The free trial of its premium edition, Office Timeline Pro+, includes templates like these, that you can use to generate timelines from your Excel data:
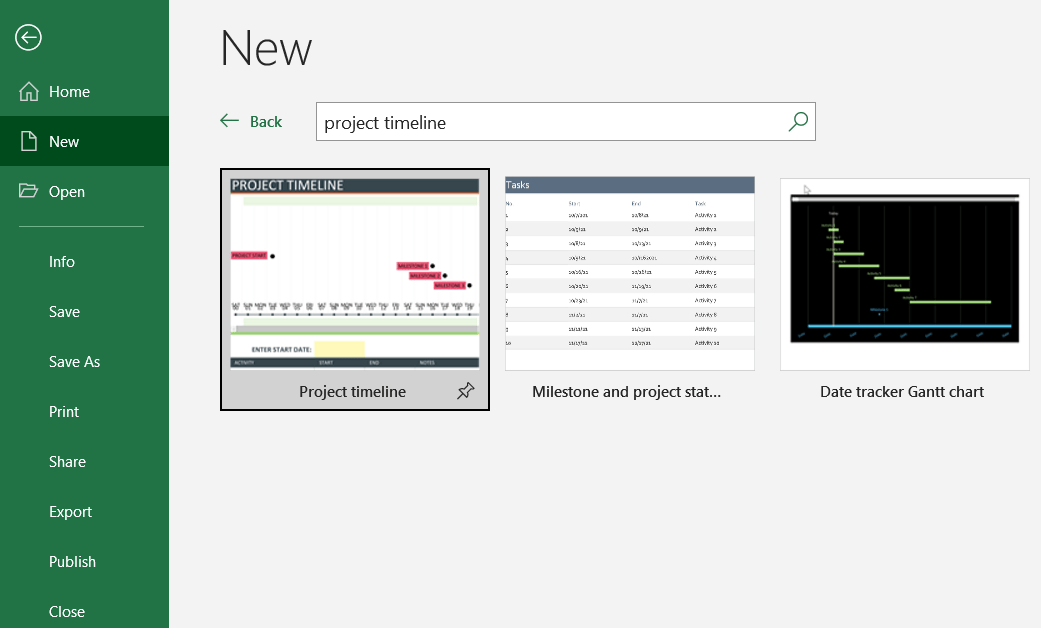
How do I create a project milestone timeline in Excel?
The simplest way to create a project milestone timeline in Excel is to use the spreadsheet platform’s native “Project timeline” template. It includes milestones as well as a customizable data table needed for your timeline. You can find the project timeline template in Excel by going to File > New and searching for “project timeline”:
An equally simple, yet more effective way is to use your Excel data to automatically generate a project milestone timeline directly in PowerPoint, with the help of our PowerPoint add-in, Office Timeline. You can use the resulting visual in any Excel spreadsheet, Word document, or PowerPoint presentation. Your timeline may look like this:
For this, you’ll first need to install the free trial of the premium edition. Then, once ready, you simply pick a preferred template, type in or copy-paste your data from Excel, and you are all set. As simple as that!
How do I convert Excel data to timeline?
There are two ways to convert Excel data into a timeline: either using Excel’s native features or leveraging the power of an automated timeline maker. Below, we’ll briefly describe the steps for each method.
-
In Excel:
-
Use a template. Type in your data, then format the timeline.
PROs:
-
The templates are easily accessible.
CONs:
-
Not too many options to choose from.
-
The quality of the resulting visuals is often mediocre.
-
Limited and time-consuming customization functionalities.
-
-
Build a timeline from scratch. Go to Insert > Illustrations > SmartArt, selecting Processes in the window that opens next, and then choosing the timeline layout that you want to use.
PROs:
-
This solution is easily accessible since it uses Excel’s built-in tools.
CONs:
-
Offers few layout options.
-
Time-consuming formatting work required to customize a timeline in Excel.
-
The result does not look really professional.
-
-
-
With Office Timeline, the PowerPoint add-in timeline creator: Select a template you like, then type your data in the data entry wizard.
PROs:
- A rich gallery of pre-built templates to choose from.
- Easy-to-use interface.
- Professionally looking output.
- A free trial to the add-in’s premium edition is available.
CONs: Needs downloading and installation.
How do I move a timeline from Excel to PowerPoint?
Here are the main 3 ways in which you can move a timeline from Excel to PowerPoint:
-
Just copy the timeline from Excel (CTRL + C), place your cursor on the destination slide in PowerPoint, and paste it there (CTRL + V).
-
Use this method if you don’t need to edit the timeline after inserting it in PowerPoint.
-
-
Save the Excel timeline as a picture (right-click on it + Save as Picture…), then insert it into your PowerPoint slide (by going to Insert > Pictures > Insert Picture From > This Device and looking for the image you just saved).
-
Use this method if you don’t need to edit the timeline after inserting it in PowerPoint.
-
-
Use our free automated timeline maker, Office Timeline PowerPoint add-in:
3.1 Just copy-paste your Excel data directly into the add-in’s data entry wizard. The add-in will then automatically turn it into a timeline right inside PowerPoint.
-
Use this method if you need to edit the timeline after inserting it in PowerPoint. With Office Timeline, you can change the looks of your timeline and update the data as many times as you need.
3.2 Import your data from Excel. By doing so, you will link your PowerPoint slide to the source Excel file and be able to refresh the PowerPoint timeline whenever making changes to your Excel data.
-
Use this method if you need to edit the Excel file after importing data into Office Timeline. You can update your imported timeline directly in PowerPoint by clicking the Refresh Data button on the Office Timeline tab.
-
Make a great looking timeline from Excel directly in PowerPoint
There is an easier way to put your Excel data into a good-looking timeline. PowerPoint is better suited than Excel for making impressive timelines that clients and executives want to see.
In the tutorial below, we will show you how to quickly paste the Excel table you created above in Step 1 into PowerPoint using Office Timeline, a user-friendly PowerPoint add-in that instantly makes and updates timelines from Excel. To begin, you will need to install Office Timeline, which will add a timeline creator tab to PowerPoint.
1. Open PowerPoint and paste your table into the Office Timeline wizard.
-
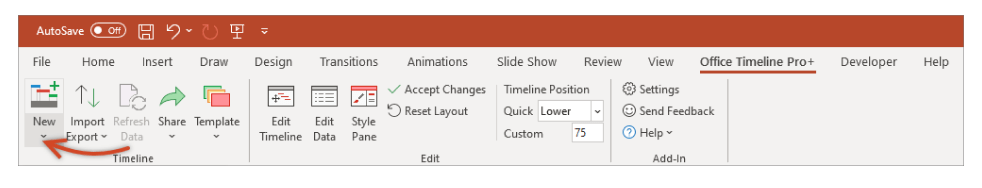
Inside PowerPoint, click on the Office Timeline tab, and then click the New icon.
This will open a gallery where you can choose between various timeline styles, stock templates and even custom templates.
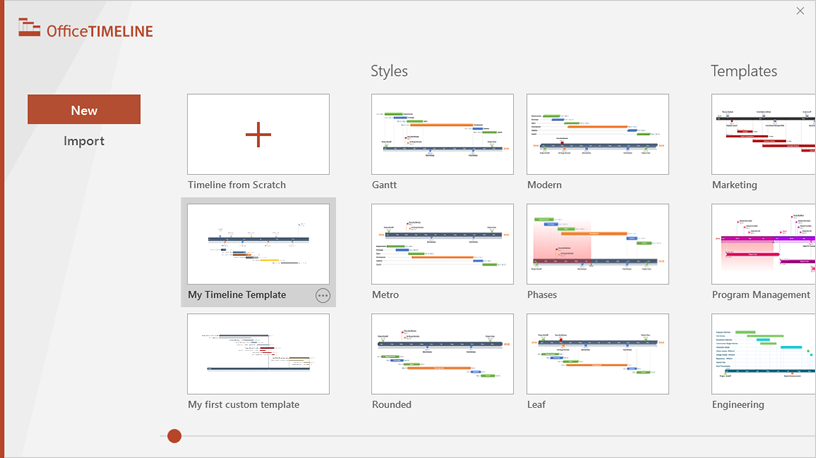
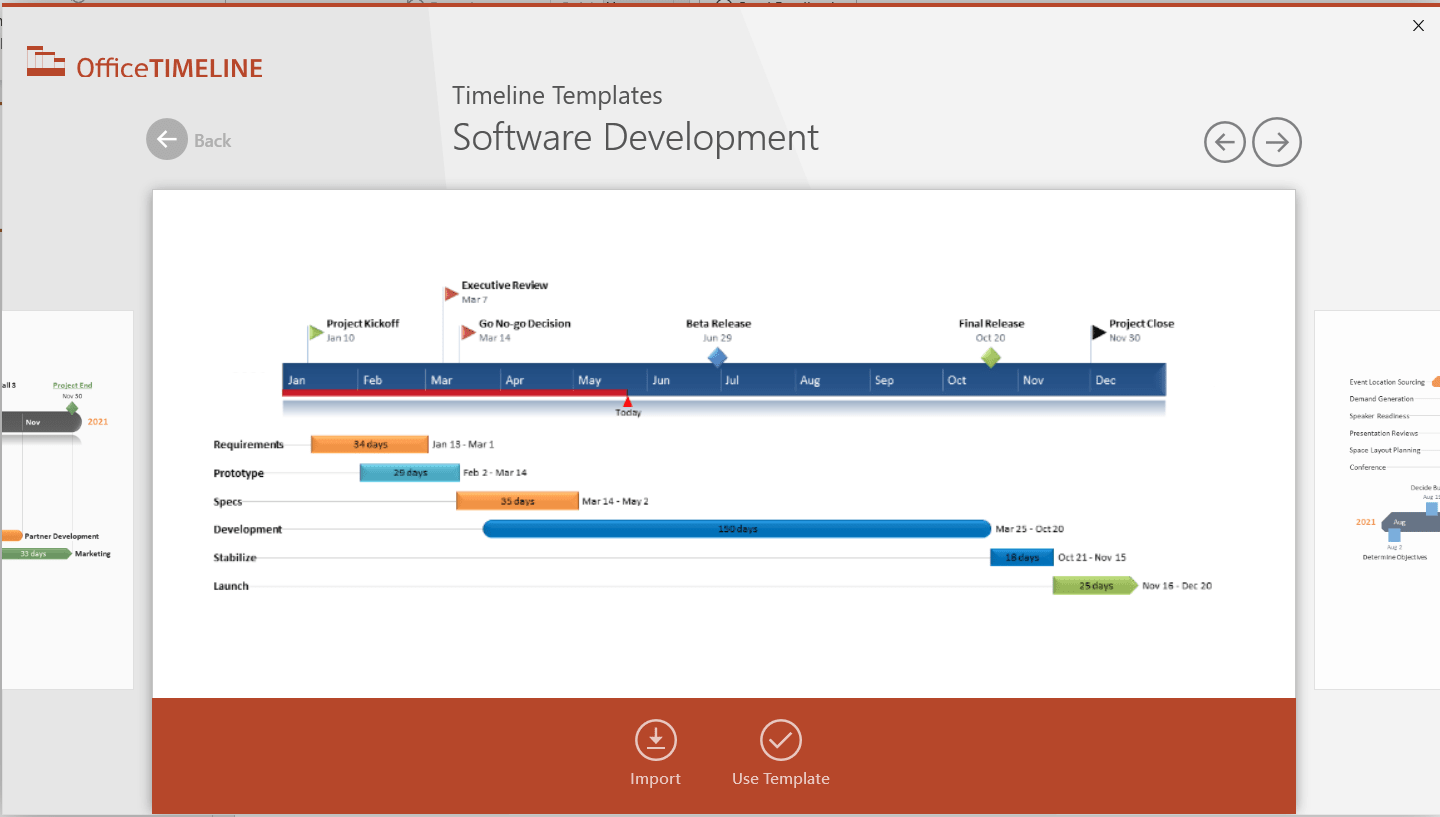
-
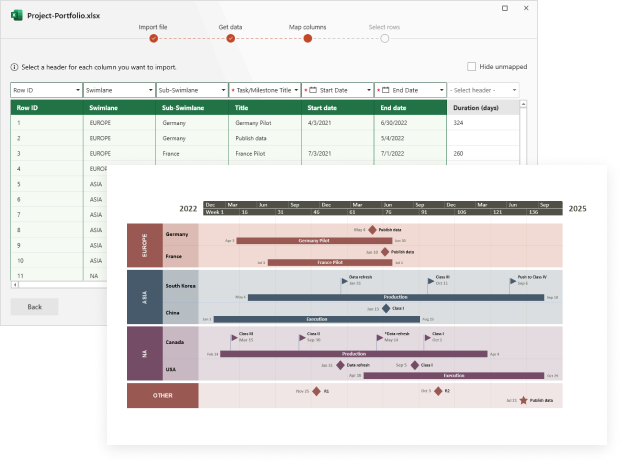
From the gallery, double-click the style or template you wish to use for your timeline to open its preview window and then select Use Template. (You can find more designs in our timeline templates library.) For this demonstration, we will choose the Software Development timeline template. If you prefer to import and refresh your Excel table, rather than copy-paste, click on the Import button in the preview window.
-
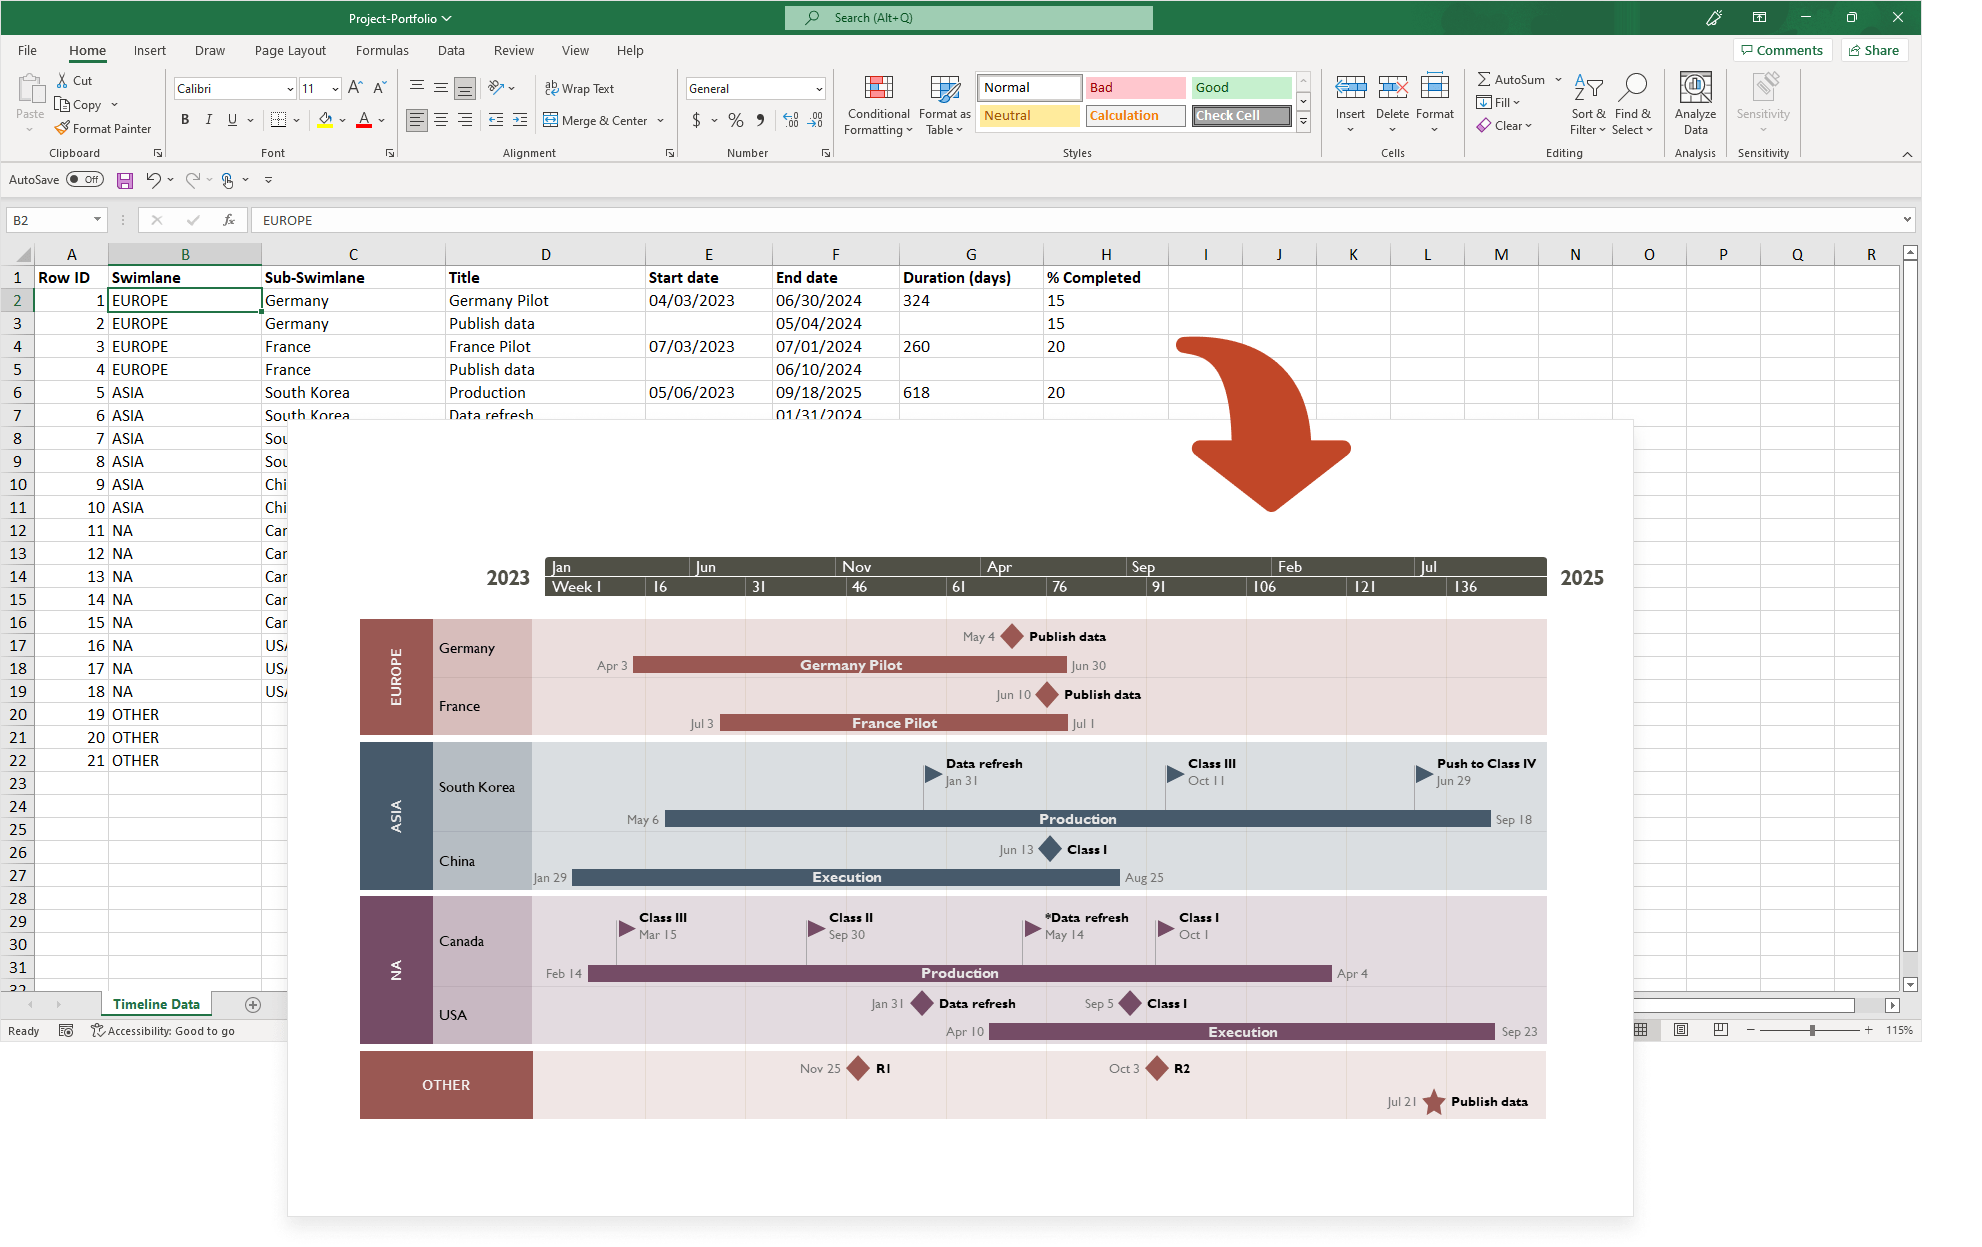
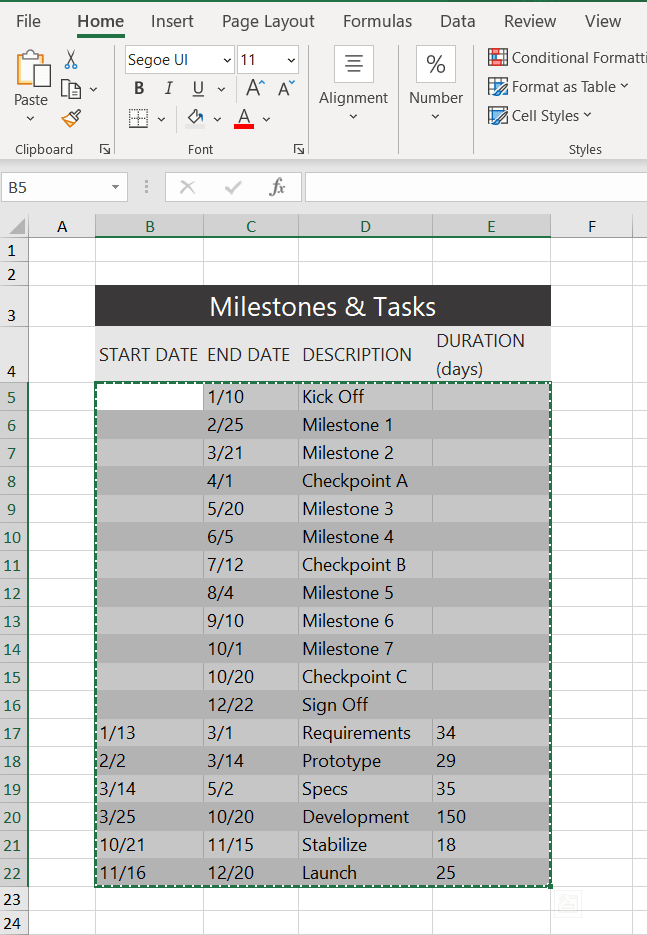
Copy the data from Excel
We have updated our data a bit, so that we get the timeline, but also a more detailed view of our project: we deleted the Timeline column, as we don’t need it, and added a list of tasks (with start and end dates and duration).
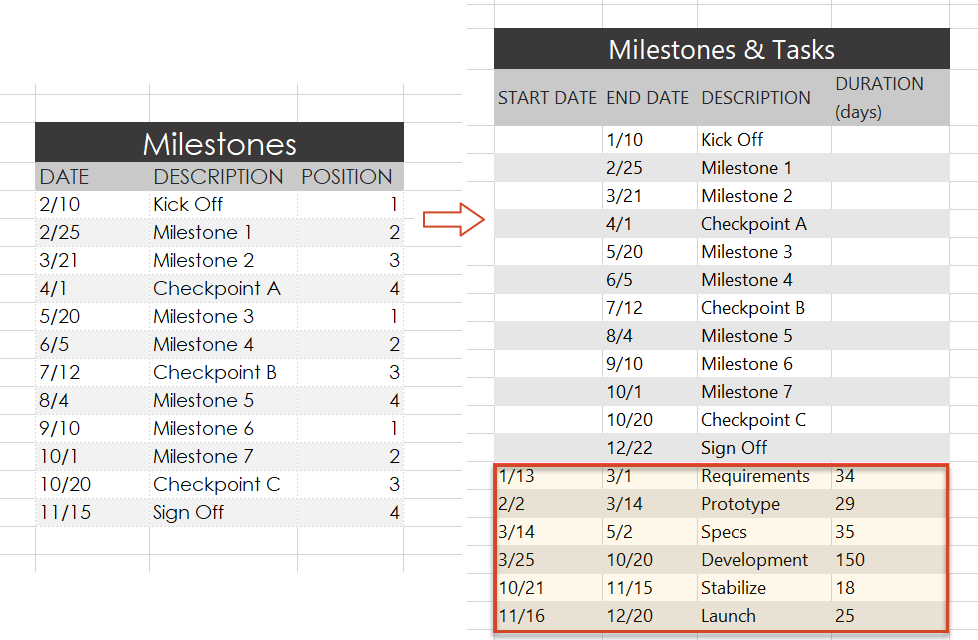
Copy the data from your Excel table, but make sure not to include the column headers.
-
Now, simply paste the section into PowerPoint by using the Paste button in the upper-right corner of the Data Entry wizard.
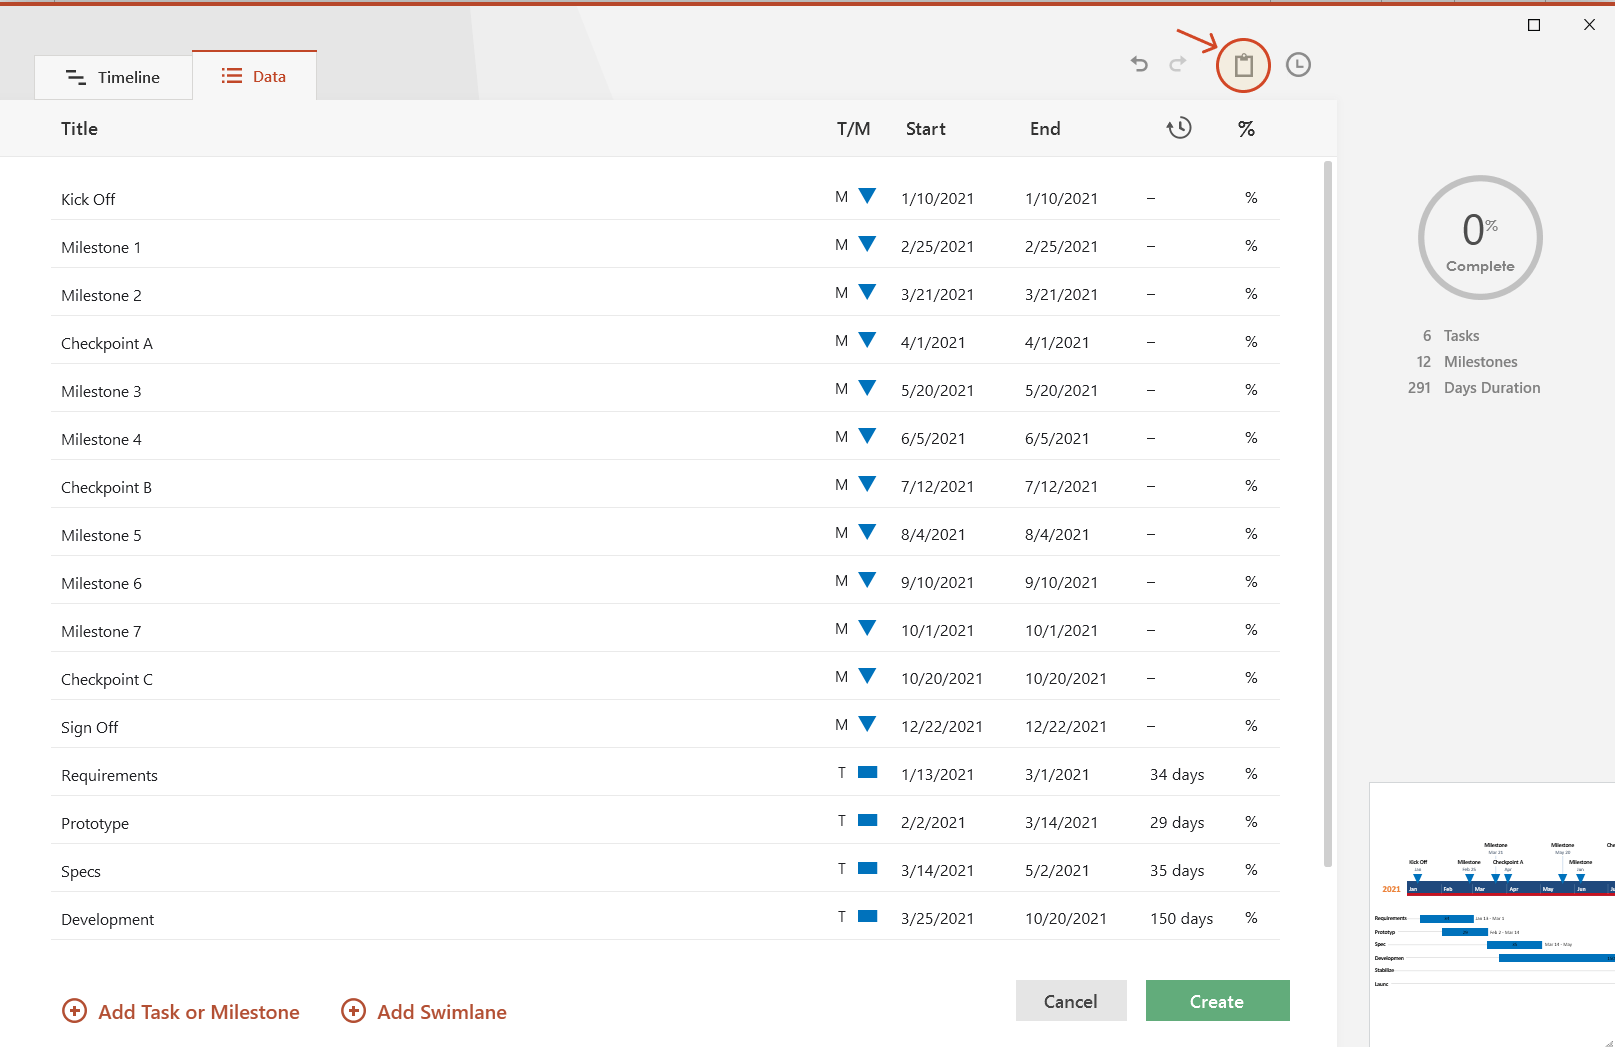
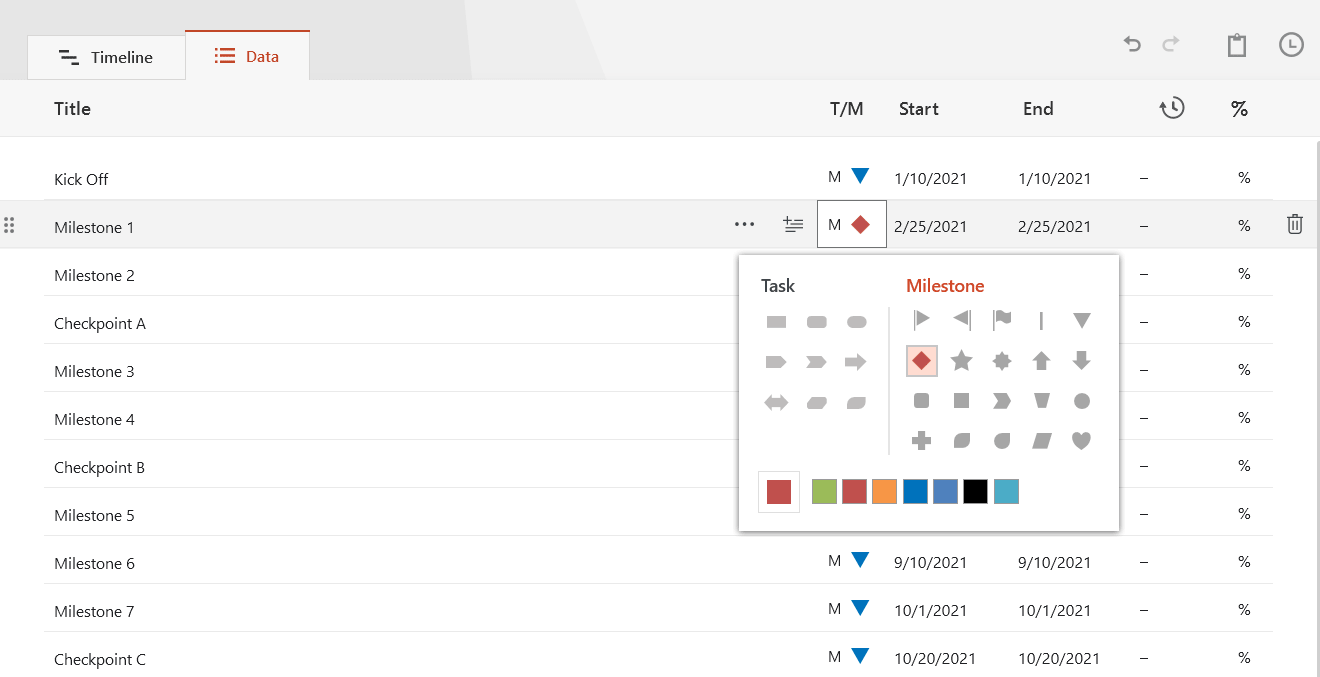
Make edits if necessary (such as changing milestone shapes and colors or adding and removing items) and click the Create button.
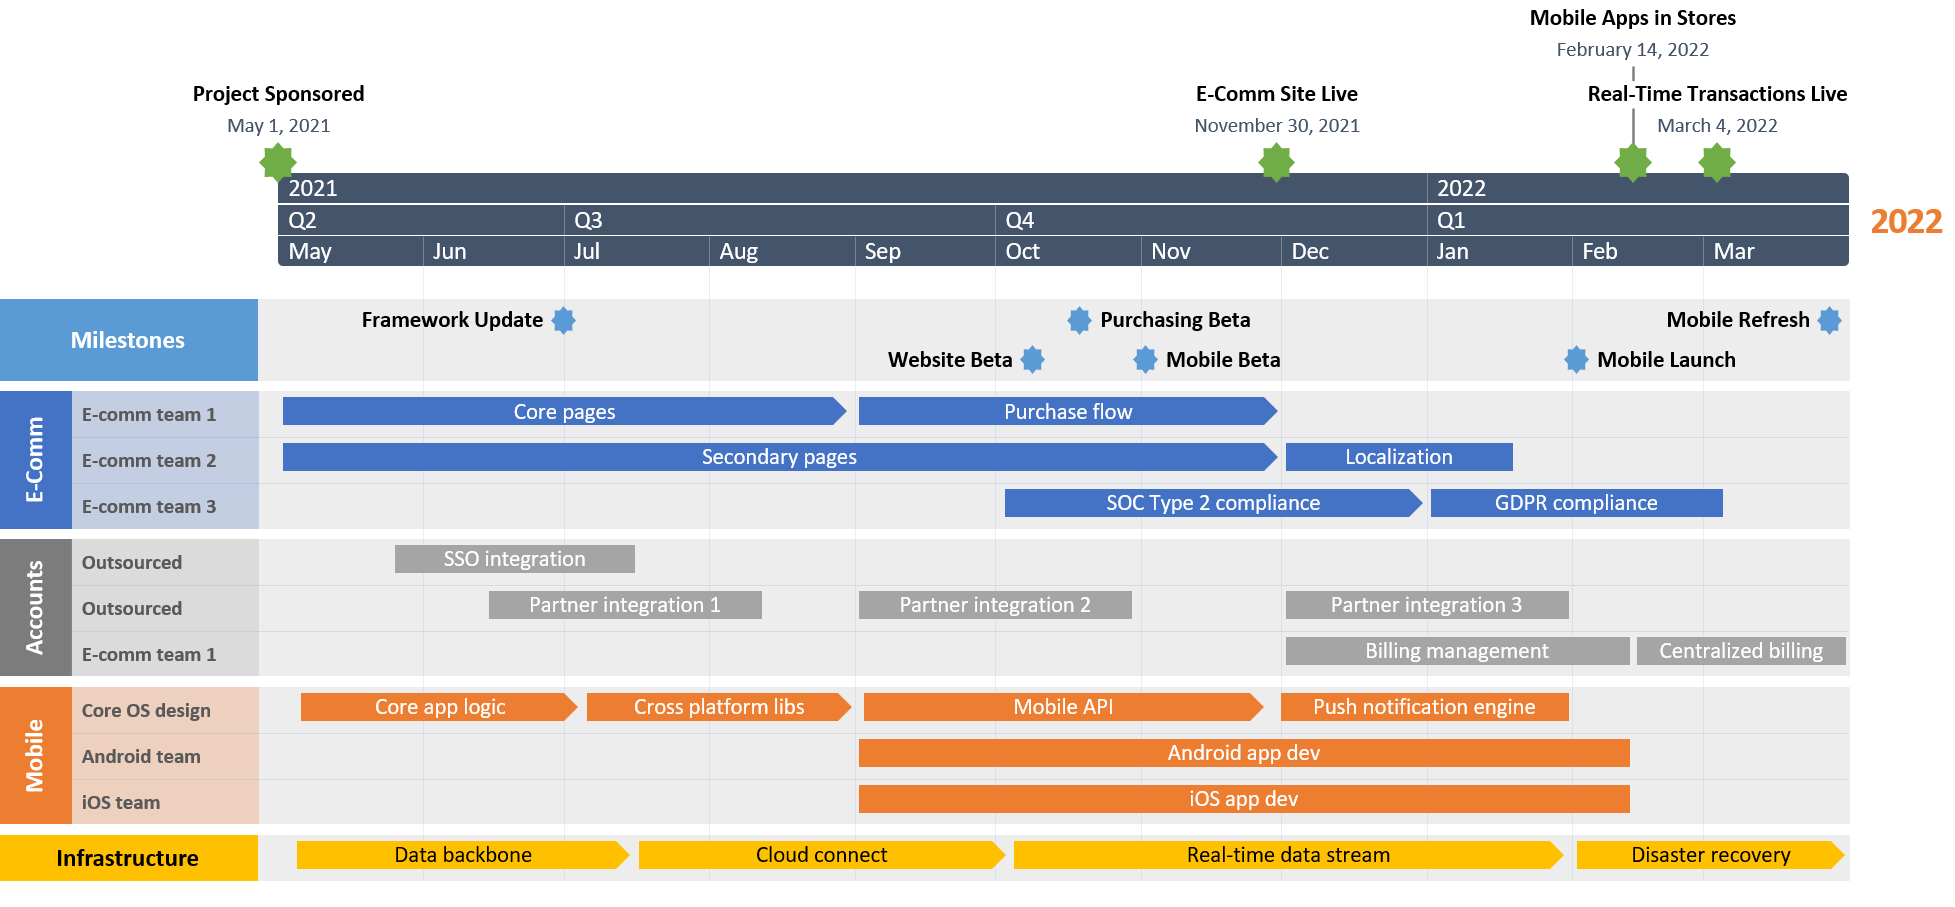
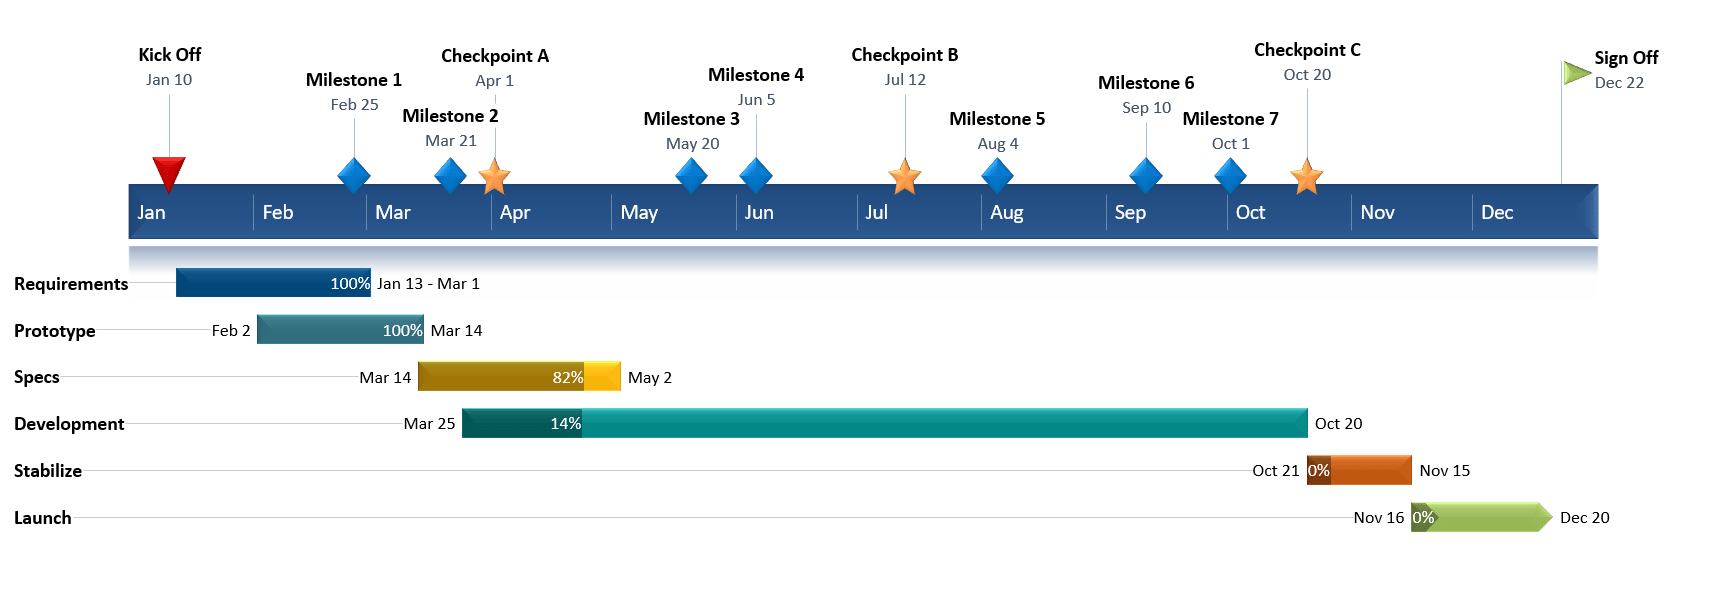
2. Instantly, you will have a new timeline slide in PowerPoint.
-
Depending on the template or style you selected from the gallery, you will have a timeline similar to this:
-
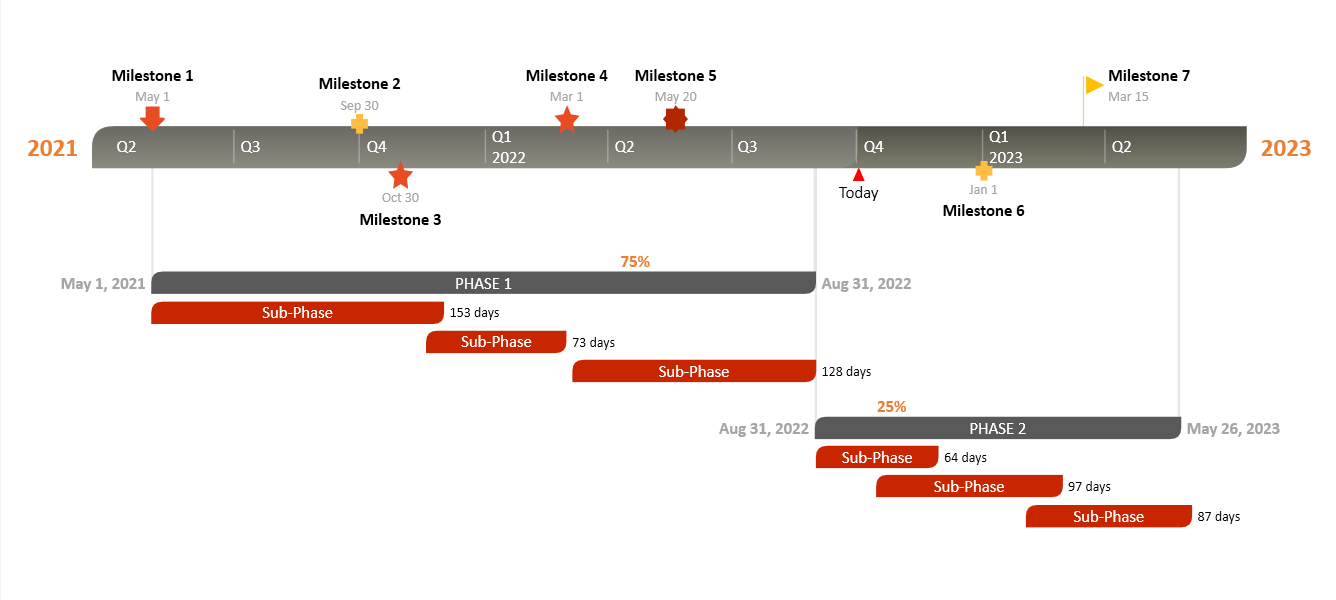
You can easily customize the timeline further using Office Timeline. In our example above, we added percent complete, removed the Today’s Date marker, changed milestones, adjusted colors, and added tasks to create a Gantt chart.
How to make a PowerPoint timeline from Excel in under 60 seconds:
You can also use Office Timeline’s online timeline maker to easily build timelines and other similar visuals that you can instantly update and share with executives and teams.
- Additional resources
- Make a timeline
-
Make a timeline from Excel data in under 1 minute. -
-


See our free timeline template collection

Incident Response Plan
Free, downloadable timeline graphic using hours and minutes to give a clear overview on how an organization needs to plan its reaction to incidents so that outage be limited and activity resumed as soon as possible.

Crisis Management Plan
Professionally-designed timeline example structured in swimlanes that covers all the steps and processes one needs to follow in a crisis management process, from when the crisis occurs to response, business continuity process, recovery, and review.

Swimlane Diagram
Swimlane PowerPoint template that clearly lays out the framework of a project, from scheduling activities to task assignment and resource management.

Marketing Swimlanes Roadmap
Swimlane diagram example that provides a crisp, well-structured illustration of the tasks and milestones of your marketing campaign, according to the phase of the campaign to which they belong.

Marketing Plan
Free marketing timeline model that, once customized, effectively outlines your overall marketing strategy and serves as a solid visual aid to support marketing plan presentations.

Project Plan
Intuitive PowerPoint slide that serves as a quick yet visually effective alternative to complex project management tools to produce clear, well-laid-out plans for launching a project.

Sales Plan
Easy-to-edit sales plan sample for sales leaders, marketers or account executives to lay out objectives against a timeband in weeks; it can be customized to show campaign plans and targets in months, quarters or years.

Example Timeline
Visual template with Today’s Date indicator that helps enterprise workers get a quick start on creating timelines for project reviews, status reports, or any presentations that require a simple project schedule.

Blank Timeline
Generic timeline example that can be easily customized to quickly make an impressive, high-level summary of important events in a chronological order.